

Key Insights into the parenteral nutrition Market
The global parenteral nutrition Market is poised for robust expansion, projected to grow from an estimated $7.94 billion in 2024 to a significant valuation by 2034, propelled by a Compound Annual Growth Rate (CAGR) of 5.9%. This growth trajectory is fundamentally driven by the escalating prevalence of chronic diseases leading to malnutrition, an aging global demographic, and advancements in clinical nutrition therapies. Parenteral nutrition (PN) serves as a critical life-sustaining intervention for patients unable to absorb nutrients via the gastrointestinal tract, encompassing a diverse range of indications from short bowel syndrome to cancer-related malnutrition.
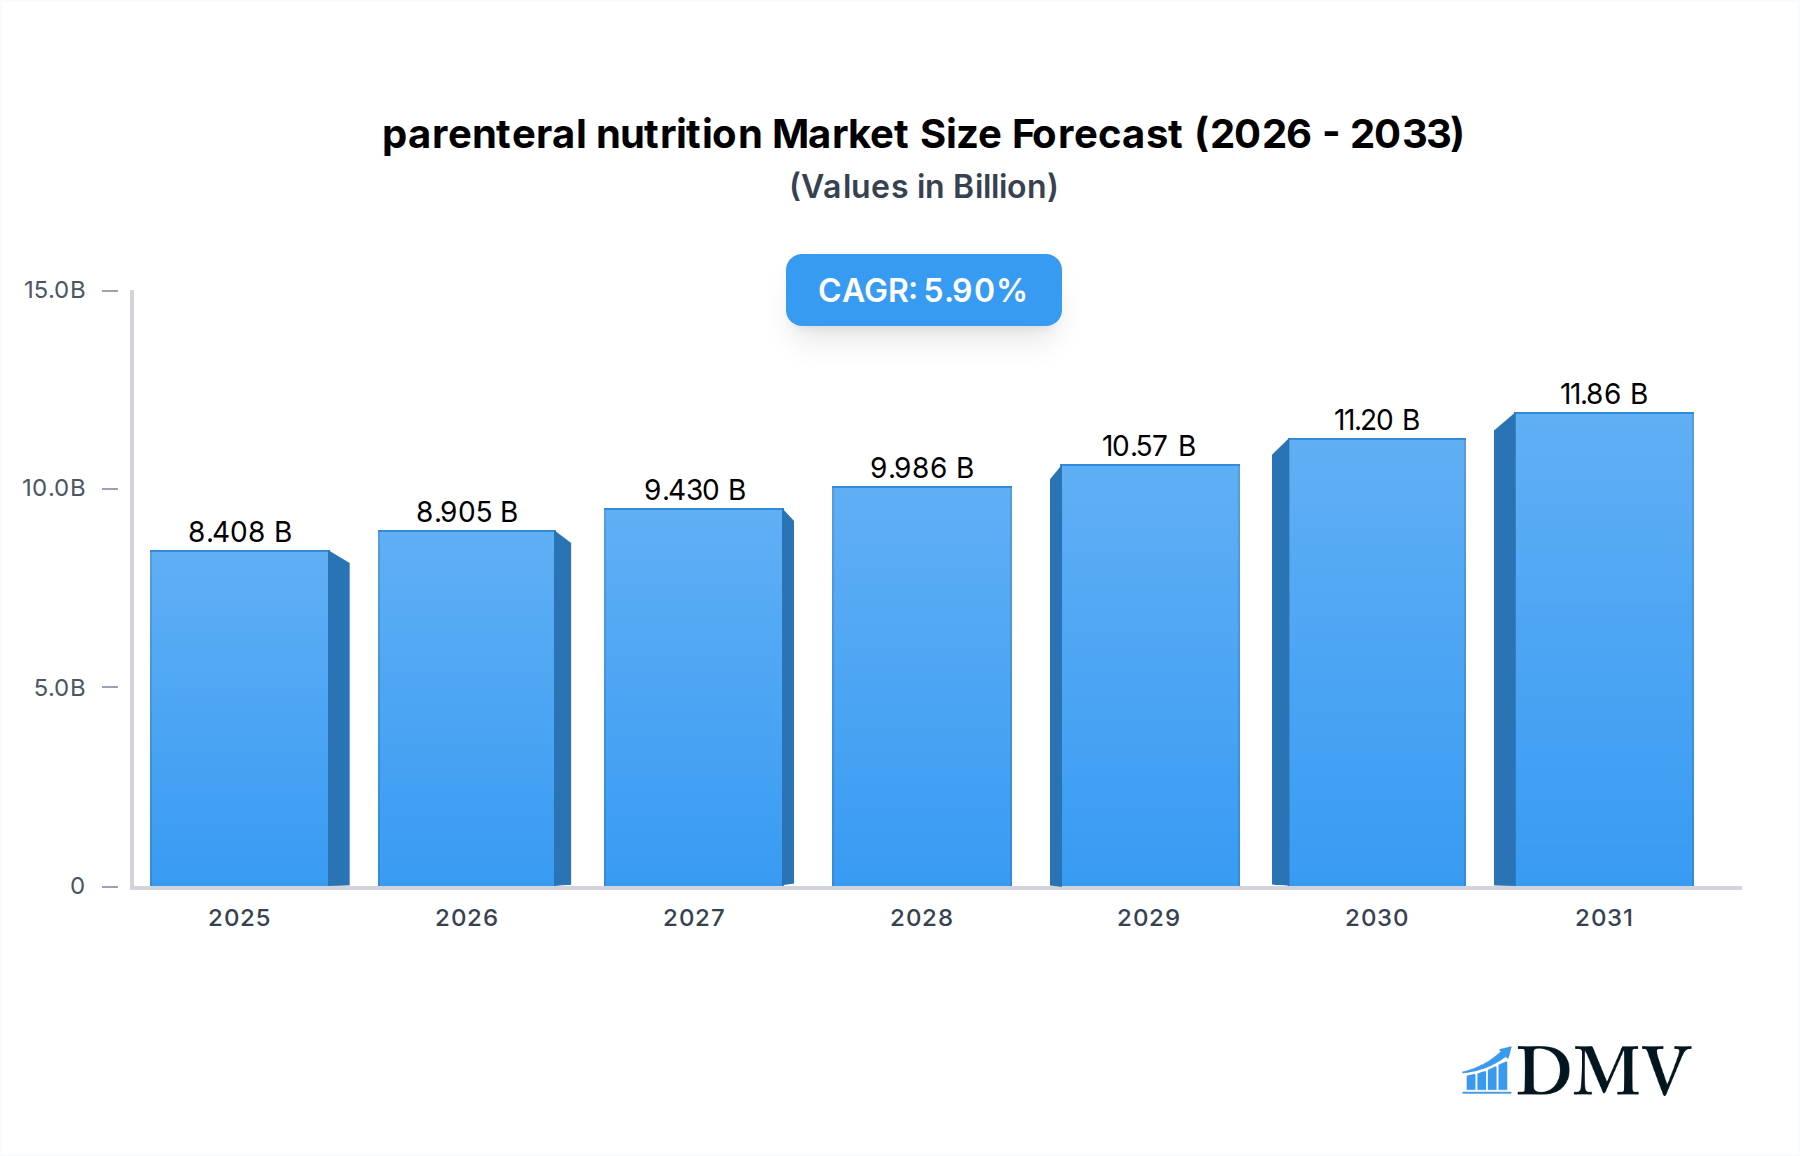
parenteral nutrition Market Size (In Billion)
Key demand drivers for the parenteral nutrition Market include the increasing incidence of complex surgical procedures, a rise in premature births necessitating specialized neonatal nutrition, and growing awareness regarding the adverse outcomes of hospital-acquired malnutrition. Macro tailwinds, such as enhanced healthcare infrastructure in emerging economies, increased expenditure on patient care, and a shift towards personalized medicine, are further accelerating market expansion. Technological innovations in PN formulation, particularly the development of multi-chamber bags for ease of administration and improved stability, are enhancing safety and efficacy, thereby improving patient outcomes. The ongoing integration of digital health solutions and remote patient monitoring is also facilitating the broader adoption of home parenteral nutrition, reducing hospital stays and improving quality of life for long-term PN patients.

parenteral nutrition Company Market Share
From a forward-looking perspective, the parenteral nutrition Market is expected to witness continued innovation in lipid emulsions, amino acid profiles, and trace element formulations to minimize complications and optimize metabolic support. Strategic collaborations among pharmaceutical companies, healthcare providers, and research institutions are anticipated to drive product development and market penetration. Furthermore, the expansion of healthcare access and reimbursement policies, particularly in developing regions, will unlock significant untapped potential. The demand for specialized PN tailored for specific age groups—adult, pediatric, and neonatal—and therapeutic indications such as Crohn's disease and intestinal failure will continue to shape market dynamics, fostering a competitive landscape focused on efficacy, safety, and convenience.
Hospital/Clinical PN Dominance in the parenteral nutrition Market
Within the broader parenteral nutrition Market, the Hospital/Clinical PN segment consistently holds the largest revenue share, a trend anticipated to continue throughout the forecast period. This dominance is primarily attributable to the critical role of hospitals and clinical settings in initiating and managing parenteral nutrition for patients with acute conditions, severe malnutrition, or complex medical needs requiring intensive monitoring. These facilities serve as the primary point of care for individuals undergoing major surgeries, recovering from trauma, or suffering from critical illnesses such as sepsis, burns, or advanced gastrointestinal disorders, where enteral feeding is contraindicated or insufficient. The sheer volume of patients admitted annually across acute care, long-term care, and specialized clinics globally underpins the substantial market share held by Hospital/Clinical PN.
The rationale behind its dominance extends to several factors. Firstly, the intricate nature of PN administration, which involves precise calculation, aseptic compounding (in many cases), and vigilant patient monitoring for metabolic complications or infections, often necessitates the specialized infrastructure and trained personnel available only in a hospital environment. Secondly, the immediate and often life-saving requirement for nutritional support in critically ill patients means that PN initiation is predominantly a hospital-driven decision. Key players like Baxter, B. Braun, and Fresenius Kabi have robust portfolios catering specifically to hospital needs, including multi-chamber bags, compounding services, and complementary infusion systems, thereby cementing their position in this segment. The continuous influx of new patients requiring initial stabilization and the transition from oral or enteral routes to PN within these settings contribute significantly to the segment's enduring lead. While the Home Healthcare Market is growing rapidly, the initial and often complex phases of parenteral nutrition therapy typically originate in the hospital setting before patients are transitioned to home care, if appropriate. The stringent regulatory requirements and quality control measures for PN products further underscore the reliance on established hospital protocols and pharmaceutical suppliers dedicated to these high standards. This segment is not merely maintaining its share but is also seeing growth driven by the expansion of hospital capacities, particularly in emerging economies, and the increasing complexity of medical interventions that necessitate aggressive nutritional support strategies.
Key Market Drivers in the parenteral nutrition Market
The parenteral nutrition Market is significantly influenced by several quantifiable drivers shaping its trajectory. A primary driver is the rising global burden of chronic diseases, which frequently lead to severe malnutrition or malabsorption. For instance, the incidence of cancer-related malnutrition, often necessitating PN due to chemotherapy-induced mucositis or surgical resections impacting nutrient absorption, continues to climb. Similarly, the increasing prevalence of gastrointestinal disorders, including inflammatory bowel diseases like Crohn's disease and ulcerative colitis, as well as short bowel syndrome, directly fuels demand for PN. These conditions often compromise the gut's ability to absorb nutrients, making intravenous feeding essential. According to WHO data, non-communicable diseases (NCDs) are responsible for 74% of deaths globally, many of which involve prolonged illness states where nutritional support is crucial.
Another significant impetus comes from the demographic shift towards an aging global population. Older adults are disproportionately affected by chronic conditions, polypharmacy, and sarcopenia, all of which contribute to malnutrition. As the global population aged 60 years or over is projected to reach 2.1 billion by 2050, the demand for nutritional interventions, including parenteral nutrition, will commensurately increase. The expanding scope of the Home Healthcare Market also acts as a driver, with technological advancements enabling safer and more convenient administration of PN outside traditional hospital settings. This shift reduces healthcare costs and improves patient quality of life, making long-term PN therapy more accessible. Additionally, the continuous innovation in the Medical Devices Market, particularly in advanced infusion pumps and catheter technologies, has enhanced the safety and efficiency of PN delivery, minimizing complications and improving patient compliance. This technological integration is crucial for the sustained growth of the parenteral nutrition Market by making therapies more viable and effective for a broader patient population.
Competitive Ecosystem of the parenteral nutrition Market
The parenteral nutrition Market is characterized by the presence of both established multinational corporations and a growing number of regional players, all vying for market share through product innovation, strategic partnerships, and geographical expansion.
- Baxter: A global leader in clinical nutrition, Baxter offers a comprehensive portfolio of parenteral nutrition products, including multi-chamber bags and compounding services, focusing on ready-to-use solutions and personalized patient care.
- B. Braun: Known for its broad range of healthcare solutions, B. Braun provides a variety of PN products, including standard and customized formulations, emphasizing safety, efficacy, and ease of administration in both hospital and home settings.
- Fresenius Kabi: This company is a significant player in the clinical nutrition segment, offering an extensive array of parenteral and enteral nutrition products, infusion therapies, and medical devices, with a strong focus on chronic disease management and critical care.
- Kelun Pharma: A prominent Chinese pharmaceutical company, Kelun Pharma is expanding its presence in the parenteral nutrition Market, focusing on developing and manufacturing a wide range of intravenous infusions, including nutrient solutions, for the domestic and international markets.
- Otsuka Pharmaceutical: A Japanese pharmaceutical giant, Otsuka is involved in the parenteral nutrition sector, particularly with its solutions for fluid and electrolyte management and specialized nutritional formulations for various therapeutic indications.
- JW Pharmaceutical: A South Korean pharmaceutical company, JW Pharmaceutical is a key regional player providing a range of medical products, including advanced parenteral nutrition formulations designed for comprehensive patient support.
- Grifols: Specializing in plasma-derived medicines and other critical care solutions, Grifols also contributes to the parenteral nutrition Market through its specialized lipid emulsions and solutions, often used in conjunction with other nutritional components.
- Haisco Pharmaceutical Group: Another significant Chinese pharmaceutical enterprise, Haisco focuses on R&D, manufacturing, and sales of innovative drugs, including various intravenous solutions and nutritional support therapies.
- King York: A Chinese pharmaceutical company contributing to the domestic parenteral nutrition Market with its range of infusion solutions and nutritional products, catering to a growing patient base.
- Cisen: Operating in the Chinese pharmaceutical market, Cisen develops and produces a variety of intravenous preparations, including those used for nutritional support in clinical settings.
- BBCA Pharmaceutical: With a focus on bio-fermentation, BBCA Pharmaceutical is involved in producing raw materials and finished products for the pharmaceutical industry, including components relevant to the parenteral nutrition Market.
- Biokin Pharmaceutical: This company provides pharmaceutical products in China, including various forms of intravenous infusions and nutrient solutions critical for patient recovery and sustenance.
Recent Developments & Milestones in the parenteral nutrition Market
- October 2023: A leading pharmaceutical company received FDA approval for a new multi-chamber bag formulation designed for pediatric parenteral nutrition, offering enhanced stability and simplified preparation for healthcare providers.
- August 2023: A significant partnership was announced between a medical device manufacturer and a PN provider to integrate smart infusion pumps with PN bag systems, aiming to improve dose accuracy and reduce medication errors in clinical settings.
- June 2023: New clinical guidelines were published by a major medical society, recommending updated protocols for initiating and monitoring home parenteral nutrition, emphasizing patient education and remote support through the Home Healthcare Market.
- April 2023: A key player in the Clinical Nutrition Market launched a new lipid emulsion product containing a refined omega-3 fatty acid profile, designed to reduce inflammation and improve clinical outcomes in critically ill patients requiring PN.
- January 2023: Regulatory authorities in the European Union approved several new Ready-to-Use PN Bags Market products, streamlining procurement and reducing preparation time for hospitals across the region.
- November 2022: An acquisition in the Compounded Parenteral Nutrition Market expanded the service offerings of a major competitor, allowing for broader access to custom-tailored PN solutions for patients with unique nutritional requirements.
- September 2022: Research published demonstrated the long-term benefits of early parenteral nutrition intervention in patients with severe gastrointestinal failure, leading to improved survival rates and quality of life.
Regional Market Breakdown for the parenteral nutrition Market
The global parenteral nutrition Market exhibits significant regional variations in terms of market size, growth dynamics, and underlying demand drivers. North America and Europe currently represent the most mature markets, commanding substantial revenue shares due to advanced healthcare infrastructures, high healthcare expenditure, and a well-established regulatory framework. In North America, particularly the United States, the market is driven by a high prevalence of chronic diseases, a growing aging population, and a strong emphasis on specialized nutritional support in acute and home care settings. The regional CAGR aligns closely with the global average of 5.9%, with continuous innovation in product formulations and delivery systems. The robust medical insurance penetration and reimbursement policies further support the adoption of parenteral nutrition therapies in this region.
Europe also holds a significant share, characterized by an aging demographic and a high incidence of gastrointestinal disorders. Countries like Germany, France, and the UK are major contributors, with strong clinical guidelines and a focus on improving patient outcomes through nutritional interventions. The region's regulatory environment, governed by the European Medicines Agency (EMA), ensures high standards for PN products, contributing to market stability. However, growth might be marginally slower than global averages due to market maturity.
Asia Pacific is identified as the fastest-growing region in the parenteral nutrition Market. This rapid expansion is fueled by an enormous patient pool, improving healthcare access, increasing disposable incomes, and the modernization of healthcare facilities across countries like China, India, and Japan. The rising awareness of malnutrition, coupled with government initiatives to enhance healthcare infrastructure, creates fertile ground for market expansion. The demand for both Ready-to-Use PN Bags Market and Compounded Parenteral Nutrition Market is surging as these nations adopt Western medical practices and technologies. Furthermore, the growth of the Clinical Nutrition Market in this region is exponential, providing a strong foundation for PN market growth.
Conversely, regions in Latin America and the Middle East & Africa are emerging markets with considerable untapped potential. While currently possessing smaller market shares, these regions are projected to experience accelerated growth due to improving economic conditions, expanding healthcare services, and increasing adoption of advanced medical treatments. However, challenges related to healthcare infrastructure, affordability, and regulatory frameworks can impede faster growth compared to Asia Pacific.

parenteral nutrition Regional Market Share
Supply Chain & Raw Material Dynamics for the parenteral nutrition Market
The supply chain for the parenteral nutrition Market is inherently complex, involving the sourcing and processing of numerous pharmaceutical-grade raw materials, precision manufacturing, and a highly regulated distribution network. Upstream dependencies include key nutrient components such as Amino Acids Market (e.g., L-amino acids), Lipids Market (e.g., soybean oil, fish oil, olive oil), Carbohydrates Market (e.g., dextrose monohydrate), vitamins, and trace elements. The global sourcing of these inputs creates vulnerabilities to geopolitical events, trade policies, and natural disasters, which can lead to significant supply chain disruptions. For example, fluctuations in agricultural commodity prices can directly impact the cost of dextrose and certain lipid sources, influencing the overall production cost of PN solutions. Historically, global logistical challenges, such as those experienced during the COVID-19 pandemic, demonstrated how disruptions in freight and manufacturing capacity could lead to shortages of critical PN components and finished products.
Price volatility of key inputs remains a constant concern. Amino acids, often sourced from bio-fermentation processes, can see price shifts due to energy costs and industrial production capacities. Similarly, the specialized nature of pharmaceutical-grade vitamins and trace elements means their supply is often concentrated among a few key manufacturers, creating potential bottlenecks. Furthermore, the availability and cost of packaging materials, such as specialized plastic films for multi-chamber bags and glass bottles for sterile solutions, also play a role. Manufacturers within the parenteral nutrition Market continually seek to diversify their raw material suppliers and optimize inventory management to mitigate these risks. The increasing demand for specialized PN formulations, including those for the Home Healthcare Market, also places pressure on the supply chain to ensure consistent availability of diverse ingredients. Investment in regional manufacturing capabilities and redundant supply lines is becoming a strategic imperative for major players to enhance resilience against future disruptions.
Regulatory & Policy Landscape Shaping the parenteral nutrition Market
The parenteral nutrition Market operates under stringent regulatory frameworks across key geographies, reflecting the high-risk nature of intravenous administration and the critical importance of nutritional support. Major regulatory bodies like the U.S. Food and Drug Administration (FDA), the European Medicines Agency (EMA), and the National Medical Products Administration (NMPA) in China set comprehensive guidelines for the manufacturing, labeling, quality control, and post-market surveillance of PN products. These regulations cover everything from the purity and concentration of individual nutrients (Amino Acids Market, Lipids Market, etc.) to the sterility and stability of Ready-to-Use PN Bags Market and Compounded Parenteral Nutrition Market solutions.
Recent policy changes have largely focused on enhancing patient safety and improving product quality. For instance, the FDA has issued guidance on preventing drug shortages of essential medical products, including PN components, and has emphasized robust quality management systems for manufacturers. In Europe, the revision of Good Manufacturing Practices (GMP) and pharmacopoeia monographs continues to drive higher standards for sterile products. There is also a growing emphasis on standardization of PN formulations to reduce errors and improve patient outcomes, particularly for vulnerable populations such as neonates and pediatric patients.
Furthermore, policies related to reimbursement and healthcare expenditure significantly influence market access and adoption. Government and private insurance policies determine the extent to which PN therapy, especially long-term Home Healthcare Market PN, is covered, directly impacting patient affordability and market growth. Policy initiatives promoting home-based care and reducing hospital readmissions are favorable to the parenteral nutrition Market, as they encourage the transition of stable PN patients from clinical settings to home care. Conversely, increasing regulatory hurdles for new product approvals or stricter guidelines on compounding can increase development costs and potentially delay market entry for innovative solutions, impacting the overall growth of the Clinical Nutrition Market.
parenteral nutrition Segmentation
-
1. Product Type
- 1.1. Ready-to-Use (RTU) PN Bags
- 1.2. Compounded Parenteral Nutrition (PN)
-
2. Care Setting
- 2.1. Hospital/Clinical PN
- 2.2. Home Parenteral Nutrition
-
3. Nutrient Type
-
3.1. Macronutrients
- 3.1.1. Amino Acids
- 3.1.2. Lipids
- 3.1.3. Carbohydrates
-
3.2. Micronutrients
- 3.2.1. Vitamins
- 3.2.2. Trace Elements
- 3.2.3. Electrolytes
-
3.1. Macronutrients
-
4. Therapeutic Indication
- 4.1. Short Bowel Syndrome
- 4.2. Cancer-Related Malnutrition
- 4.3. Gastrointestinal Disorders
- 4.4. Crohn's Disease
- 4.5. Intestinal Failure
- 4.6. Others
-
5. Age Group
- 5.1. Adult
- 5.2. Pediatric
- 5.3. Neonatal
parenteral nutrition Segmentation By Geography
-
1. North America
- 1.1. United States
- 1.2. Canada
- 1.3. Mexico
-
2. South America
- 2.1. Brazil
- 2.2. Argentina
- 2.3. Rest of South America
-
3. Europe
- 3.1. United Kingdom
- 3.2. Germany
- 3.3. France
- 3.4. Italy
- 3.5. Spain
- 3.6. Russia
- 3.7. Benelux
- 3.8. Nordics
- 3.9. Rest of Europe
-
4. Middle East & Africa
- 4.1. Turkey
- 4.2. Israel
- 4.3. GCC
- 4.4. North Africa
- 4.5. South Africa
- 4.6. Rest of Middle East & Africa
-
5. Asia Pacific
- 5.1. China
- 5.2. India
- 5.3. Japan
- 5.4. South Korea
- 5.5. ASEAN
- 5.6. Oceania
- 5.7. Rest of Asia Pacific
parenteral nutrition Regional Market Share
Geographic Coverage of parenteral nutrition
parenteral nutrition REPORT HIGHLIGHTS
| Aspects | Details |
|---|---|
| Study Period | 2020-2034 |
| Base Year | 2025 |
| Estimated Year | 2026 |
| Forecast Period | 2026-2034 |
| Historical Period | 2020-2025 |
| Growth Rate | CAGR of 5.9% from 2020-2034 |
| Segmentation |
|
Table of Contents
- 1. Introduction
- 1.1. Research Scope
- 1.2. Market Segmentation
- 1.3. Research Objective
- 1.4. Definitions and Assumptions
- 2. Executive Summary
- 2.1. Market Snapshot
- 3. Market Dynamics
- 3.1. Market Drivers
- 3.2. Market Restrains
- 3.3. Market Trends
- 3.4. Market Opportunities
- 4. Market Factor Analysis
- 4.1. Porters Five Forces
- 4.1.1. Bargaining Power of Suppliers
- 4.1.2. Bargaining Power of Buyers
- 4.1.3. Threat of New Entrants
- 4.1.4. Threat of Substitutes
- 4.1.5. Competitive Rivalry
- 4.2. PESTEL analysis
- 4.3. BCG Analysis
- 4.3.1. Stars (High Growth, High Market Share)
- 4.3.2. Cash Cows (Low Growth, High Market Share)
- 4.3.3. Question Mark (High Growth, Low Market Share)
- 4.3.4. Dogs (Low Growth, Low Market Share)
- 4.4. Ansoff Matrix Analysis
- 4.5. Supply Chain Analysis
- 4.6. Regulatory Landscape
- 4.7. Current Market Potential and Opportunity Assessment (TAM–SAM–SOM Framework)
- 4.8. DMV Analyst Note
- 4.1. Porters Five Forces
- 5. Market Analysis, Insights and Forecast 2021-2033
- 5.1. Market Analysis, Insights and Forecast - by Product Type
- 5.1.1. Ready-to-Use (RTU) PN Bags
- 5.1.2. Compounded Parenteral Nutrition (PN)
- 5.2. Market Analysis, Insights and Forecast - by Care Setting
- 5.2.1. Hospital/Clinical PN
- 5.2.2. Home Parenteral Nutrition
- 5.3. Market Analysis, Insights and Forecast - by Nutrient Type
- 5.3.1. Macronutrients
- 5.3.1.1. Amino Acids
- 5.3.1.2. Lipids
- 5.3.1.3. Carbohydrates
- 5.3.2. Micronutrients
- 5.3.2.1. Vitamins
- 5.3.2.2. Trace Elements
- 5.3.2.3. Electrolytes
- 5.3.1. Macronutrients
- 5.4. Market Analysis, Insights and Forecast - by Therapeutic Indication
- 5.4.1. Short Bowel Syndrome
- 5.4.2. Cancer-Related Malnutrition
- 5.4.3. Gastrointestinal Disorders
- 5.4.4. Crohn's Disease
- 5.4.5. Intestinal Failure
- 5.4.6. Others
- 5.5. Market Analysis, Insights and Forecast - by Age Group
- 5.5.1. Adult
- 5.5.2. Pediatric
- 5.5.3. Neonatal
- 5.6. Market Analysis, Insights and Forecast - by Region
- 5.6.1. North America
- 5.6.2. South America
- 5.6.3. Europe
- 5.6.4. Middle East & Africa
- 5.6.5. Asia Pacific
- 5.1. Market Analysis, Insights and Forecast - by Product Type
- 6. Global parenteral nutrition Analysis, Insights and Forecast, 2021-2033
- 6.1. Market Analysis, Insights and Forecast - by Product Type
- 6.1.1. Ready-to-Use (RTU) PN Bags
- 6.1.2. Compounded Parenteral Nutrition (PN)
- 6.2. Market Analysis, Insights and Forecast - by Care Setting
- 6.2.1. Hospital/Clinical PN
- 6.2.2. Home Parenteral Nutrition
- 6.3. Market Analysis, Insights and Forecast - by Nutrient Type
- 6.3.1. Macronutrients
- 6.3.1.1. Amino Acids
- 6.3.1.2. Lipids
- 6.3.1.3. Carbohydrates
- 6.3.2. Micronutrients
- 6.3.2.1. Vitamins
- 6.3.2.2. Trace Elements
- 6.3.2.3. Electrolytes
- 6.3.1. Macronutrients
- 6.4. Market Analysis, Insights and Forecast - by Therapeutic Indication
- 6.4.1. Short Bowel Syndrome
- 6.4.2. Cancer-Related Malnutrition
- 6.4.3. Gastrointestinal Disorders
- 6.4.4. Crohn's Disease
- 6.4.5. Intestinal Failure
- 6.4.6. Others
- 6.5. Market Analysis, Insights and Forecast - by Age Group
- 6.5.1. Adult
- 6.5.2. Pediatric
- 6.5.3. Neonatal
- 6.1. Market Analysis, Insights and Forecast - by Product Type
- 7. North America parenteral nutrition Analysis, Insights and Forecast, 2020-2032
- 7.1. Market Analysis, Insights and Forecast - by Product Type
- 7.1.1. Ready-to-Use (RTU) PN Bags
- 7.1.2. Compounded Parenteral Nutrition (PN)
- 7.2. Market Analysis, Insights and Forecast - by Care Setting
- 7.2.1. Hospital/Clinical PN
- 7.2.2. Home Parenteral Nutrition
- 7.3. Market Analysis, Insights and Forecast - by Nutrient Type
- 7.3.1. Macronutrients
- 7.3.1.1. Amino Acids
- 7.3.1.2. Lipids
- 7.3.1.3. Carbohydrates
- 7.3.2. Micronutrients
- 7.3.2.1. Vitamins
- 7.3.2.2. Trace Elements
- 7.3.2.3. Electrolytes
- 7.3.1. Macronutrients
- 7.4. Market Analysis, Insights and Forecast - by Therapeutic Indication
- 7.4.1. Short Bowel Syndrome
- 7.4.2. Cancer-Related Malnutrition
- 7.4.3. Gastrointestinal Disorders
- 7.4.4. Crohn's Disease
- 7.4.5. Intestinal Failure
- 7.4.6. Others
- 7.5. Market Analysis, Insights and Forecast - by Age Group
- 7.5.1. Adult
- 7.5.2. Pediatric
- 7.5.3. Neonatal
- 7.1. Market Analysis, Insights and Forecast - by Product Type
- 8. South America parenteral nutrition Analysis, Insights and Forecast, 2020-2032
- 8.1. Market Analysis, Insights and Forecast - by Product Type
- 8.1.1. Ready-to-Use (RTU) PN Bags
- 8.1.2. Compounded Parenteral Nutrition (PN)
- 8.2. Market Analysis, Insights and Forecast - by Care Setting
- 8.2.1. Hospital/Clinical PN
- 8.2.2. Home Parenteral Nutrition
- 8.3. Market Analysis, Insights and Forecast - by Nutrient Type
- 8.3.1. Macronutrients
- 8.3.1.1. Amino Acids
- 8.3.1.2. Lipids
- 8.3.1.3. Carbohydrates
- 8.3.2. Micronutrients
- 8.3.2.1. Vitamins
- 8.3.2.2. Trace Elements
- 8.3.2.3. Electrolytes
- 8.3.1. Macronutrients
- 8.4. Market Analysis, Insights and Forecast - by Therapeutic Indication
- 8.4.1. Short Bowel Syndrome
- 8.4.2. Cancer-Related Malnutrition
- 8.4.3. Gastrointestinal Disorders
- 8.4.4. Crohn's Disease
- 8.4.5. Intestinal Failure
- 8.4.6. Others
- 8.5. Market Analysis, Insights and Forecast - by Age Group
- 8.5.1. Adult
- 8.5.2. Pediatric
- 8.5.3. Neonatal
- 8.1. Market Analysis, Insights and Forecast - by Product Type
- 9. Europe parenteral nutrition Analysis, Insights and Forecast, 2020-2032
- 9.1. Market Analysis, Insights and Forecast - by Product Type
- 9.1.1. Ready-to-Use (RTU) PN Bags
- 9.1.2. Compounded Parenteral Nutrition (PN)
- 9.2. Market Analysis, Insights and Forecast - by Care Setting
- 9.2.1. Hospital/Clinical PN
- 9.2.2. Home Parenteral Nutrition
- 9.3. Market Analysis, Insights and Forecast - by Nutrient Type
- 9.3.1. Macronutrients
- 9.3.1.1. Amino Acids
- 9.3.1.2. Lipids
- 9.3.1.3. Carbohydrates
- 9.3.2. Micronutrients
- 9.3.2.1. Vitamins
- 9.3.2.2. Trace Elements
- 9.3.2.3. Electrolytes
- 9.3.1. Macronutrients
- 9.4. Market Analysis, Insights and Forecast - by Therapeutic Indication
- 9.4.1. Short Bowel Syndrome
- 9.4.2. Cancer-Related Malnutrition
- 9.4.3. Gastrointestinal Disorders
- 9.4.4. Crohn's Disease
- 9.4.5. Intestinal Failure
- 9.4.6. Others
- 9.5. Market Analysis, Insights and Forecast - by Age Group
- 9.5.1. Adult
- 9.5.2. Pediatric
- 9.5.3. Neonatal
- 9.1. Market Analysis, Insights and Forecast - by Product Type
- 10. Middle East & Africa parenteral nutrition Analysis, Insights and Forecast, 2020-2032
- 10.1. Market Analysis, Insights and Forecast - by Product Type
- 10.1.1. Ready-to-Use (RTU) PN Bags
- 10.1.2. Compounded Parenteral Nutrition (PN)
- 10.2. Market Analysis, Insights and Forecast - by Care Setting
- 10.2.1. Hospital/Clinical PN
- 10.2.2. Home Parenteral Nutrition
- 10.3. Market Analysis, Insights and Forecast - by Nutrient Type
- 10.3.1. Macronutrients
- 10.3.1.1. Amino Acids
- 10.3.1.2. Lipids
- 10.3.1.3. Carbohydrates
- 10.3.2. Micronutrients
- 10.3.2.1. Vitamins
- 10.3.2.2. Trace Elements
- 10.3.2.3. Electrolytes
- 10.3.1. Macronutrients
- 10.4. Market Analysis, Insights and Forecast - by Therapeutic Indication
- 10.4.1. Short Bowel Syndrome
- 10.4.2. Cancer-Related Malnutrition
- 10.4.3. Gastrointestinal Disorders
- 10.4.4. Crohn's Disease
- 10.4.5. Intestinal Failure
- 10.4.6. Others
- 10.5. Market Analysis, Insights and Forecast - by Age Group
- 10.5.1. Adult
- 10.5.2. Pediatric
- 10.5.3. Neonatal
- 10.1. Market Analysis, Insights and Forecast - by Product Type
- 11. Asia Pacific parenteral nutrition Analysis, Insights and Forecast, 2020-2032
- 11.1. Market Analysis, Insights and Forecast - by Product Type
- 11.1.1. Ready-to-Use (RTU) PN Bags
- 11.1.2. Compounded Parenteral Nutrition (PN)
- 11.2. Market Analysis, Insights and Forecast - by Care Setting
- 11.2.1. Hospital/Clinical PN
- 11.2.2. Home Parenteral Nutrition
- 11.3. Market Analysis, Insights and Forecast - by Nutrient Type
- 11.3.1. Macronutrients
- 11.3.1.1. Amino Acids
- 11.3.1.2. Lipids
- 11.3.1.3. Carbohydrates
- 11.3.2. Micronutrients
- 11.3.2.1. Vitamins
- 11.3.2.2. Trace Elements
- 11.3.2.3. Electrolytes
- 11.3.1. Macronutrients
- 11.4. Market Analysis, Insights and Forecast - by Therapeutic Indication
- 11.4.1. Short Bowel Syndrome
- 11.4.2. Cancer-Related Malnutrition
- 11.4.3. Gastrointestinal Disorders
- 11.4.4. Crohn's Disease
- 11.4.5. Intestinal Failure
- 11.4.6. Others
- 11.5. Market Analysis, Insights and Forecast - by Age Group
- 11.5.1. Adult
- 11.5.2. Pediatric
- 11.5.3. Neonatal
- 11.1. Market Analysis, Insights and Forecast - by Product Type
- 12. Competitive Analysis
- 12.1. Company Profiles
- 12.1.1 Baxter
- 12.1.1.1. Company Overview
- 12.1.1.2. Products
- 12.1.1.3. Company Financials
- 12.1.1.4. SWOT Analysis
- 12.1.2 B. Braun
- 12.1.2.1. Company Overview
- 12.1.2.2. Products
- 12.1.2.3. Company Financials
- 12.1.2.4. SWOT Analysis
- 12.1.3 Fresenius Kabi
- 12.1.3.1. Company Overview
- 12.1.3.2. Products
- 12.1.3.3. Company Financials
- 12.1.3.4. SWOT Analysis
- 12.1.4 Kelun Pharma
- 12.1.4.1. Company Overview
- 12.1.4.2. Products
- 12.1.4.3. Company Financials
- 12.1.4.4. SWOT Analysis
- 12.1.5 Otsuka Pharmaceutical
- 12.1.5.1. Company Overview
- 12.1.5.2. Products
- 12.1.5.3. Company Financials
- 12.1.5.4. SWOT Analysis
- 12.1.6 JW Pharmaceutical
- 12.1.6.1. Company Overview
- 12.1.6.2. Products
- 12.1.6.3. Company Financials
- 12.1.6.4. SWOT Analysis
- 12.1.7 Grifols
- 12.1.7.1. Company Overview
- 12.1.7.2. Products
- 12.1.7.3. Company Financials
- 12.1.7.4. SWOT Analysis
- 12.1.8 Haisco Pharmaceutical Group
- 12.1.8.1. Company Overview
- 12.1.8.2. Products
- 12.1.8.3. Company Financials
- 12.1.8.4. SWOT Analysis
- 12.1.9 King York
- 12.1.9.1. Company Overview
- 12.1.9.2. Products
- 12.1.9.3. Company Financials
- 12.1.9.4. SWOT Analysis
- 12.1.10 Cisen
- 12.1.10.1. Company Overview
- 12.1.10.2. Products
- 12.1.10.3. Company Financials
- 12.1.10.4. SWOT Analysis
- 12.1.11 BBCA Pharmaceutical
- 12.1.11.1. Company Overview
- 12.1.11.2. Products
- 12.1.11.3. Company Financials
- 12.1.11.4. SWOT Analysis
- 12.1.12 Biokin Pharmaceutical
- 12.1.12.1. Company Overview
- 12.1.12.2. Products
- 12.1.12.3. Company Financials
- 12.1.12.4. SWOT Analysis
- 12.1.13 Xi'an Libang Pharmaceutical
- 12.1.13.1. Company Overview
- 12.1.13.2. Products
- 12.1.13.3. Company Financials
- 12.1.13.4. SWOT Analysis
- 12.1.14 Lionco Pharmaceutical
- 12.1.14.1. Company Overview
- 12.1.14.2. Products
- 12.1.14.3. Company Financials
- 12.1.14.4. SWOT Analysis
- 12.1.15 Grand Life Sciences
- 12.1.15.1. Company Overview
- 12.1.15.2. Products
- 12.1.15.3. Company Financials
- 12.1.15.4. SWOT Analysis
- 12.1.16 Lummy
- 12.1.16.1. Company Overview
- 12.1.16.2. Products
- 12.1.16.3. Company Financials
- 12.1.16.4. SWOT Analysis
- 12.1.17 BBCA Pharmaceutical
- 12.1.17.1. Company Overview
- 12.1.17.2. Products
- 12.1.17.3. Company Financials
- 12.1.17.4. SWOT Analysis
- 12.1.18 China Meheco Kangli
- 12.1.18.1. Company Overview
- 12.1.18.2. Products
- 12.1.18.3. Company Financials
- 12.1.18.4. SWOT Analysis
- 12.1.19 Weixinkang
- 12.1.19.1. Company Overview
- 12.1.19.2. Products
- 12.1.19.3. Company Financials
- 12.1.19.4. SWOT Analysis
- 12.1.20 Baizheng Pharmaceutical
- 12.1.20.1. Company Overview
- 12.1.20.2. Products
- 12.1.20.3. Company Financials
- 12.1.20.4. SWOT Analysis
- 12.1.21 Aguettant
- 12.1.21.1. Company Overview
- 12.1.21.2. Products
- 12.1.21.3. Company Financials
- 12.1.21.4. SWOT Analysis
- 12.1.1 Baxter
- 12.2. Market Entropy
- 12.2.1 Company's Key Areas Served
- 12.2.2 Recent Developments
- 12.3. Company Market Share Analysis 2025
- 12.3.1 Top 5 Companies Market Share Analysis
- 12.3.2 Top 3 Companies Market Share Analysis
- 12.4. List of Potential Customers
- 13. Research Methodology
List of Figures
- Figure 1: Global parenteral nutrition Revenue Breakdown (billion, %) by Region 2025 & 2033
- Figure 2: Global parenteral nutrition Volume Breakdown (K, %) by Region 2025 & 2033
- Figure 3: North America parenteral nutrition Revenue (billion), by Product Type 2025 & 2033
- Figure 4: North America parenteral nutrition Volume (K), by Product Type 2025 & 2033
- Figure 5: North America parenteral nutrition Revenue Share (%), by Product Type 2025 & 2033
- Figure 6: North America parenteral nutrition Volume Share (%), by Product Type 2025 & 2033
- Figure 7: North America parenteral nutrition Revenue (billion), by Care Setting 2025 & 2033
- Figure 8: North America parenteral nutrition Volume (K), by Care Setting 2025 & 2033
- Figure 9: North America parenteral nutrition Revenue Share (%), by Care Setting 2025 & 2033
- Figure 10: North America parenteral nutrition Volume Share (%), by Care Setting 2025 & 2033
- Figure 11: North America parenteral nutrition Revenue (billion), by Nutrient Type 2025 & 2033
- Figure 12: North America parenteral nutrition Volume (K), by Nutrient Type 2025 & 2033
- Figure 13: North America parenteral nutrition Revenue Share (%), by Nutrient Type 2025 & 2033
- Figure 14: North America parenteral nutrition Volume Share (%), by Nutrient Type 2025 & 2033
- Figure 15: North America parenteral nutrition Revenue (billion), by Therapeutic Indication 2025 & 2033
- Figure 16: North America parenteral nutrition Volume (K), by Therapeutic Indication 2025 & 2033
- Figure 17: North America parenteral nutrition Revenue Share (%), by Therapeutic Indication 2025 & 2033
- Figure 18: North America parenteral nutrition Volume Share (%), by Therapeutic Indication 2025 & 2033
- Figure 19: North America parenteral nutrition Revenue (billion), by Age Group 2025 & 2033
- Figure 20: North America parenteral nutrition Volume (K), by Age Group 2025 & 2033
- Figure 21: North America parenteral nutrition Revenue Share (%), by Age Group 2025 & 2033
- Figure 22: North America parenteral nutrition Volume Share (%), by Age Group 2025 & 2033
- Figure 23: North America parenteral nutrition Revenue (billion), by Country 2025 & 2033
- Figure 24: North America parenteral nutrition Volume (K), by Country 2025 & 2033
- Figure 25: North America parenteral nutrition Revenue Share (%), by Country 2025 & 2033
- Figure 26: North America parenteral nutrition Volume Share (%), by Country 2025 & 2033
- Figure 27: South America parenteral nutrition Revenue (billion), by Product Type 2025 & 2033
- Figure 28: South America parenteral nutrition Volume (K), by Product Type 2025 & 2033
- Figure 29: South America parenteral nutrition Revenue Share (%), by Product Type 2025 & 2033
- Figure 30: South America parenteral nutrition Volume Share (%), by Product Type 2025 & 2033
- Figure 31: South America parenteral nutrition Revenue (billion), by Care Setting 2025 & 2033
- Figure 32: South America parenteral nutrition Volume (K), by Care Setting 2025 & 2033
- Figure 33: South America parenteral nutrition Revenue Share (%), by Care Setting 2025 & 2033
- Figure 34: South America parenteral nutrition Volume Share (%), by Care Setting 2025 & 2033
- Figure 35: South America parenteral nutrition Revenue (billion), by Nutrient Type 2025 & 2033
- Figure 36: South America parenteral nutrition Volume (K), by Nutrient Type 2025 & 2033
- Figure 37: South America parenteral nutrition Revenue Share (%), by Nutrient Type 2025 & 2033
- Figure 38: South America parenteral nutrition Volume Share (%), by Nutrient Type 2025 & 2033
- Figure 39: South America parenteral nutrition Revenue (billion), by Therapeutic Indication 2025 & 2033
- Figure 40: South America parenteral nutrition Volume (K), by Therapeutic Indication 2025 & 2033
- Figure 41: South America parenteral nutrition Revenue Share (%), by Therapeutic Indication 2025 & 2033
- Figure 42: South America parenteral nutrition Volume Share (%), by Therapeutic Indication 2025 & 2033
- Figure 43: South America parenteral nutrition Revenue (billion), by Age Group 2025 & 2033
- Figure 44: South America parenteral nutrition Volume (K), by Age Group 2025 & 2033
- Figure 45: South America parenteral nutrition Revenue Share (%), by Age Group 2025 & 2033
- Figure 46: South America parenteral nutrition Volume Share (%), by Age Group 2025 & 2033
- Figure 47: South America parenteral nutrition Revenue (billion), by Country 2025 & 2033
- Figure 48: South America parenteral nutrition Volume (K), by Country 2025 & 2033
- Figure 49: South America parenteral nutrition Revenue Share (%), by Country 2025 & 2033
- Figure 50: South America parenteral nutrition Volume Share (%), by Country 2025 & 2033
- Figure 51: Europe parenteral nutrition Revenue (billion), by Product Type 2025 & 2033
- Figure 52: Europe parenteral nutrition Volume (K), by Product Type 2025 & 2033
- Figure 53: Europe parenteral nutrition Revenue Share (%), by Product Type 2025 & 2033
- Figure 54: Europe parenteral nutrition Volume Share (%), by Product Type 2025 & 2033
- Figure 55: Europe parenteral nutrition Revenue (billion), by Care Setting 2025 & 2033
- Figure 56: Europe parenteral nutrition Volume (K), by Care Setting 2025 & 2033
- Figure 57: Europe parenteral nutrition Revenue Share (%), by Care Setting 2025 & 2033
- Figure 58: Europe parenteral nutrition Volume Share (%), by Care Setting 2025 & 2033
- Figure 59: Europe parenteral nutrition Revenue (billion), by Nutrient Type 2025 & 2033
- Figure 60: Europe parenteral nutrition Volume (K), by Nutrient Type 2025 & 2033
- Figure 61: Europe parenteral nutrition Revenue Share (%), by Nutrient Type 2025 & 2033
- Figure 62: Europe parenteral nutrition Volume Share (%), by Nutrient Type 2025 & 2033
- Figure 63: Europe parenteral nutrition Revenue (billion), by Therapeutic Indication 2025 & 2033
- Figure 64: Europe parenteral nutrition Volume (K), by Therapeutic Indication 2025 & 2033
- Figure 65: Europe parenteral nutrition Revenue Share (%), by Therapeutic Indication 2025 & 2033
- Figure 66: Europe parenteral nutrition Volume Share (%), by Therapeutic Indication 2025 & 2033
- Figure 67: Europe parenteral nutrition Revenue (billion), by Age Group 2025 & 2033
- Figure 68: Europe parenteral nutrition Volume (K), by Age Group 2025 & 2033
- Figure 69: Europe parenteral nutrition Revenue Share (%), by Age Group 2025 & 2033
- Figure 70: Europe parenteral nutrition Volume Share (%), by Age Group 2025 & 2033
- Figure 71: Europe parenteral nutrition Revenue (billion), by Country 2025 & 2033
- Figure 72: Europe parenteral nutrition Volume (K), by Country 2025 & 2033
- Figure 73: Europe parenteral nutrition Revenue Share (%), by Country 2025 & 2033
- Figure 74: Europe parenteral nutrition Volume Share (%), by Country 2025 & 2033
- Figure 75: Middle East & Africa parenteral nutrition Revenue (billion), by Product Type 2025 & 2033
- Figure 76: Middle East & Africa parenteral nutrition Volume (K), by Product Type 2025 & 2033
- Figure 77: Middle East & Africa parenteral nutrition Revenue Share (%), by Product Type 2025 & 2033
- Figure 78: Middle East & Africa parenteral nutrition Volume Share (%), by Product Type 2025 & 2033
- Figure 79: Middle East & Africa parenteral nutrition Revenue (billion), by Care Setting 2025 & 2033
- Figure 80: Middle East & Africa parenteral nutrition Volume (K), by Care Setting 2025 & 2033
- Figure 81: Middle East & Africa parenteral nutrition Revenue Share (%), by Care Setting 2025 & 2033
- Figure 82: Middle East & Africa parenteral nutrition Volume Share (%), by Care Setting 2025 & 2033
- Figure 83: Middle East & Africa parenteral nutrition Revenue (billion), by Nutrient Type 2025 & 2033
- Figure 84: Middle East & Africa parenteral nutrition Volume (K), by Nutrient Type 2025 & 2033
- Figure 85: Middle East & Africa parenteral nutrition Revenue Share (%), by Nutrient Type 2025 & 2033
- Figure 86: Middle East & Africa parenteral nutrition Volume Share (%), by Nutrient Type 2025 & 2033
- Figure 87: Middle East & Africa parenteral nutrition Revenue (billion), by Therapeutic Indication 2025 & 2033
- Figure 88: Middle East & Africa parenteral nutrition Volume (K), by Therapeutic Indication 2025 & 2033
- Figure 89: Middle East & Africa parenteral nutrition Revenue Share (%), by Therapeutic Indication 2025 & 2033
- Figure 90: Middle East & Africa parenteral nutrition Volume Share (%), by Therapeutic Indication 2025 & 2033
- Figure 91: Middle East & Africa parenteral nutrition Revenue (billion), by Age Group 2025 & 2033
- Figure 92: Middle East & Africa parenteral nutrition Volume (K), by Age Group 2025 & 2033
- Figure 93: Middle East & Africa parenteral nutrition Revenue Share (%), by Age Group 2025 & 2033
- Figure 94: Middle East & Africa parenteral nutrition Volume Share (%), by Age Group 2025 & 2033
- Figure 95: Middle East & Africa parenteral nutrition Revenue (billion), by Country 2025 & 2033
- Figure 96: Middle East & Africa parenteral nutrition Volume (K), by Country 2025 & 2033
- Figure 97: Middle East & Africa parenteral nutrition Revenue Share (%), by Country 2025 & 2033
- Figure 98: Middle East & Africa parenteral nutrition Volume Share (%), by Country 2025 & 2033
- Figure 99: Asia Pacific parenteral nutrition Revenue (billion), by Product Type 2025 & 2033
- Figure 100: Asia Pacific parenteral nutrition Volume (K), by Product Type 2025 & 2033
- Figure 101: Asia Pacific parenteral nutrition Revenue Share (%), by Product Type 2025 & 2033
- Figure 102: Asia Pacific parenteral nutrition Volume Share (%), by Product Type 2025 & 2033
- Figure 103: Asia Pacific parenteral nutrition Revenue (billion), by Care Setting 2025 & 2033
- Figure 104: Asia Pacific parenteral nutrition Volume (K), by Care Setting 2025 & 2033
- Figure 105: Asia Pacific parenteral nutrition Revenue Share (%), by Care Setting 2025 & 2033
- Figure 106: Asia Pacific parenteral nutrition Volume Share (%), by Care Setting 2025 & 2033
- Figure 107: Asia Pacific parenteral nutrition Revenue (billion), by Nutrient Type 2025 & 2033
- Figure 108: Asia Pacific parenteral nutrition Volume (K), by Nutrient Type 2025 & 2033
- Figure 109: Asia Pacific parenteral nutrition Revenue Share (%), by Nutrient Type 2025 & 2033
- Figure 110: Asia Pacific parenteral nutrition Volume Share (%), by Nutrient Type 2025 & 2033
- Figure 111: Asia Pacific parenteral nutrition Revenue (billion), by Therapeutic Indication 2025 & 2033
- Figure 112: Asia Pacific parenteral nutrition Volume (K), by Therapeutic Indication 2025 & 2033
- Figure 113: Asia Pacific parenteral nutrition Revenue Share (%), by Therapeutic Indication 2025 & 2033
- Figure 114: Asia Pacific parenteral nutrition Volume Share (%), by Therapeutic Indication 2025 & 2033
- Figure 115: Asia Pacific parenteral nutrition Revenue (billion), by Age Group 2025 & 2033
- Figure 116: Asia Pacific parenteral nutrition Volume (K), by Age Group 2025 & 2033
- Figure 117: Asia Pacific parenteral nutrition Revenue Share (%), by Age Group 2025 & 2033
- Figure 118: Asia Pacific parenteral nutrition Volume Share (%), by Age Group 2025 & 2033
- Figure 119: Asia Pacific parenteral nutrition Revenue (billion), by Country 2025 & 2033
- Figure 120: Asia Pacific parenteral nutrition Volume (K), by Country 2025 & 2033
- Figure 121: Asia Pacific parenteral nutrition Revenue Share (%), by Country 2025 & 2033
- Figure 122: Asia Pacific parenteral nutrition Volume Share (%), by Country 2025 & 2033
List of Tables
- Table 1: Global parenteral nutrition Revenue billion Forecast, by Product Type 2020 & 2033
- Table 2: Global parenteral nutrition Volume K Forecast, by Product Type 2020 & 2033
- Table 3: Global parenteral nutrition Revenue billion Forecast, by Care Setting 2020 & 2033
- Table 4: Global parenteral nutrition Volume K Forecast, by Care Setting 2020 & 2033
- Table 5: Global parenteral nutrition Revenue billion Forecast, by Nutrient Type 2020 & 2033
- Table 6: Global parenteral nutrition Volume K Forecast, by Nutrient Type 2020 & 2033
- Table 7: Global parenteral nutrition Revenue billion Forecast, by Therapeutic Indication 2020 & 2033
- Table 8: Global parenteral nutrition Volume K Forecast, by Therapeutic Indication 2020 & 2033
- Table 9: Global parenteral nutrition Revenue billion Forecast, by Age Group 2020 & 2033
- Table 10: Global parenteral nutrition Volume K Forecast, by Age Group 2020 & 2033
- Table 11: Global parenteral nutrition Revenue billion Forecast, by Region 2020 & 2033
- Table 12: Global parenteral nutrition Volume K Forecast, by Region 2020 & 2033
- Table 13: Global parenteral nutrition Revenue billion Forecast, by Product Type 2020 & 2033
- Table 14: Global parenteral nutrition Volume K Forecast, by Product Type 2020 & 2033
- Table 15: Global parenteral nutrition Revenue billion Forecast, by Care Setting 2020 & 2033
- Table 16: Global parenteral nutrition Volume K Forecast, by Care Setting 2020 & 2033
- Table 17: Global parenteral nutrition Revenue billion Forecast, by Nutrient Type 2020 & 2033
- Table 18: Global parenteral nutrition Volume K Forecast, by Nutrient Type 2020 & 2033
- Table 19: Global parenteral nutrition Revenue billion Forecast, by Therapeutic Indication 2020 & 2033
- Table 20: Global parenteral nutrition Volume K Forecast, by Therapeutic Indication 2020 & 2033
- Table 21: Global parenteral nutrition Revenue billion Forecast, by Age Group 2020 & 2033
- Table 22: Global parenteral nutrition Volume K Forecast, by Age Group 2020 & 2033
- Table 23: Global parenteral nutrition Revenue billion Forecast, by Country 2020 & 2033
- Table 24: Global parenteral nutrition Volume K Forecast, by Country 2020 & 2033
- Table 25: United States parenteral nutrition Revenue (billion) Forecast, by Application 2020 & 2033
- Table 26: United States parenteral nutrition Volume (K) Forecast, by Application 2020 & 2033
- Table 27: Canada parenteral nutrition Revenue (billion) Forecast, by Application 2020 & 2033
- Table 28: Canada parenteral nutrition Volume (K) Forecast, by Application 2020 & 2033
- Table 29: Mexico parenteral nutrition Revenue (billion) Forecast, by Application 2020 & 2033
- Table 30: Mexico parenteral nutrition Volume (K) Forecast, by Application 2020 & 2033
- Table 31: Global parenteral nutrition Revenue billion Forecast, by Product Type 2020 & 2033
- Table 32: Global parenteral nutrition Volume K Forecast, by Product Type 2020 & 2033
- Table 33: Global parenteral nutrition Revenue billion Forecast, by Care Setting 2020 & 2033
- Table 34: Global parenteral nutrition Volume K Forecast, by Care Setting 2020 & 2033
- Table 35: Global parenteral nutrition Revenue billion Forecast, by Nutrient Type 2020 & 2033
- Table 36: Global parenteral nutrition Volume K Forecast, by Nutrient Type 2020 & 2033
- Table 37: Global parenteral nutrition Revenue billion Forecast, by Therapeutic Indication 2020 & 2033
- Table 38: Global parenteral nutrition Volume K Forecast, by Therapeutic Indication 2020 & 2033
- Table 39: Global parenteral nutrition Revenue billion Forecast, by Age Group 2020 & 2033
- Table 40: Global parenteral nutrition Volume K Forecast, by Age Group 2020 & 2033
- Table 41: Global parenteral nutrition Revenue billion Forecast, by Country 2020 & 2033
- Table 42: Global parenteral nutrition Volume K Forecast, by Country 2020 & 2033
- Table 43: Brazil parenteral nutrition Revenue (billion) Forecast, by Application 2020 & 2033
- Table 44: Brazil parenteral nutrition Volume (K) Forecast, by Application 2020 & 2033
- Table 45: Argentina parenteral nutrition Revenue (billion) Forecast, by Application 2020 & 2033
- Table 46: Argentina parenteral nutrition Volume (K) Forecast, by Application 2020 & 2033
- Table 47: Rest of South America parenteral nutrition Revenue (billion) Forecast, by Application 2020 & 2033
- Table 48: Rest of South America parenteral nutrition Volume (K) Forecast, by Application 2020 & 2033
- Table 49: Global parenteral nutrition Revenue billion Forecast, by Product Type 2020 & 2033
- Table 50: Global parenteral nutrition Volume K Forecast, by Product Type 2020 & 2033
- Table 51: Global parenteral nutrition Revenue billion Forecast, by Care Setting 2020 & 2033
- Table 52: Global parenteral nutrition Volume K Forecast, by Care Setting 2020 & 2033
- Table 53: Global parenteral nutrition Revenue billion Forecast, by Nutrient Type 2020 & 2033
- Table 54: Global parenteral nutrition Volume K Forecast, by Nutrient Type 2020 & 2033
- Table 55: Global parenteral nutrition Revenue billion Forecast, by Therapeutic Indication 2020 & 2033
- Table 56: Global parenteral nutrition Volume K Forecast, by Therapeutic Indication 2020 & 2033
- Table 57: Global parenteral nutrition Revenue billion Forecast, by Age Group 2020 & 2033
- Table 58: Global parenteral nutrition Volume K Forecast, by Age Group 2020 & 2033
- Table 59: Global parenteral nutrition Revenue billion Forecast, by Country 2020 & 2033
- Table 60: Global parenteral nutrition Volume K Forecast, by Country 2020 & 2033
- Table 61: United Kingdom parenteral nutrition Revenue (billion) Forecast, by Application 2020 & 2033
- Table 62: United Kingdom parenteral nutrition Volume (K) Forecast, by Application 2020 & 2033
- Table 63: Germany parenteral nutrition Revenue (billion) Forecast, by Application 2020 & 2033
- Table 64: Germany parenteral nutrition Volume (K) Forecast, by Application 2020 & 2033
- Table 65: France parenteral nutrition Revenue (billion) Forecast, by Application 2020 & 2033
- Table 66: France parenteral nutrition Volume (K) Forecast, by Application 2020 & 2033
- Table 67: Italy parenteral nutrition Revenue (billion) Forecast, by Application 2020 & 2033
- Table 68: Italy parenteral nutrition Volume (K) Forecast, by Application 2020 & 2033
- Table 69: Spain parenteral nutrition Revenue (billion) Forecast, by Application 2020 & 2033
- Table 70: Spain parenteral nutrition Volume (K) Forecast, by Application 2020 & 2033
- Table 71: Russia parenteral nutrition Revenue (billion) Forecast, by Application 2020 & 2033
- Table 72: Russia parenteral nutrition Volume (K) Forecast, by Application 2020 & 2033
- Table 73: Benelux parenteral nutrition Revenue (billion) Forecast, by Application 2020 & 2033
- Table 74: Benelux parenteral nutrition Volume (K) Forecast, by Application 2020 & 2033
- Table 75: Nordics parenteral nutrition Revenue (billion) Forecast, by Application 2020 & 2033
- Table 76: Nordics parenteral nutrition Volume (K) Forecast, by Application 2020 & 2033
- Table 77: Rest of Europe parenteral nutrition Revenue (billion) Forecast, by Application 2020 & 2033
- Table 78: Rest of Europe parenteral nutrition Volume (K) Forecast, by Application 2020 & 2033
- Table 79: Global parenteral nutrition Revenue billion Forecast, by Product Type 2020 & 2033
- Table 80: Global parenteral nutrition Volume K Forecast, by Product Type 2020 & 2033
- Table 81: Global parenteral nutrition Revenue billion Forecast, by Care Setting 2020 & 2033
- Table 82: Global parenteral nutrition Volume K Forecast, by Care Setting 2020 & 2033
- Table 83: Global parenteral nutrition Revenue billion Forecast, by Nutrient Type 2020 & 2033
- Table 84: Global parenteral nutrition Volume K Forecast, by Nutrient Type 2020 & 2033
- Table 85: Global parenteral nutrition Revenue billion Forecast, by Therapeutic Indication 2020 & 2033
- Table 86: Global parenteral nutrition Volume K Forecast, by Therapeutic Indication 2020 & 2033
- Table 87: Global parenteral nutrition Revenue billion Forecast, by Age Group 2020 & 2033
- Table 88: Global parenteral nutrition Volume K Forecast, by Age Group 2020 & 2033
- Table 89: Global parenteral nutrition Revenue billion Forecast, by Country 2020 & 2033
- Table 90: Global parenteral nutrition Volume K Forecast, by Country 2020 & 2033
- Table 91: Turkey parenteral nutrition Revenue (billion) Forecast, by Application 2020 & 2033
- Table 92: Turkey parenteral nutrition Volume (K) Forecast, by Application 2020 & 2033
- Table 93: Israel parenteral nutrition Revenue (billion) Forecast, by Application 2020 & 2033
- Table 94: Israel parenteral nutrition Volume (K) Forecast, by Application 2020 & 2033
- Table 95: GCC parenteral nutrition Revenue (billion) Forecast, by Application 2020 & 2033
- Table 96: GCC parenteral nutrition Volume (K) Forecast, by Application 2020 & 2033
- Table 97: North Africa parenteral nutrition Revenue (billion) Forecast, by Application 2020 & 2033
- Table 98: North Africa parenteral nutrition Volume (K) Forecast, by Application 2020 & 2033
- Table 99: South Africa parenteral nutrition Revenue (billion) Forecast, by Application 2020 & 2033
- Table 100: South Africa parenteral nutrition Volume (K) Forecast, by Application 2020 & 2033
- Table 101: Rest of Middle East & Africa parenteral nutrition Revenue (billion) Forecast, by Application 2020 & 2033
- Table 102: Rest of Middle East & Africa parenteral nutrition Volume (K) Forecast, by Application 2020 & 2033
- Table 103: Global parenteral nutrition Revenue billion Forecast, by Product Type 2020 & 2033
- Table 104: Global parenteral nutrition Volume K Forecast, by Product Type 2020 & 2033
- Table 105: Global parenteral nutrition Revenue billion Forecast, by Care Setting 2020 & 2033
- Table 106: Global parenteral nutrition Volume K Forecast, by Care Setting 2020 & 2033
- Table 107: Global parenteral nutrition Revenue billion Forecast, by Nutrient Type 2020 & 2033
- Table 108: Global parenteral nutrition Volume K Forecast, by Nutrient Type 2020 & 2033
- Table 109: Global parenteral nutrition Revenue billion Forecast, by Therapeutic Indication 2020 & 2033
- Table 110: Global parenteral nutrition Volume K Forecast, by Therapeutic Indication 2020 & 2033
- Table 111: Global parenteral nutrition Revenue billion Forecast, by Age Group 2020 & 2033
- Table 112: Global parenteral nutrition Volume K Forecast, by Age Group 2020 & 2033
- Table 113: Global parenteral nutrition Revenue billion Forecast, by Country 2020 & 2033
- Table 114: Global parenteral nutrition Volume K Forecast, by Country 2020 & 2033
- Table 115: China parenteral nutrition Revenue (billion) Forecast, by Application 2020 & 2033
- Table 116: China parenteral nutrition Volume (K) Forecast, by Application 2020 & 2033
- Table 117: India parenteral nutrition Revenue (billion) Forecast, by Application 2020 & 2033
- Table 118: India parenteral nutrition Volume (K) Forecast, by Application 2020 & 2033
- Table 119: Japan parenteral nutrition Revenue (billion) Forecast, by Application 2020 & 2033
- Table 120: Japan parenteral nutrition Volume (K) Forecast, by Application 2020 & 2033
- Table 121: South Korea parenteral nutrition Revenue (billion) Forecast, by Application 2020 & 2033
- Table 122: South Korea parenteral nutrition Volume (K) Forecast, by Application 2020 & 2033
- Table 123: ASEAN parenteral nutrition Revenue (billion) Forecast, by Application 2020 & 2033
- Table 124: ASEAN parenteral nutrition Volume (K) Forecast, by Application 2020 & 2033
- Table 125: Oceania parenteral nutrition Revenue (billion) Forecast, by Application 2020 & 2033
- Table 126: Oceania parenteral nutrition Volume (K) Forecast, by Application 2020 & 2033
- Table 127: Rest of Asia Pacific parenteral nutrition Revenue (billion) Forecast, by Application 2020 & 2033
- Table 128: Rest of Asia Pacific parenteral nutrition Volume (K) Forecast, by Application 2020 & 2033
Frequently Asked Questions
1. What is the projected Compound Annual Growth Rate (CAGR) of the parenteral nutrition?
The projected CAGR is approximately 5.9%.
2. Which companies are prominent players in the parenteral nutrition?
Key companies in the market include Baxter, B. Braun, Fresenius Kabi, Kelun Pharma, Otsuka Pharmaceutical, JW Pharmaceutical, Grifols, Haisco Pharmaceutical Group, King York, Cisen, BBCA Pharmaceutical, Biokin Pharmaceutical, Xi'an Libang Pharmaceutical, Lionco Pharmaceutical, Grand Life Sciences, Lummy, BBCA Pharmaceutical, China Meheco Kangli, Weixinkang, Baizheng Pharmaceutical, Aguettant.
3. What are the main segments of the parenteral nutrition?
The market segments include Product Type, Care Setting, Nutrient Type, Therapeutic Indication, Age Group.
4. Can you provide details about the market size?
The market size is estimated to be USD 7.94 billion as of 2022.
5. What are some drivers contributing to market growth?
N/A
6. What are the notable trends driving market growth?
N/A
7. Are there any restraints impacting market growth?
N/A
8. Can you provide examples of recent developments in the market?
N/A
9. What pricing options are available for accessing the report?
Pricing options include single-user, multi-user, and enterprise licenses priced at USD 4350.00, USD 6525.00, and USD 8700.00 respectively.
10. Is the market size provided in terms of value or volume?
The market size is provided in terms of value, measured in billion and volume, measured in K.
11. Are there any specific market keywords associated with the report?
Yes, the market keyword associated with the report is "parenteral nutrition," which aids in identifying and referencing the specific market segment covered.
12. How do I determine which pricing option suits my needs best?
The pricing options vary based on user requirements and access needs. Individual users may opt for single-user licenses, while businesses requiring broader access may choose multi-user or enterprise licenses for cost-effective access to the report.
13. Are there any additional resources or data provided in the parenteral nutrition report?
While the report offers comprehensive insights, it's advisable to review the specific contents or supplementary materials provided to ascertain if additional resources or data are available.
14. How can I stay updated on further developments or reports in the parenteral nutrition?
To stay informed about further developments, trends, and reports in the parenteral nutrition, consider subscribing to industry newsletters, following relevant companies and organizations, or regularly checking reputable industry news sources and publications.
Methodology
Step 1 - Identification of Relevant Samples Size from Population Database


Step 2 - Approaches for Defining Global Market Size (Value, Volume* & Price*)

Note*: In applicable scenarios
Step 3 - Data Sources
Primary Research
- Web Analytics
- Survey Reports
- Research Institute
- Latest Research Reports
- Opinion Leaders
Secondary Research
- Annual Reports
- White Paper
- Latest Press Release
- Industry Association
- Paid Database
- Investor Presentations

Step 4 - Data Triangulation
Involves using different sources of information in order to increase the validity of a study
These sources are likely to be stakeholders in a program - participants, other researchers, program staff, other community members, and so on.
Then we put all data in single framework & apply various statistical tools to find out the dynamic on the market.
During the analysis stage, feedback from the stakeholder groups would be compared to determine areas of agreement as well as areas of divergence