

Key Insights
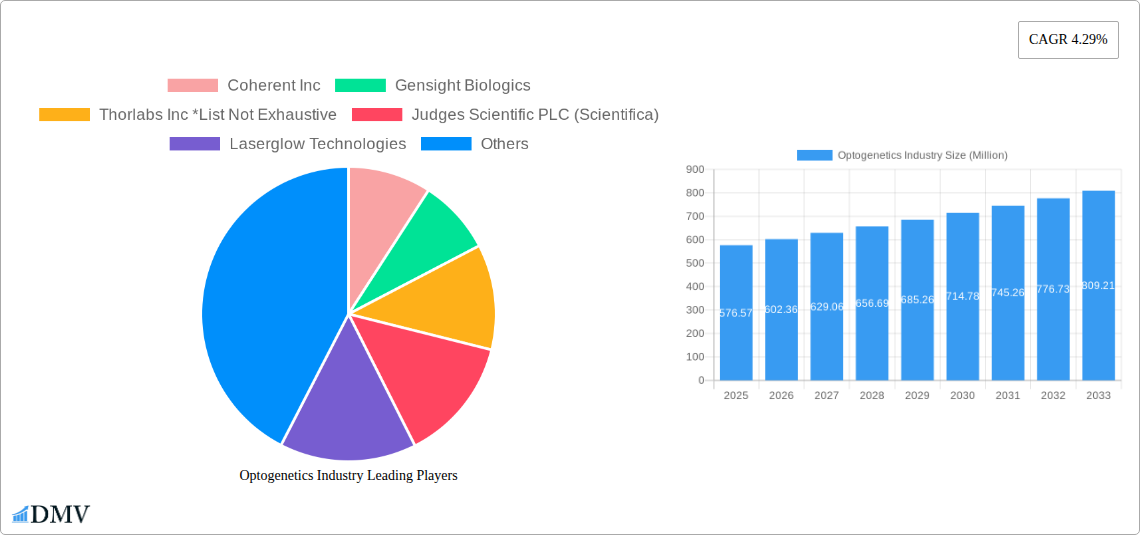
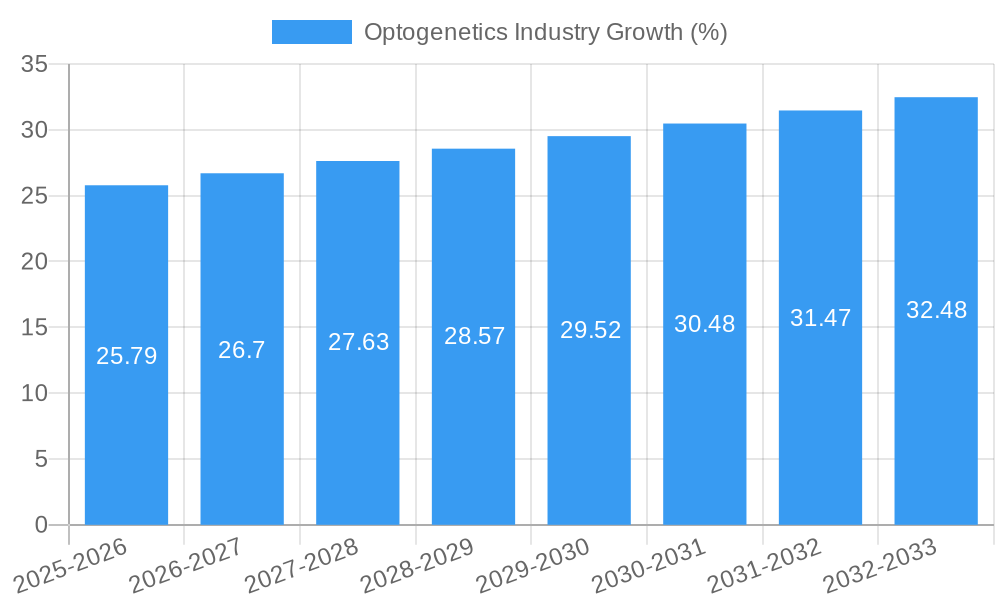
The optogenetics market, valued at $576.57 million in 2025, is projected to experience robust growth, driven by advancements in neuroscience research, increasing prevalence of retinal diseases, and the development of sophisticated light-delivery and stimulation systems. The Compound Annual Growth Rate (CAGR) of 4.29% from 2025 to 2033 indicates a steady expansion, propelled by the rising adoption of optogenetics in diverse applications beyond basic research. Key segments within the market include laser-based light equipment, channelrhodopsin actuators, calcium sensors, and applications in neuroscience and behavioral tracking. The North American market currently holds a significant share, largely due to robust research funding and the presence of major industry players. However, Asia Pacific is expected to exhibit significant growth over the forecast period driven by increasing investments in R&D and a growing healthcare sector. Technological advancements, like the development of more efficient and targeted light sources and improved genetic tools, are further fueling market expansion. While challenges remain, including the cost of equipment and the complexity of experimental procedures, the potential for transformative advancements in understanding and treating neurological and ophthalmological disorders will continue to drive market growth.
The competitive landscape is characterized by a mix of established players like Coherent Inc., Thorlabs Inc., and Bruker Corporation, alongside specialized companies focusing on optogenetics technologies. Strategic collaborations and technological innovations are expected to reshape the competitive landscape in the coming years. The market segmentation by light equipment, actuator, sensor, and application allows for a granular understanding of growth drivers within each niche. The continued development of minimally invasive techniques and improved targeting capabilities will broaden the clinical applications of optogenetics, leading to substantial market expansion in the therapeutic sector. The ongoing research and development efforts toward improving the efficiency and safety of optogenetic techniques will solidify its position as a pivotal tool in biomedical research and clinical treatments.
Optogenetics Industry Market Report: 2019-2033
This comprehensive report provides a detailed analysis of the Optogenetics industry, projecting a market value of $XX Million by 2033. The study period covers 2019-2033, with 2025 as the base and estimated year. This in-depth analysis encompasses market segmentation, key players, technological advancements, and future growth opportunities. It's an indispensable resource for stakeholders seeking to understand and capitalize on this rapidly evolving field.
Optogenetics Industry Market Composition & Trends
The global optogenetics market is experiencing significant growth, driven by advancements in neuroscience research and the development of novel therapeutic applications. Market concentration is currently moderate, with several key players holding substantial market share, but a fragmented landscape of smaller companies also contributing to innovation. The market is characterized by continuous technological advancements, with a focus on improved light sources, actuators, and sensors. Stringent regulatory landscapes in certain regions present challenges, but increasing regulatory approvals for therapeutic applications are driving growth. Substitute products are limited, solidifying optogenetics' unique position in the research and treatment landscape. End-users primarily consist of research institutions, pharmaceutical companies, and healthcare providers. M&A activity in the optogenetics industry remains relatively modest but is expected to increase as the market matures.
- Market Share Distribution (2024 Estimate): Coherent Inc. (15%), Thorlabs Inc. (12%), Bruker Corporation (8%), Others (65%)
- M&A Deal Value (2019-2024): $XX Million (cumulative)
- Innovation Catalysts: Government funding for research, collaborative partnerships between academia and industry, and growing venture capital investments.
- Regulatory Landscape: Varied by region, with some stricter regulations impacting development and commercialization timelines.
Optogenetics Industry Evolution
The optogenetics market has witnessed substantial growth since 2019, driven by both technological advancements and an increasing demand for precise and targeted neuromodulation techniques. Between 2019 and 2024, the market experienced a Compound Annual Growth Rate (CAGR) of XX%, reaching $XX Million in 2024. This growth is primarily attributed to the development of more efficient light sources (e.g., improved lasers and LEDs), enhanced actuators with increased sensitivity and specificity, and sophisticated sensors capable of monitoring neuronal activity with high temporal and spatial resolution. Technological improvements have led to wider application across diverse fields, increasing adoption rates across neuroscience research, drug discovery, and therapeutic applications. The market is expected to continue its rapid growth trajectory in the forecast period (2025-2033), reaching an estimated $XX Million by 2033, driven by ongoing technological refinements, the increasing demand for targeted therapies, and the expansion into new application areas. The increasing focus on personalized medicine and the development of novel optogenetic tools to treat retinal diseases are major contributors to this projected growth.
Leading Regions, Countries, or Segments in Optogenetics Industry
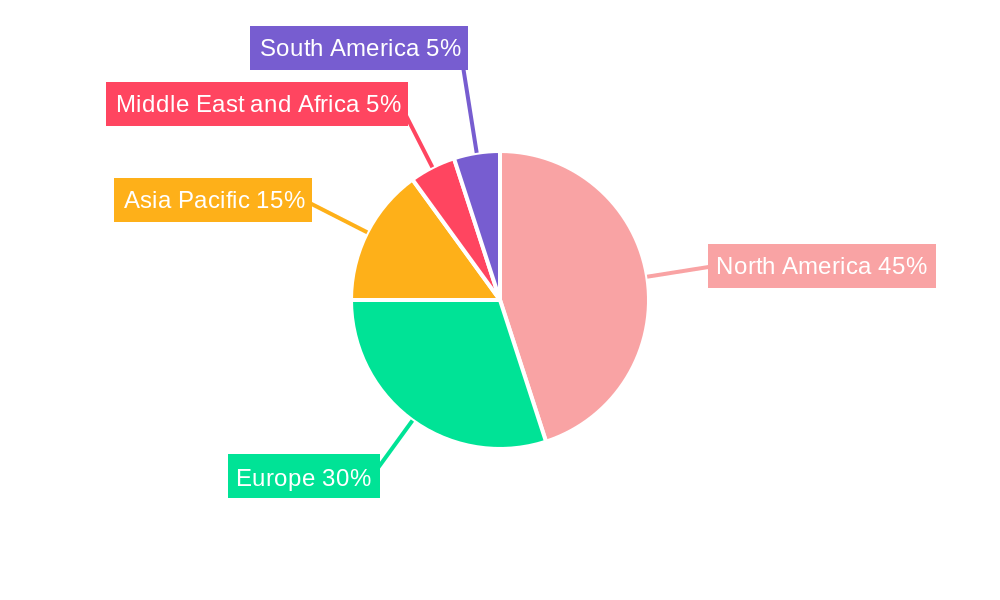
North America currently dominates the optogenetics market, owing to significant investments in research and development, a robust regulatory framework supporting clinical trials, and the presence of major industry players. Europe follows as a significant market, fueled by similar factors. The Neuroscience application segment holds the largest market share, driven by the extensive use of optogenetics in basic research and disease modeling. Within light equipment, Lasers maintain a commanding lead over LEDs due to their superior precision and power. Channelrhodopsin remains the dominant actuator type due to its established efficacy and wide adoption.
- Key Drivers for North America: High research funding, strong regulatory support, established industry presence.
- Key Drivers for Neuroscience Segment: Expanding research into neurodegenerative diseases and mental health disorders, increasing need for precise tools to study brain circuits.
- Key Drivers for Laser Equipment: Superior light control, precision, and penetration depth compared to other light sources.
Optogenetics Industry Product Innovations
Recent innovations include the development of more efficient and biocompatible light sources, actuators with improved spectral properties and photosensitivity, and advanced sensors allowing for high-throughput screening and real-time monitoring of neuronal activity. These advancements lead to improved experimental designs, enhanced data quality, and increased therapeutic efficacy. Miniaturization of optogenetic tools enables minimally invasive procedures, while wireless and implantable devices allow for long-term studies and chronic therapeutic applications. Unique selling propositions often include enhanced sensitivity, specificity, and biocompatibility of the devices.
Propelling Factors for Optogenetics Industry Growth
Technological advancements, such as the development of novel actuators and sensors, are driving market growth. Increasing government funding for neuroscience research and the growing adoption of optogenetics in therapeutic applications are also key factors. Furthermore, the growing demand for targeted therapies and increasing collaboration between academia and industry accelerates market expansion. The successful clinical trials of optogenetic-based therapies, like GenSight Biologic's GS030 for retinitis pigmentosa, further boost investor confidence and stimulate market growth.
Obstacles in the Optogenetics Industry Market
High research and development costs, coupled with the complexities of clinical trials, represent significant barriers to entry. Supply chain disruptions affecting specialized components (e.g., lasers and sensors) can impact production and lead to price volatility. Intense competition among established players and the emergence of new competitors pose challenges for market share acquisition and revenue generation. Regulatory hurdles, varying across different regions, can delay approvals and limit market access. The limited availability of skilled professionals to operate and interpret optogenetic technologies also hinders broader adoption.
Future Opportunities in Optogenetics Industry
Expanding applications in ophthalmology and neurology, including the treatment of various retinal disorders and neurological conditions, offer substantial opportunities. The development of novel actuators with improved properties and the integration of artificial intelligence and machine learning for data analysis create exciting avenues for growth. The increasing demand for personalized medicine, with custom-designed optogenetic interventions, is another significant opportunity. Further exploration of non-invasive optogenetic techniques will widen market applications and broaden adoption.
Major Players in the Optogenetics Industry Ecosystem
- Coherent Inc.
- Gensight Biologics
- Thorlabs Inc.
- Judges Scientific PLC (Scientifica)
- Laserglow Technologies
- Shanghai Laser & Optics Century Co Ltd
- Hubner Group (Cobolt Inc)
- Bruker Corporation
- Noldus Information Technology
Key Developments in Optogenetics Industry Industry
- February 2023: GenSight Biologics announced positive safety and efficacy signals from the PIONEER phase I/II clinical trial of GS030 for retinitis pigmentosa. This significantly boosts the potential of optogenetics for treating retinal diseases.
- June 2022: Bruker Corporation launched the NeuraLight 3D Ultra module, enhancing capabilities for neuroscience and optogenetics research. This broadened the application of Bruker's microscopy platform and strengthened their position within the market.
Strategic Optogenetics Industry Market Forecast
The optogenetics market is poised for robust growth, driven by continuous technological advancements, increasing research funding, and the expansion into new therapeutic areas. Future opportunities lie in the development of advanced tools for minimally invasive procedures and the application of optogenetics to treat a wider range of diseases. The successful translation of research findings into clinical applications will be crucial to unlocking the full potential of this transformative technology and realizing substantial market growth in the coming years. The market is expected to witness a CAGR of XX% during the forecast period (2025-2033), reaching a value of $XX Million by 2033.
Optogenetics Industry Segmentation
-
1. Light Equipment
- 1.1. Laser
- 1.2. Light-emitting Diode (LED)
-
2. Actuator
- 2.1. Channelrhodopsin
- 2.2. Halorhodopsin
- 2.3. Archaerhodopsin
-
3. Sensor
- 3.1. Calcium
- 3.2. Chloride (Clomeleon)
- 3.3. Membrane-gated (Mermaid)
- 3.4. Other Sensors
-
4. Application
- 4.1. Neuroscience
- 4.2. Behavioral Tracking
- 4.3. Retinal Disease Treatment
- 4.4. Other Applications
Optogenetics Industry Segmentation By Geography
-
1. North America
- 1.1. United States
- 1.2. Canada
- 1.3. Mexico
-
2. Europe
- 2.1. Germany
- 2.2. United Kingdom
- 2.3. France
- 2.4. Italy
- 2.5. Spain
- 2.6. Rest of Europe
-
3. Asia Pacific
- 3.1. China
- 3.2. Japan
- 3.3. India
- 3.4. Australia
- 3.5. South Korea
- 3.6. Rest of Asia Pacific
-
4. Middle East and Africa
- 4.1. GCC
- 4.2. South Africa
- 4.3. Rest of Middle East and Africa
-
5. South America
- 5.1. Brazil
- 5.2. Argentina
- 5.3. Rest of South America
Optogenetics Industry REPORT HIGHLIGHTS
| Aspects | Details |
|---|---|
| Study Period | 2019-2033 |
| Base Year | 2024 |
| Estimated Year | 2025 |
| Forecast Period | 2025-2033 |
| Historical Period | 2019-2024 |
| Growth Rate | CAGR of 4.29% from 2019-2033 |
| Segmentation |
|
Table of Contents
- 1. Introduction
- 1.1. Research Scope
- 1.2. Market Segmentation
- 1.3. Research Methodology
- 1.4. Definitions and Assumptions
- 2. Executive Summary
- 2.1. Introduction
- 3. Market Dynamics
- 3.1. Introduction
- 3.2. Market Drivers
- 3.2.1. Potential Diagnostic Tool in the Field of Neurosciences; Rapid Growth of Advanced Technology; Increasing Use of Multimodal Imaging
- 3.3. Market Restrains
- 3.3.1. High Cost of Technology; Lack of Awareness
- 3.4. Market Trends
- 3.4.1. Light-emitting Diode (LED) Segment is Expected to Hold a Significant Share in the Optogenetics Market
- 4. Market Factor Analysis
- 4.1. Porters Five Forces
- 4.2. Supply/Value Chain
- 4.3. PESTEL analysis
- 4.4. Market Entropy
- 4.5. Patent/Trademark Analysis
- 5. Global Optogenetics Industry Analysis, Insights and Forecast, 2019-2031
- 5.1. Market Analysis, Insights and Forecast - by Light Equipment
- 5.1.1. Laser
- 5.1.2. Light-emitting Diode (LED)
- 5.2. Market Analysis, Insights and Forecast - by Actuator
- 5.2.1. Channelrhodopsin
- 5.2.2. Halorhodopsin
- 5.2.3. Archaerhodopsin
- 5.3. Market Analysis, Insights and Forecast - by Sensor
- 5.3.1. Calcium
- 5.3.2. Chloride (Clomeleon)
- 5.3.3. Membrane-gated (Mermaid)
- 5.3.4. Other Sensors
- 5.4. Market Analysis, Insights and Forecast - by Application
- 5.4.1. Neuroscience
- 5.4.2. Behavioral Tracking
- 5.4.3. Retinal Disease Treatment
- 5.4.4. Other Applications
- 5.5. Market Analysis, Insights and Forecast - by Region
- 5.5.1. North America
- 5.5.2. Europe
- 5.5.3. Asia Pacific
- 5.5.4. Middle East and Africa
- 5.5.5. South America
- 5.1. Market Analysis, Insights and Forecast - by Light Equipment
- 6. North America Optogenetics Industry Analysis, Insights and Forecast, 2019-2031
- 6.1. Market Analysis, Insights and Forecast - by Light Equipment
- 6.1.1. Laser
- 6.1.2. Light-emitting Diode (LED)
- 6.2. Market Analysis, Insights and Forecast - by Actuator
- 6.2.1. Channelrhodopsin
- 6.2.2. Halorhodopsin
- 6.2.3. Archaerhodopsin
- 6.3. Market Analysis, Insights and Forecast - by Sensor
- 6.3.1. Calcium
- 6.3.2. Chloride (Clomeleon)
- 6.3.3. Membrane-gated (Mermaid)
- 6.3.4. Other Sensors
- 6.4. Market Analysis, Insights and Forecast - by Application
- 6.4.1. Neuroscience
- 6.4.2. Behavioral Tracking
- 6.4.3. Retinal Disease Treatment
- 6.4.4. Other Applications
- 6.1. Market Analysis, Insights and Forecast - by Light Equipment
- 7. Europe Optogenetics Industry Analysis, Insights and Forecast, 2019-2031
- 7.1. Market Analysis, Insights and Forecast - by Light Equipment
- 7.1.1. Laser
- 7.1.2. Light-emitting Diode (LED)
- 7.2. Market Analysis, Insights and Forecast - by Actuator
- 7.2.1. Channelrhodopsin
- 7.2.2. Halorhodopsin
- 7.2.3. Archaerhodopsin
- 7.3. Market Analysis, Insights and Forecast - by Sensor
- 7.3.1. Calcium
- 7.3.2. Chloride (Clomeleon)
- 7.3.3. Membrane-gated (Mermaid)
- 7.3.4. Other Sensors
- 7.4. Market Analysis, Insights and Forecast - by Application
- 7.4.1. Neuroscience
- 7.4.2. Behavioral Tracking
- 7.4.3. Retinal Disease Treatment
- 7.4.4. Other Applications
- 7.1. Market Analysis, Insights and Forecast - by Light Equipment
- 8. Asia Pacific Optogenetics Industry Analysis, Insights and Forecast, 2019-2031
- 8.1. Market Analysis, Insights and Forecast - by Light Equipment
- 8.1.1. Laser
- 8.1.2. Light-emitting Diode (LED)
- 8.2. Market Analysis, Insights and Forecast - by Actuator
- 8.2.1. Channelrhodopsin
- 8.2.2. Halorhodopsin
- 8.2.3. Archaerhodopsin
- 8.3. Market Analysis, Insights and Forecast - by Sensor
- 8.3.1. Calcium
- 8.3.2. Chloride (Clomeleon)
- 8.3.3. Membrane-gated (Mermaid)
- 8.3.4. Other Sensors
- 8.4. Market Analysis, Insights and Forecast - by Application
- 8.4.1. Neuroscience
- 8.4.2. Behavioral Tracking
- 8.4.3. Retinal Disease Treatment
- 8.4.4. Other Applications
- 8.1. Market Analysis, Insights and Forecast - by Light Equipment
- 9. Middle East and Africa Optogenetics Industry Analysis, Insights and Forecast, 2019-2031
- 9.1. Market Analysis, Insights and Forecast - by Light Equipment
- 9.1.1. Laser
- 9.1.2. Light-emitting Diode (LED)
- 9.2. Market Analysis, Insights and Forecast - by Actuator
- 9.2.1. Channelrhodopsin
- 9.2.2. Halorhodopsin
- 9.2.3. Archaerhodopsin
- 9.3. Market Analysis, Insights and Forecast - by Sensor
- 9.3.1. Calcium
- 9.3.2. Chloride (Clomeleon)
- 9.3.3. Membrane-gated (Mermaid)
- 9.3.4. Other Sensors
- 9.4. Market Analysis, Insights and Forecast - by Application
- 9.4.1. Neuroscience
- 9.4.2. Behavioral Tracking
- 9.4.3. Retinal Disease Treatment
- 9.4.4. Other Applications
- 9.1. Market Analysis, Insights and Forecast - by Light Equipment
- 10. South America Optogenetics Industry Analysis, Insights and Forecast, 2019-2031
- 10.1. Market Analysis, Insights and Forecast - by Light Equipment
- 10.1.1. Laser
- 10.1.2. Light-emitting Diode (LED)
- 10.2. Market Analysis, Insights and Forecast - by Actuator
- 10.2.1. Channelrhodopsin
- 10.2.2. Halorhodopsin
- 10.2.3. Archaerhodopsin
- 10.3. Market Analysis, Insights and Forecast - by Sensor
- 10.3.1. Calcium
- 10.3.2. Chloride (Clomeleon)
- 10.3.3. Membrane-gated (Mermaid)
- 10.3.4. Other Sensors
- 10.4. Market Analysis, Insights and Forecast - by Application
- 10.4.1. Neuroscience
- 10.4.2. Behavioral Tracking
- 10.4.3. Retinal Disease Treatment
- 10.4.4. Other Applications
- 10.1. Market Analysis, Insights and Forecast - by Light Equipment
- 11. North America Optogenetics Industry Analysis, Insights and Forecast, 2019-2031
- 11.1. Market Analysis, Insights and Forecast - By Country/Sub-region
- 11.1.1 United States
- 11.1.2 Canada
- 11.1.3 Mexico
- 12. Europe Optogenetics Industry Analysis, Insights and Forecast, 2019-2031
- 12.1. Market Analysis, Insights and Forecast - By Country/Sub-region
- 12.1.1 Germany
- 12.1.2 United Kingdom
- 12.1.3 France
- 12.1.4 Italy
- 12.1.5 Spain
- 12.1.6 Rest of Europe
- 13. Asia Pacific Optogenetics Industry Analysis, Insights and Forecast, 2019-2031
- 13.1. Market Analysis, Insights and Forecast - By Country/Sub-region
- 13.1.1 China
- 13.1.2 Japan
- 13.1.3 India
- 13.1.4 Australia
- 13.1.5 South Korea
- 13.1.6 Rest of Asia Pacific
- 14. Middle East and Africa Optogenetics Industry Analysis, Insights and Forecast, 2019-2031
- 14.1. Market Analysis, Insights and Forecast - By Country/Sub-region
- 14.1.1 GCC
- 14.1.2 South Africa
- 14.1.3 Rest of Middle East and Africa
- 15. South America Optogenetics Industry Analysis, Insights and Forecast, 2019-2031
- 15.1. Market Analysis, Insights and Forecast - By Country/Sub-region
- 15.1.1 Brazil
- 15.1.2 Argentina
- 15.1.3 Rest of South America
- 16. Competitive Analysis
- 16.1. Global Market Share Analysis 2024
- 16.2. Company Profiles
- 16.2.1 Coherent Inc
- 16.2.1.1. Overview
- 16.2.1.2. Products
- 16.2.1.3. SWOT Analysis
- 16.2.1.4. Recent Developments
- 16.2.1.5. Financials (Based on Availability)
- 16.2.2 Gensight Biologics
- 16.2.2.1. Overview
- 16.2.2.2. Products
- 16.2.2.3. SWOT Analysis
- 16.2.2.4. Recent Developments
- 16.2.2.5. Financials (Based on Availability)
- 16.2.3 Thorlabs Inc *List Not Exhaustive
- 16.2.3.1. Overview
- 16.2.3.2. Products
- 16.2.3.3. SWOT Analysis
- 16.2.3.4. Recent Developments
- 16.2.3.5. Financials (Based on Availability)
- 16.2.4 Judges Scientific PLC (Scientifica)
- 16.2.4.1. Overview
- 16.2.4.2. Products
- 16.2.4.3. SWOT Analysis
- 16.2.4.4. Recent Developments
- 16.2.4.5. Financials (Based on Availability)
- 16.2.5 Laserglow Technologies
- 16.2.5.1. Overview
- 16.2.5.2. Products
- 16.2.5.3. SWOT Analysis
- 16.2.5.4. Recent Developments
- 16.2.5.5. Financials (Based on Availability)
- 16.2.6 Shanghai Laser & Optics Century Co Ltd
- 16.2.6.1. Overview
- 16.2.6.2. Products
- 16.2.6.3. SWOT Analysis
- 16.2.6.4. Recent Developments
- 16.2.6.5. Financials (Based on Availability)
- 16.2.7 Hubner Group (Cobolt Inc )
- 16.2.7.1. Overview
- 16.2.7.2. Products
- 16.2.7.3. SWOT Analysis
- 16.2.7.4. Recent Developments
- 16.2.7.5. Financials (Based on Availability)
- 16.2.8 Bruker Corporation
- 16.2.8.1. Overview
- 16.2.8.2. Products
- 16.2.8.3. SWOT Analysis
- 16.2.8.4. Recent Developments
- 16.2.8.5. Financials (Based on Availability)
- 16.2.9 Noldus Information Technology
- 16.2.9.1. Overview
- 16.2.9.2. Products
- 16.2.9.3. SWOT Analysis
- 16.2.9.4. Recent Developments
- 16.2.9.5. Financials (Based on Availability)
- 16.2.1 Coherent Inc
List of Figures
- Figure 1: Global Optogenetics Industry Revenue Breakdown (Million, %) by Region 2024 & 2032
- Figure 2: North America Optogenetics Industry Revenue (Million), by Country 2024 & 2032
- Figure 3: North America Optogenetics Industry Revenue Share (%), by Country 2024 & 2032
- Figure 4: Europe Optogenetics Industry Revenue (Million), by Country 2024 & 2032
- Figure 5: Europe Optogenetics Industry Revenue Share (%), by Country 2024 & 2032
- Figure 6: Asia Pacific Optogenetics Industry Revenue (Million), by Country 2024 & 2032
- Figure 7: Asia Pacific Optogenetics Industry Revenue Share (%), by Country 2024 & 2032
- Figure 8: Middle East and Africa Optogenetics Industry Revenue (Million), by Country 2024 & 2032
- Figure 9: Middle East and Africa Optogenetics Industry Revenue Share (%), by Country 2024 & 2032
- Figure 10: South America Optogenetics Industry Revenue (Million), by Country 2024 & 2032
- Figure 11: South America Optogenetics Industry Revenue Share (%), by Country 2024 & 2032
- Figure 12: North America Optogenetics Industry Revenue (Million), by Light Equipment 2024 & 2032
- Figure 13: North America Optogenetics Industry Revenue Share (%), by Light Equipment 2024 & 2032
- Figure 14: North America Optogenetics Industry Revenue (Million), by Actuator 2024 & 2032
- Figure 15: North America Optogenetics Industry Revenue Share (%), by Actuator 2024 & 2032
- Figure 16: North America Optogenetics Industry Revenue (Million), by Sensor 2024 & 2032
- Figure 17: North America Optogenetics Industry Revenue Share (%), by Sensor 2024 & 2032
- Figure 18: North America Optogenetics Industry Revenue (Million), by Application 2024 & 2032
- Figure 19: North America Optogenetics Industry Revenue Share (%), by Application 2024 & 2032
- Figure 20: North America Optogenetics Industry Revenue (Million), by Country 2024 & 2032
- Figure 21: North America Optogenetics Industry Revenue Share (%), by Country 2024 & 2032
- Figure 22: Europe Optogenetics Industry Revenue (Million), by Light Equipment 2024 & 2032
- Figure 23: Europe Optogenetics Industry Revenue Share (%), by Light Equipment 2024 & 2032
- Figure 24: Europe Optogenetics Industry Revenue (Million), by Actuator 2024 & 2032
- Figure 25: Europe Optogenetics Industry Revenue Share (%), by Actuator 2024 & 2032
- Figure 26: Europe Optogenetics Industry Revenue (Million), by Sensor 2024 & 2032
- Figure 27: Europe Optogenetics Industry Revenue Share (%), by Sensor 2024 & 2032
- Figure 28: Europe Optogenetics Industry Revenue (Million), by Application 2024 & 2032
- Figure 29: Europe Optogenetics Industry Revenue Share (%), by Application 2024 & 2032
- Figure 30: Europe Optogenetics Industry Revenue (Million), by Country 2024 & 2032
- Figure 31: Europe Optogenetics Industry Revenue Share (%), by Country 2024 & 2032
- Figure 32: Asia Pacific Optogenetics Industry Revenue (Million), by Light Equipment 2024 & 2032
- Figure 33: Asia Pacific Optogenetics Industry Revenue Share (%), by Light Equipment 2024 & 2032
- Figure 34: Asia Pacific Optogenetics Industry Revenue (Million), by Actuator 2024 & 2032
- Figure 35: Asia Pacific Optogenetics Industry Revenue Share (%), by Actuator 2024 & 2032
- Figure 36: Asia Pacific Optogenetics Industry Revenue (Million), by Sensor 2024 & 2032
- Figure 37: Asia Pacific Optogenetics Industry Revenue Share (%), by Sensor 2024 & 2032
- Figure 38: Asia Pacific Optogenetics Industry Revenue (Million), by Application 2024 & 2032
- Figure 39: Asia Pacific Optogenetics Industry Revenue Share (%), by Application 2024 & 2032
- Figure 40: Asia Pacific Optogenetics Industry Revenue (Million), by Country 2024 & 2032
- Figure 41: Asia Pacific Optogenetics Industry Revenue Share (%), by Country 2024 & 2032
- Figure 42: Middle East and Africa Optogenetics Industry Revenue (Million), by Light Equipment 2024 & 2032
- Figure 43: Middle East and Africa Optogenetics Industry Revenue Share (%), by Light Equipment 2024 & 2032
- Figure 44: Middle East and Africa Optogenetics Industry Revenue (Million), by Actuator 2024 & 2032
- Figure 45: Middle East and Africa Optogenetics Industry Revenue Share (%), by Actuator 2024 & 2032
- Figure 46: Middle East and Africa Optogenetics Industry Revenue (Million), by Sensor 2024 & 2032
- Figure 47: Middle East and Africa Optogenetics Industry Revenue Share (%), by Sensor 2024 & 2032
- Figure 48: Middle East and Africa Optogenetics Industry Revenue (Million), by Application 2024 & 2032
- Figure 49: Middle East and Africa Optogenetics Industry Revenue Share (%), by Application 2024 & 2032
- Figure 50: Middle East and Africa Optogenetics Industry Revenue (Million), by Country 2024 & 2032
- Figure 51: Middle East and Africa Optogenetics Industry Revenue Share (%), by Country 2024 & 2032
- Figure 52: South America Optogenetics Industry Revenue (Million), by Light Equipment 2024 & 2032
- Figure 53: South America Optogenetics Industry Revenue Share (%), by Light Equipment 2024 & 2032
- Figure 54: South America Optogenetics Industry Revenue (Million), by Actuator 2024 & 2032
- Figure 55: South America Optogenetics Industry Revenue Share (%), by Actuator 2024 & 2032
- Figure 56: South America Optogenetics Industry Revenue (Million), by Sensor 2024 & 2032
- Figure 57: South America Optogenetics Industry Revenue Share (%), by Sensor 2024 & 2032
- Figure 58: South America Optogenetics Industry Revenue (Million), by Application 2024 & 2032
- Figure 59: South America Optogenetics Industry Revenue Share (%), by Application 2024 & 2032
- Figure 60: South America Optogenetics Industry Revenue (Million), by Country 2024 & 2032
- Figure 61: South America Optogenetics Industry Revenue Share (%), by Country 2024 & 2032
List of Tables
- Table 1: Global Optogenetics Industry Revenue Million Forecast, by Region 2019 & 2032
- Table 2: Global Optogenetics Industry Revenue Million Forecast, by Light Equipment 2019 & 2032
- Table 3: Global Optogenetics Industry Revenue Million Forecast, by Actuator 2019 & 2032
- Table 4: Global Optogenetics Industry Revenue Million Forecast, by Sensor 2019 & 2032
- Table 5: Global Optogenetics Industry Revenue Million Forecast, by Application 2019 & 2032
- Table 6: Global Optogenetics Industry Revenue Million Forecast, by Region 2019 & 2032
- Table 7: Global Optogenetics Industry Revenue Million Forecast, by Country 2019 & 2032
- Table 8: United States Optogenetics Industry Revenue (Million) Forecast, by Application 2019 & 2032
- Table 9: Canada Optogenetics Industry Revenue (Million) Forecast, by Application 2019 & 2032
- Table 10: Mexico Optogenetics Industry Revenue (Million) Forecast, by Application 2019 & 2032
- Table 11: Global Optogenetics Industry Revenue Million Forecast, by Country 2019 & 2032
- Table 12: Germany Optogenetics Industry Revenue (Million) Forecast, by Application 2019 & 2032
- Table 13: United Kingdom Optogenetics Industry Revenue (Million) Forecast, by Application 2019 & 2032
- Table 14: France Optogenetics Industry Revenue (Million) Forecast, by Application 2019 & 2032
- Table 15: Italy Optogenetics Industry Revenue (Million) Forecast, by Application 2019 & 2032
- Table 16: Spain Optogenetics Industry Revenue (Million) Forecast, by Application 2019 & 2032
- Table 17: Rest of Europe Optogenetics Industry Revenue (Million) Forecast, by Application 2019 & 2032
- Table 18: Global Optogenetics Industry Revenue Million Forecast, by Country 2019 & 2032
- Table 19: China Optogenetics Industry Revenue (Million) Forecast, by Application 2019 & 2032
- Table 20: Japan Optogenetics Industry Revenue (Million) Forecast, by Application 2019 & 2032
- Table 21: India Optogenetics Industry Revenue (Million) Forecast, by Application 2019 & 2032
- Table 22: Australia Optogenetics Industry Revenue (Million) Forecast, by Application 2019 & 2032
- Table 23: South Korea Optogenetics Industry Revenue (Million) Forecast, by Application 2019 & 2032
- Table 24: Rest of Asia Pacific Optogenetics Industry Revenue (Million) Forecast, by Application 2019 & 2032
- Table 25: Global Optogenetics Industry Revenue Million Forecast, by Country 2019 & 2032
- Table 26: GCC Optogenetics Industry Revenue (Million) Forecast, by Application 2019 & 2032
- Table 27: South Africa Optogenetics Industry Revenue (Million) Forecast, by Application 2019 & 2032
- Table 28: Rest of Middle East and Africa Optogenetics Industry Revenue (Million) Forecast, by Application 2019 & 2032
- Table 29: Global Optogenetics Industry Revenue Million Forecast, by Country 2019 & 2032
- Table 30: Brazil Optogenetics Industry Revenue (Million) Forecast, by Application 2019 & 2032
- Table 31: Argentina Optogenetics Industry Revenue (Million) Forecast, by Application 2019 & 2032
- Table 32: Rest of South America Optogenetics Industry Revenue (Million) Forecast, by Application 2019 & 2032
- Table 33: Global Optogenetics Industry Revenue Million Forecast, by Light Equipment 2019 & 2032
- Table 34: Global Optogenetics Industry Revenue Million Forecast, by Actuator 2019 & 2032
- Table 35: Global Optogenetics Industry Revenue Million Forecast, by Sensor 2019 & 2032
- Table 36: Global Optogenetics Industry Revenue Million Forecast, by Application 2019 & 2032
- Table 37: Global Optogenetics Industry Revenue Million Forecast, by Country 2019 & 2032
- Table 38: United States Optogenetics Industry Revenue (Million) Forecast, by Application 2019 & 2032
- Table 39: Canada Optogenetics Industry Revenue (Million) Forecast, by Application 2019 & 2032
- Table 40: Mexico Optogenetics Industry Revenue (Million) Forecast, by Application 2019 & 2032
- Table 41: Global Optogenetics Industry Revenue Million Forecast, by Light Equipment 2019 & 2032
- Table 42: Global Optogenetics Industry Revenue Million Forecast, by Actuator 2019 & 2032
- Table 43: Global Optogenetics Industry Revenue Million Forecast, by Sensor 2019 & 2032
- Table 44: Global Optogenetics Industry Revenue Million Forecast, by Application 2019 & 2032
- Table 45: Global Optogenetics Industry Revenue Million Forecast, by Country 2019 & 2032
- Table 46: Germany Optogenetics Industry Revenue (Million) Forecast, by Application 2019 & 2032
- Table 47: United Kingdom Optogenetics Industry Revenue (Million) Forecast, by Application 2019 & 2032
- Table 48: France Optogenetics Industry Revenue (Million) Forecast, by Application 2019 & 2032
- Table 49: Italy Optogenetics Industry Revenue (Million) Forecast, by Application 2019 & 2032
- Table 50: Spain Optogenetics Industry Revenue (Million) Forecast, by Application 2019 & 2032
- Table 51: Rest of Europe Optogenetics Industry Revenue (Million) Forecast, by Application 2019 & 2032
- Table 52: Global Optogenetics Industry Revenue Million Forecast, by Light Equipment 2019 & 2032
- Table 53: Global Optogenetics Industry Revenue Million Forecast, by Actuator 2019 & 2032
- Table 54: Global Optogenetics Industry Revenue Million Forecast, by Sensor 2019 & 2032
- Table 55: Global Optogenetics Industry Revenue Million Forecast, by Application 2019 & 2032
- Table 56: Global Optogenetics Industry Revenue Million Forecast, by Country 2019 & 2032
- Table 57: China Optogenetics Industry Revenue (Million) Forecast, by Application 2019 & 2032
- Table 58: Japan Optogenetics Industry Revenue (Million) Forecast, by Application 2019 & 2032
- Table 59: India Optogenetics Industry Revenue (Million) Forecast, by Application 2019 & 2032
- Table 60: Australia Optogenetics Industry Revenue (Million) Forecast, by Application 2019 & 2032
- Table 61: South Korea Optogenetics Industry Revenue (Million) Forecast, by Application 2019 & 2032
- Table 62: Rest of Asia Pacific Optogenetics Industry Revenue (Million) Forecast, by Application 2019 & 2032
- Table 63: Global Optogenetics Industry Revenue Million Forecast, by Light Equipment 2019 & 2032
- Table 64: Global Optogenetics Industry Revenue Million Forecast, by Actuator 2019 & 2032
- Table 65: Global Optogenetics Industry Revenue Million Forecast, by Sensor 2019 & 2032
- Table 66: Global Optogenetics Industry Revenue Million Forecast, by Application 2019 & 2032
- Table 67: Global Optogenetics Industry Revenue Million Forecast, by Country 2019 & 2032
- Table 68: GCC Optogenetics Industry Revenue (Million) Forecast, by Application 2019 & 2032
- Table 69: South Africa Optogenetics Industry Revenue (Million) Forecast, by Application 2019 & 2032
- Table 70: Rest of Middle East and Africa Optogenetics Industry Revenue (Million) Forecast, by Application 2019 & 2032
- Table 71: Global Optogenetics Industry Revenue Million Forecast, by Light Equipment 2019 & 2032
- Table 72: Global Optogenetics Industry Revenue Million Forecast, by Actuator 2019 & 2032
- Table 73: Global Optogenetics Industry Revenue Million Forecast, by Sensor 2019 & 2032
- Table 74: Global Optogenetics Industry Revenue Million Forecast, by Application 2019 & 2032
- Table 75: Global Optogenetics Industry Revenue Million Forecast, by Country 2019 & 2032
- Table 76: Brazil Optogenetics Industry Revenue (Million) Forecast, by Application 2019 & 2032
- Table 77: Argentina Optogenetics Industry Revenue (Million) Forecast, by Application 2019 & 2032
- Table 78: Rest of South America Optogenetics Industry Revenue (Million) Forecast, by Application 2019 & 2032
Frequently Asked Questions
1. What is the projected Compound Annual Growth Rate (CAGR) of the Optogenetics Industry?
The projected CAGR is approximately 4.29%.
2. Which companies are prominent players in the Optogenetics Industry?
Key companies in the market include Coherent Inc, Gensight Biologics, Thorlabs Inc *List Not Exhaustive, Judges Scientific PLC (Scientifica), Laserglow Technologies, Shanghai Laser & Optics Century Co Ltd, Hubner Group (Cobolt Inc ), Bruker Corporation, Noldus Information Technology.
3. What are the main segments of the Optogenetics Industry?
The market segments include Light Equipment, Actuator, Sensor, Application.
4. Can you provide details about the market size?
The market size is estimated to be USD 576.57 Million as of 2022.
5. What are some drivers contributing to market growth?
Potential Diagnostic Tool in the Field of Neurosciences; Rapid Growth of Advanced Technology; Increasing Use of Multimodal Imaging.
6. What are the notable trends driving market growth?
Light-emitting Diode (LED) Segment is Expected to Hold a Significant Share in the Optogenetics Market.
7. Are there any restraints impacting market growth?
High Cost of Technology; Lack of Awareness.
8. Can you provide examples of recent developments in the market?
In February 2023, GenSight Biologics announced the 1 Year safety data and efficacy signals from the PIONEER phase I/II clinical trial of GS030, an optogenetic treatment candidate for retinitis pigmentosa.
9. What pricing options are available for accessing the report?
Pricing options include single-user, multi-user, and enterprise licenses priced at USD 4750, USD 5250, and USD 8750 respectively.
10. Is the market size provided in terms of value or volume?
The market size is provided in terms of value, measured in Million.
11. Are there any specific market keywords associated with the report?
Yes, the market keyword associated with the report is "Optogenetics Industry," which aids in identifying and referencing the specific market segment covered.
12. How do I determine which pricing option suits my needs best?
The pricing options vary based on user requirements and access needs. Individual users may opt for single-user licenses, while businesses requiring broader access may choose multi-user or enterprise licenses for cost-effective access to the report.
13. Are there any additional resources or data provided in the Optogenetics Industry report?
While the report offers comprehensive insights, it's advisable to review the specific contents or supplementary materials provided to ascertain if additional resources or data are available.
14. How can I stay updated on further developments or reports in the Optogenetics Industry?
To stay informed about further developments, trends, and reports in the Optogenetics Industry, consider subscribing to industry newsletters, following relevant companies and organizations, or regularly checking reputable industry news sources and publications.
Methodology
Step 1 - Identification of Relevant Samples Size from Population Database


Step 2 - Approaches for Defining Global Market Size (Value, Volume* & Price*)

Note*: In applicable scenarios
Step 3 - Data Sources
Primary Research
- Web Analytics
- Survey Reports
- Research Institute
- Latest Research Reports
- Opinion Leaders
Secondary Research
- Annual Reports
- White Paper
- Latest Press Release
- Industry Association
- Paid Database
- Investor Presentations

Step 4 - Data Triangulation
Involves using different sources of information in order to increase the validity of a study
These sources are likely to be stakeholders in a program - participants, other researchers, program staff, other community members, and so on.
Then we put all data in single framework & apply various statistical tools to find out the dynamic on the market.
During the analysis stage, feedback from the stakeholder groups would be compared to determine areas of agreement as well as areas of divergence
