

Key Insights
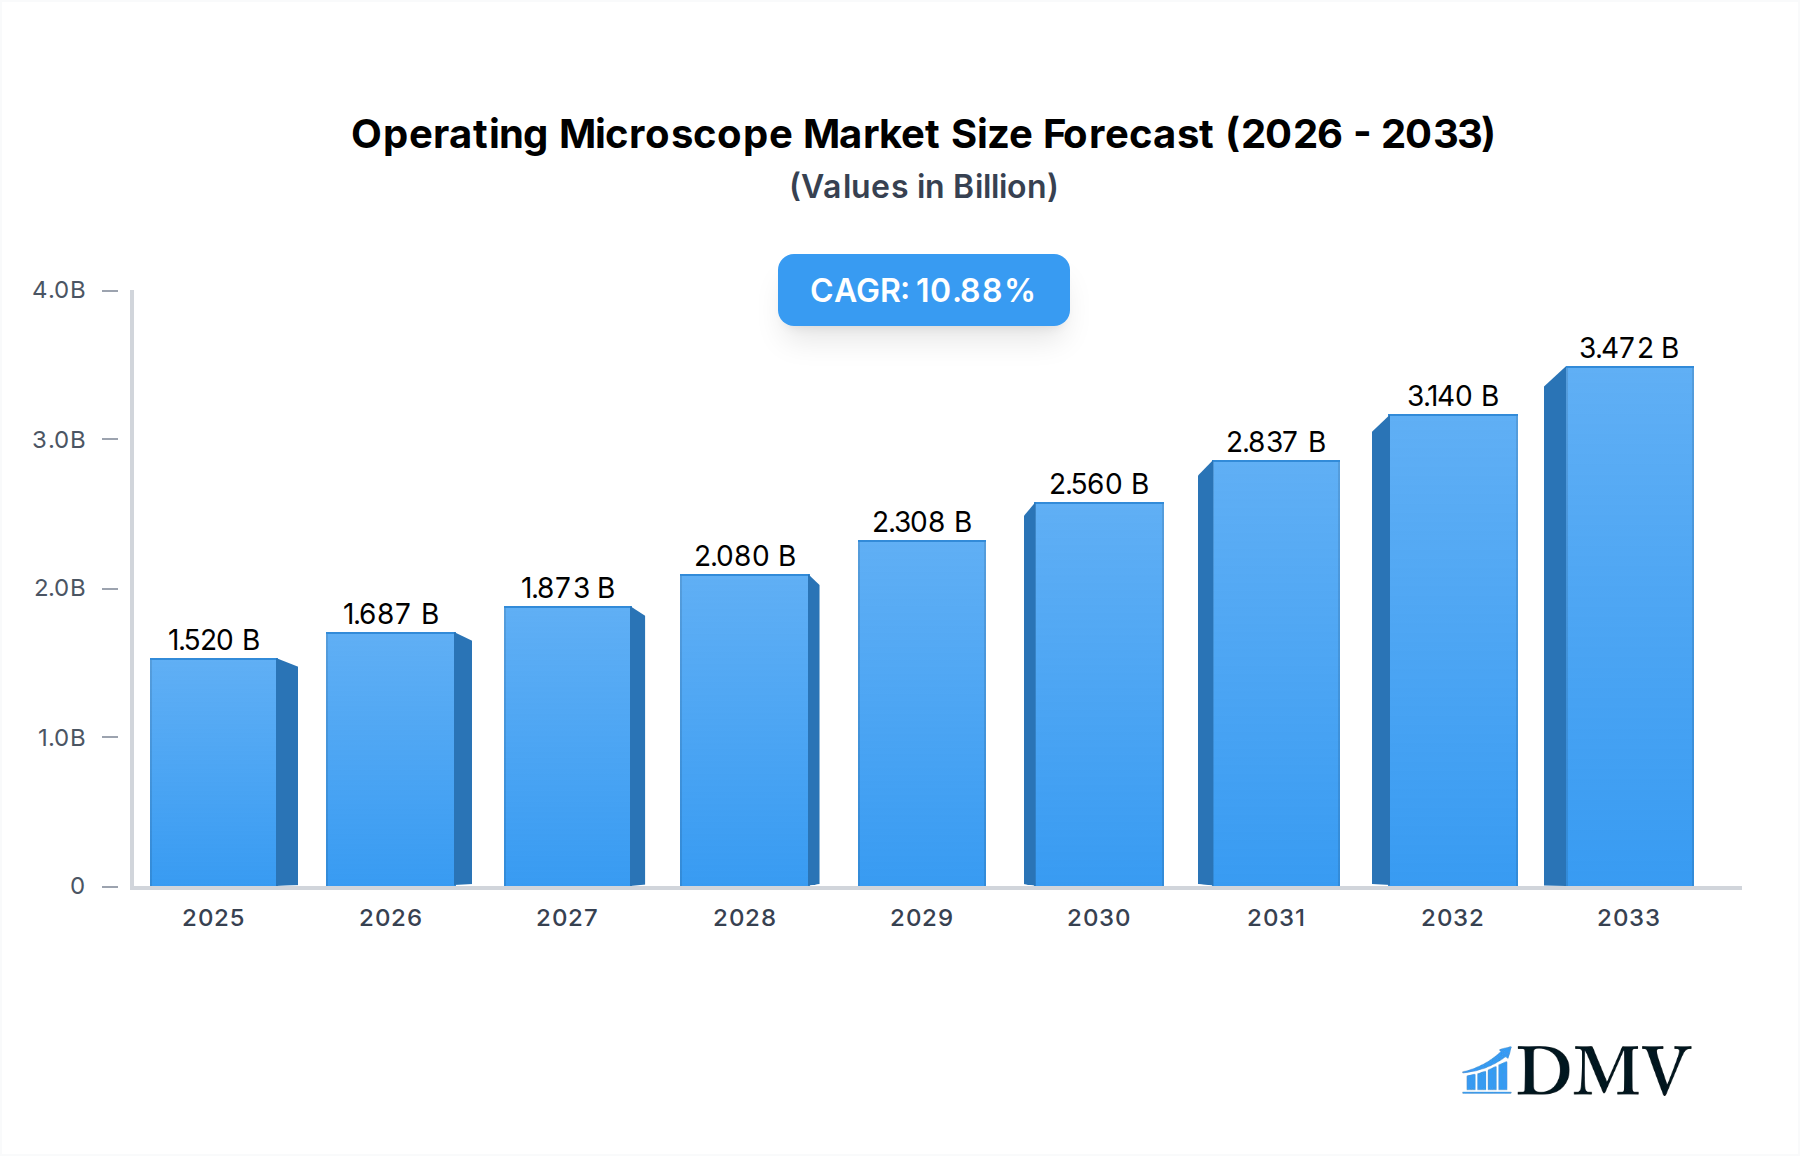
The global operating microscope market is projected to reach a substantial $1.52 billion in 2025, exhibiting robust growth with a Compound Annual Growth Rate (CAGR) of 10.97% throughout the forecast period of 2025-2033. This significant expansion is fueled by a growing demand for minimally invasive surgical procedures across various medical specialties. Advancements in optical technology, coupled with the integration of digital imaging and augmented reality features in operating microscopes, are enhancing surgical precision and patient outcomes, thereby driving market adoption. Furthermore, the increasing prevalence of chronic diseases requiring complex surgical interventions, such as neurological disorders, ENT conditions, and spinal deformities, directly contributes to the escalating demand for sophisticated surgical microscopy solutions.

Operating Microscope Market Size (In Billion)
Key market drivers include the continuous innovation in surgical instrumentation, enabling surgeons to perform intricate procedures with greater accuracy and efficiency. The rising global healthcare expenditure and expanding healthcare infrastructure, particularly in emerging economies, are also playing a pivotal role in market expansion. While the market benefits from these drivers, it also faces certain restraints, such as the high initial cost of advanced operating microscopes and the need for specialized training for surgeons and technicians. However, the trend towards outpatient surgical centers and the increasing focus on improving surgical training and education are expected to mitigate these challenges. The market is segmented by application into hospital and clinic settings, and by type into Neurosurgery Microscopes, ENT Surgery Microscopes, Spine Surgery Microscopes, and Maxillofacial Surgery Microscopes, each segment demonstrating unique growth trajectories driven by specific medical needs.
Operating Microscope Company Market Share
Operating Microscope Market Composition & Trends
The global operating microscope market, projected to reach billions in value, exhibits a dynamic composition driven by relentless innovation and strategic consolidations. Market concentration is moderately high, with key players like Carl Zeiss Meditec, Haag-Streit Surgical, and Leica Microsystems holding significant market share, estimated in the billions. The study period from 2019–2033, with a base year of 2025 and a forecast period of 2025–2033, highlights continuous evolution. Innovation catalysts stem from advancements in optics, digital integration for enhanced visualization and data recording, and miniaturization for minimally invasive procedures. Regulatory landscapes, while stringent, are evolving to accommodate new technologies, particularly in fields demanding high precision. Substitute products, such as advanced visualization systems without the direct microscopic functionality, pose a moderate threat. End-user profiles are increasingly sophisticated, with hospitals and specialized clinics forming the core customer base, demanding cutting-edge solutions for neurosurgery, ENT, spine, and maxillofacial surgery. Mergers and acquisitions (M&A) activities, with reported deal values in the billions, are shaping the market landscape, consolidating expertise and expanding product portfolios.
- Market Share Distribution: Dominant players like Carl Zeiss Meditec, Haag-Streit Surgical, and Leica Microsystems collectively control over billions in market share.
- M&A Deal Values: Recent M&A activities have involved transactions ranging from hundreds of millions to billions, indicating significant consolidation efforts.
- Innovation Focus: Emphasis on digital integration, AI-powered diagnostics, and enhanced ergonomic designs are key R&D drivers.
- Regulatory Impact: Approval pathways for advanced imaging and robotic integration are critical for market access.
Operating Microscope Industry Evolution
The operating microscope industry is on an impressive growth trajectory, with market expansion anticipated to reach billions by 2033. This evolution is intricately linked to significant technological advancements, particularly in digital imaging, robotics, and augmented reality, which are transforming surgical precision and patient outcomes. The study period of 2019–2033, with 2025 as the base and estimated year, and a forecast period from 2025–2033, provides a clear roadmap for this growth. Market growth rates are consistently in the high single digits, driven by an increasing demand for minimally invasive surgical techniques across various specialties. Consumer demand is shifting towards integrated surgical platforms that offer enhanced visualization, real-time data analytics, and improved workflow efficiency. Companies like Life Support Systems, Takagi, and Inami are actively contributing to this evolution by developing advanced optical systems and ergonomic designs, further pushing the boundaries of surgical visualization. The historical period of 2019–2024 witnessed a steady uptake of digital functionalities, laying the groundwork for the more sophisticated integrations seen today. Topcon Europe Medical BV and Allition (Wuzhou) are also key players in this evolving ecosystem, introducing innovative solutions that cater to the growing needs of surgical departments worldwide. The adoption metrics for advanced features, such as 4K imaging and fluorescence microscopy, have seen a substantial increase, reflecting the industry's commitment to adopting state-of-the-art technology. This continuous innovation cycle ensures that the operating microscope remains an indispensable tool in modern surgery, facilitating more complex procedures with greater safety and efficacy, and contributing to an overall market valuation in the billions. Alcon and Seiler, alongside the already mentioned leaders, are actively investing in research and development to maintain their competitive edge in this rapidly advancing field. The global market for these sophisticated surgical instruments is projected to surpass billions within the forecast period.
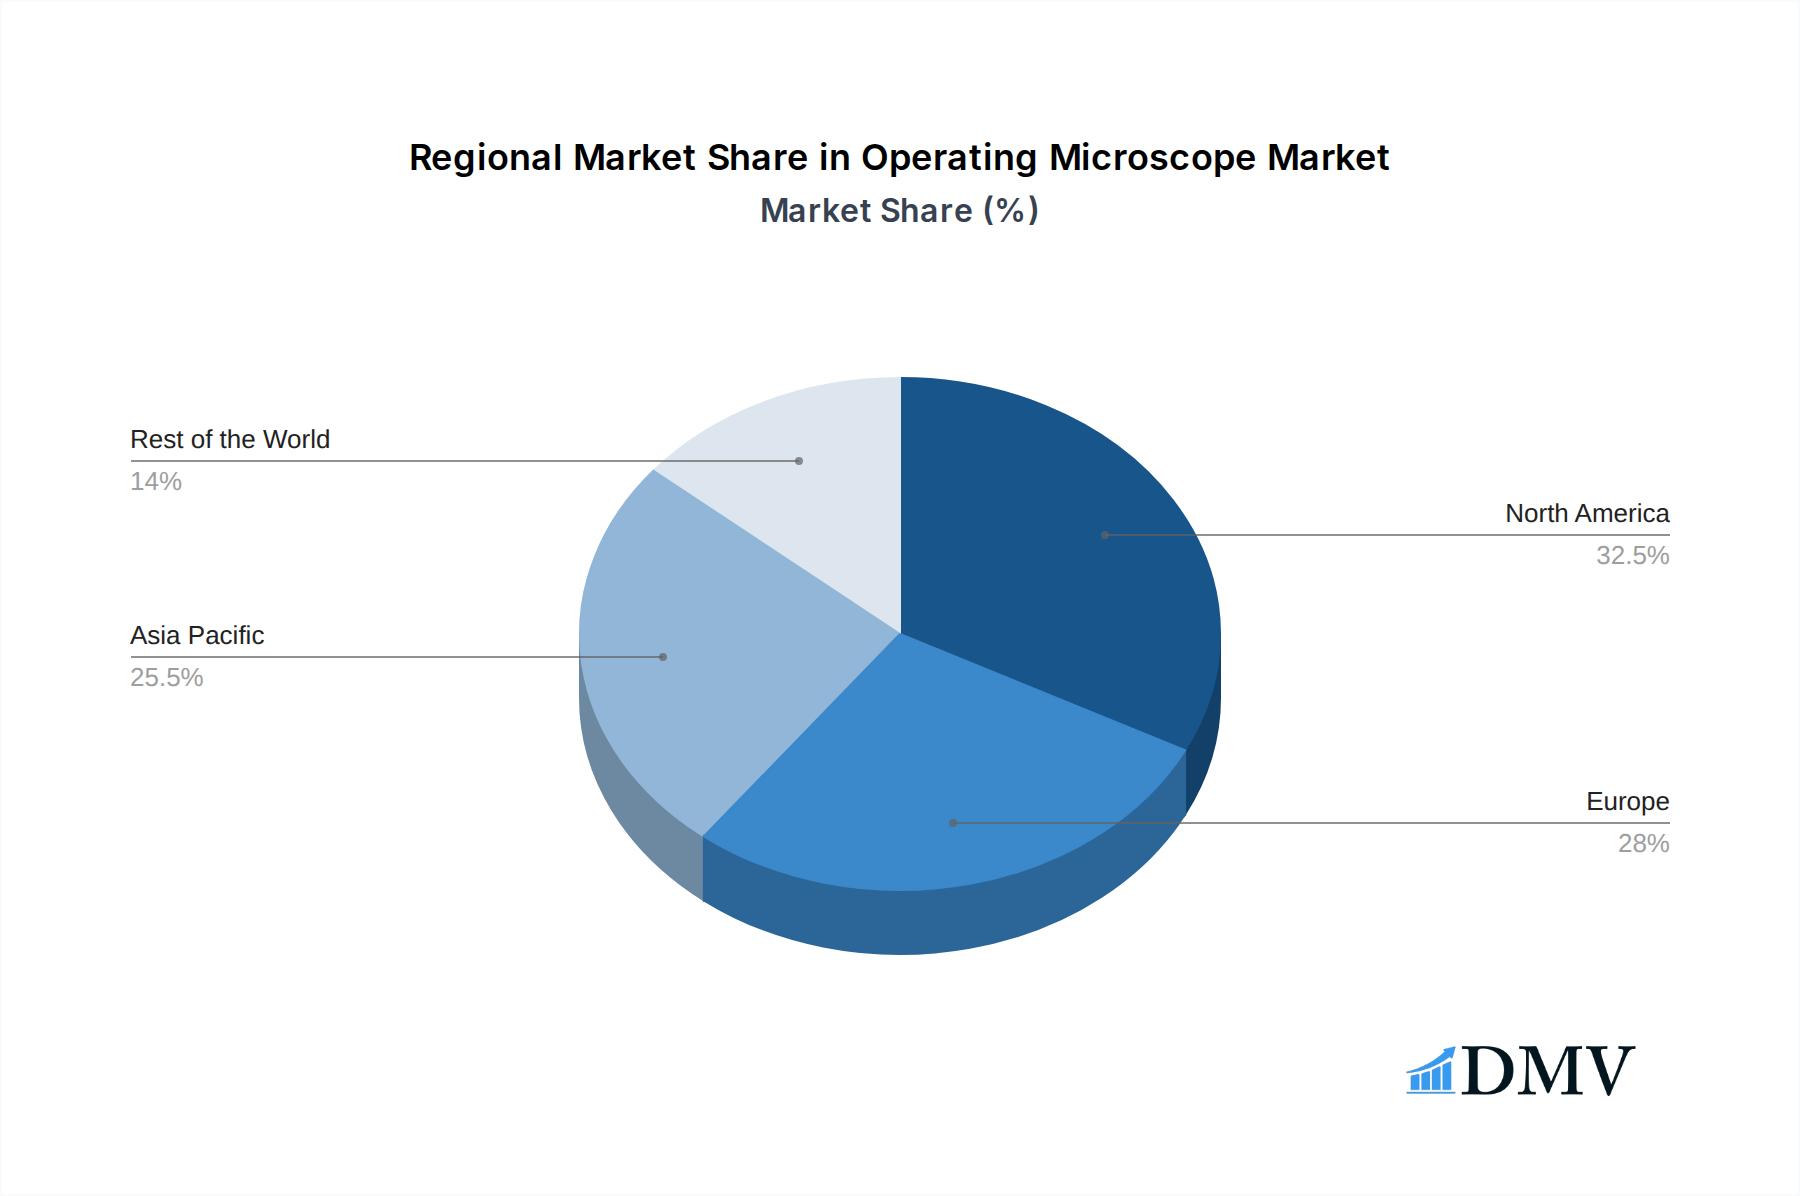
Leading Regions, Countries, or Segments in Operating Microscope
The Neurosurgery Microscope segment, particularly within Hospital applications, emerges as the dominant force in the operating microscope market, driving significant demand and innovation. This dominance is largely attributed to the critical nature of neurosurgical procedures, which necessitate unparalleled visual acuity and precision. The complex anatomy of the brain and spinal cord demands the highest levels of magnification and illumination, making advanced operating microscopes indispensable tools for neurosurgeons. North America and Europe currently lead in market share, fueled by high healthcare expenditure, a robust presence of specialized neurosurgical centers, and significant investments in advanced medical technologies. The forecast period of 2025–2033 is expected to see continued growth in these regions, with an increasing focus on technological integration like augmented reality for enhanced surgical guidance.
Key drivers contributing to the dominance of Neurosurgery Microscopes in Hospitals include:
- Increasing Prevalence of Neurological Disorders: The rising incidence of conditions like brain tumors, aneurysms, and spinal cord injuries directly translates to a greater need for advanced neurosurgical interventions.
- Technological Advancements: Innovations such as intraoperative imaging, fluorescence-guided surgery, and robotic assistance integrated with operating microscopes are enhancing surgical outcomes and expanding the scope of treatable conditions.
- Favorable Reimbursement Policies: Healthcare systems in developed nations often provide favorable reimbursement for procedures utilizing advanced surgical technologies, encouraging adoption.
- Skilled Workforce: The presence of a highly trained and specialized neurosurgical workforce in leading regions adeptly utilizes these complex instruments.
In addition to neurosurgery, the ENT Surgery Microscope segment also demonstrates substantial growth, particularly within specialized Clinics and hospital departments, driven by an increasing volume of procedures related to hearing loss, sinus issues, and other ear, nose, and throat conditions. The market for spine surgery microscopes is also experiencing a significant upswing, aligning with the growing demand for minimally invasive spinal interventions. While maxillofacial surgery microscopes represent a smaller, yet growing segment, their application in reconstructive and cosmetic procedures is steadily expanding. The overall market for operating microscopes is projected to reach billions by 2033, with these specialized segments playing crucial roles in this expansion.
Operating Microscope Product Innovations
Recent product innovations in the operating microscope market have focused on enhancing visualization, user ergonomics, and integration capabilities. Companies are pioneering advancements in 4K UHD optics for unparalleled clarity, digital zoom functionalities for dynamic magnification, and integrated fluorescence modules for tumor margin detection. Ergonomic improvements, such as lighter-weight heads and intuitive control systems, are reducing surgeon fatigue during lengthy procedures. Furthermore, the seamless integration of these microscopes with advanced imaging platforms, robotic systems, and artificial intelligence for surgical guidance represents a significant leap forward, promising enhanced precision and improved patient outcomes in specialties like neurosurgery, ENT, and spine surgery.
Propelling Factors for Operating Microscope Growth
Several key factors are propelling the growth of the operating microscope market. Technological advancements, including enhanced optical systems, digital imaging capabilities, and integration with robotics, are central. The increasing demand for minimally invasive surgical procedures across specialties like neurosurgery, ENT, and spine surgery significantly drives adoption. Furthermore, a growing awareness among healthcare professionals and patients about the benefits of precision surgery, leading to improved patient outcomes, acts as a strong catalyst. Favorable reimbursement policies in developed economies and a rising global healthcare expenditure further bolster market expansion.
Obstacles in the Operating Microscope Market
Despite robust growth, the operating microscope market faces certain obstacles. High initial investment costs for advanced systems can be a barrier, particularly for smaller clinics and in developing regions. Stringent regulatory approval processes for new technologies can lead to prolonged market entry times. Additionally, the need for specialized training for surgeons and technicians to effectively utilize the sophisticated features of modern microscopes can pose a challenge. Supply chain disruptions, as seen in recent global events, can also impact manufacturing and availability, while intense competition among established players and emerging manufacturers can lead to price pressures.
Future Opportunities in Operating Microscope
Emerging opportunities in the operating microscope market are abundant. The increasing integration of Artificial Intelligence (AI) and Machine Learning (ML) for real-time surgical guidance and predictive analytics presents a significant frontier. Expansion into emerging economies with rapidly developing healthcare infrastructure offers substantial untapped market potential. Furthermore, the development of compact, portable, and more affordable microscope solutions could democratize access to advanced surgical visualization. Innovations in augmented reality (AR) and virtual reality (VR) integration for surgical training and intraoperative visualization are also poised to create new market niches.
Major Players in the Operating Microscope Ecosystem
- Carl Zeiss Meditec
- Haag-Streit Surgical
- Leica Microsystems
- Life Support Systems
- Takagi
- Inami
- Topcon Europe Medical BV
- Allition (Wuzhou)
- Alcon
- Seiler
Key Developments in Operating Microscope Industry
- 2023 March: Leica Microsystems launches a new generation of digital surgical microscopes with enhanced AI integration.
- 2023 January: Carl Zeiss Meditec announces strategic partnership for advanced robotic-assisted microscopy solutions.
- 2022 November: Haag-Streit Surgical introduces a novel fluorescence imaging module for neurosurgical applications.
- 2022 July: Alcon expands its surgical microscope portfolio with a focus on ophthalmic procedures.
- 2022 April: Takagi unveils a compact and portable operating microscope designed for diverse surgical settings.
Strategic Operating Microscope Market Forecast
The strategic operating microscope market forecast is exceptionally promising, driven by continuous technological innovation, particularly in digital integration and AI. The increasing adoption of minimally invasive techniques across neurosurgery, ENT, spine surgery, and maxillofacial surgery will remain a primary growth catalyst. Emerging economies present substantial untapped potential, while advancements in AR/VR for surgical training and guidance will open new avenues. The market's trajectory towards sophisticated, connected surgical ecosystems suggests sustained growth, with market valuations set to reach billions by 2033.
Operating Microscope Segmentation
-
1. Application
- 1.1. Hospital
- 1.2. Clinic
-
2. Type
- 2.1. Neurosurgery Microscope
- 2.2. ENT Surgery Microscope
- 2.3. Spine Surgery Microscope
- 2.4. Maxillofacial Surgery Microscope
Operating Microscope Segmentation By Geography
-
1. North America
- 1.1. United States
- 1.2. Canada
- 1.3. Mexico
-
2. South America
- 2.1. Brazil
- 2.2. Argentina
- 2.3. Rest of South America
-
3. Europe
- 3.1. United Kingdom
- 3.2. Germany
- 3.3. France
- 3.4. Italy
- 3.5. Spain
- 3.6. Russia
- 3.7. Benelux
- 3.8. Nordics
- 3.9. Rest of Europe
-
4. Middle East & Africa
- 4.1. Turkey
- 4.2. Israel
- 4.3. GCC
- 4.4. North Africa
- 4.5. South Africa
- 4.6. Rest of Middle East & Africa
-
5. Asia Pacific
- 5.1. China
- 5.2. India
- 5.3. Japan
- 5.4. South Korea
- 5.5. ASEAN
- 5.6. Oceania
- 5.7. Rest of Asia Pacific
Operating Microscope Regional Market Share
Geographic Coverage of Operating Microscope
Operating Microscope REPORT HIGHLIGHTS
| Aspects | Details |
|---|---|
| Study Period | 2020-2034 |
| Base Year | 2025 |
| Estimated Year | 2026 |
| Forecast Period | 2026-2034 |
| Historical Period | 2020-2025 |
| Growth Rate | CAGR of 10.97% from 2020-2034 |
| Segmentation |
|
Table of Contents
- 1. Introduction
- 1.1. Research Scope
- 1.2. Market Segmentation
- 1.3. Research Objective
- 1.4. Definitions and Assumptions
- 2. Executive Summary
- 2.1. Market Snapshot
- 3. Market Dynamics
- 3.1. Market Drivers
- 3.2. Market Restrains
- 3.3. Market Trends
- 3.4. Market Opportunities
- 4. Market Factor Analysis
- 4.1. Porters Five Forces
- 4.1.1. Bargaining Power of Suppliers
- 4.1.2. Bargaining Power of Buyers
- 4.1.3. Threat of New Entrants
- 4.1.4. Threat of Substitutes
- 4.1.5. Competitive Rivalry
- 4.2. PESTEL analysis
- 4.3. BCG Analysis
- 4.3.1. Stars (High Growth, High Market Share)
- 4.3.2. Cash Cows (Low Growth, High Market Share)
- 4.3.3. Question Mark (High Growth, Low Market Share)
- 4.3.4. Dogs (Low Growth, Low Market Share)
- 4.4. Ansoff Matrix Analysis
- 4.5. Supply Chain Analysis
- 4.6. Regulatory Landscape
- 4.7. Current Market Potential and Opportunity Assessment (TAM–SAM–SOM Framework)
- 4.8. DMV Analyst Note
- 4.1. Porters Five Forces
- 5. Market Analysis, Insights and Forecast 2021-2033
- 5.1. Market Analysis, Insights and Forecast - by Application
- 5.1.1. Hospital
- 5.1.2. Clinic
- 5.2. Market Analysis, Insights and Forecast - by Type
- 5.2.1. Neurosurgery Microscope
- 5.2.2. ENT Surgery Microscope
- 5.2.3. Spine Surgery Microscope
- 5.2.4. Maxillofacial Surgery Microscope
- 5.3. Market Analysis, Insights and Forecast - by Region
- 5.3.1. North America
- 5.3.2. South America
- 5.3.3. Europe
- 5.3.4. Middle East & Africa
- 5.3.5. Asia Pacific
- 5.1. Market Analysis, Insights and Forecast - by Application
- 6. Global Operating Microscope Analysis, Insights and Forecast, 2021-2033
- 6.1. Market Analysis, Insights and Forecast - by Application
- 6.1.1. Hospital
- 6.1.2. Clinic
- 6.2. Market Analysis, Insights and Forecast - by Type
- 6.2.1. Neurosurgery Microscope
- 6.2.2. ENT Surgery Microscope
- 6.2.3. Spine Surgery Microscope
- 6.2.4. Maxillofacial Surgery Microscope
- 6.1. Market Analysis, Insights and Forecast - by Application
- 7. North America Operating Microscope Analysis, Insights and Forecast, 2020-2032
- 7.1. Market Analysis, Insights and Forecast - by Application
- 7.1.1. Hospital
- 7.1.2. Clinic
- 7.2. Market Analysis, Insights and Forecast - by Type
- 7.2.1. Neurosurgery Microscope
- 7.2.2. ENT Surgery Microscope
- 7.2.3. Spine Surgery Microscope
- 7.2.4. Maxillofacial Surgery Microscope
- 7.1. Market Analysis, Insights and Forecast - by Application
- 8. South America Operating Microscope Analysis, Insights and Forecast, 2020-2032
- 8.1. Market Analysis, Insights and Forecast - by Application
- 8.1.1. Hospital
- 8.1.2. Clinic
- 8.2. Market Analysis, Insights and Forecast - by Type
- 8.2.1. Neurosurgery Microscope
- 8.2.2. ENT Surgery Microscope
- 8.2.3. Spine Surgery Microscope
- 8.2.4. Maxillofacial Surgery Microscope
- 8.1. Market Analysis, Insights and Forecast - by Application
- 9. Europe Operating Microscope Analysis, Insights and Forecast, 2020-2032
- 9.1. Market Analysis, Insights and Forecast - by Application
- 9.1.1. Hospital
- 9.1.2. Clinic
- 9.2. Market Analysis, Insights and Forecast - by Type
- 9.2.1. Neurosurgery Microscope
- 9.2.2. ENT Surgery Microscope
- 9.2.3. Spine Surgery Microscope
- 9.2.4. Maxillofacial Surgery Microscope
- 9.1. Market Analysis, Insights and Forecast - by Application
- 10. Middle East & Africa Operating Microscope Analysis, Insights and Forecast, 2020-2032
- 10.1. Market Analysis, Insights and Forecast - by Application
- 10.1.1. Hospital
- 10.1.2. Clinic
- 10.2. Market Analysis, Insights and Forecast - by Type
- 10.2.1. Neurosurgery Microscope
- 10.2.2. ENT Surgery Microscope
- 10.2.3. Spine Surgery Microscope
- 10.2.4. Maxillofacial Surgery Microscope
- 10.1. Market Analysis, Insights and Forecast - by Application
- 11. Asia Pacific Operating Microscope Analysis, Insights and Forecast, 2020-2032
- 11.1. Market Analysis, Insights and Forecast - by Application
- 11.1.1. Hospital
- 11.1.2. Clinic
- 11.2. Market Analysis, Insights and Forecast - by Type
- 11.2.1. Neurosurgery Microscope
- 11.2.2. ENT Surgery Microscope
- 11.2.3. Spine Surgery Microscope
- 11.2.4. Maxillofacial Surgery Microscope
- 11.1. Market Analysis, Insights and Forecast - by Application
- 12. Competitive Analysis
- 12.1. Company Profiles
- 12.1.1 Carl Zeiss Meditec
- 12.1.1.1. Company Overview
- 12.1.1.2. Products
- 12.1.1.3. Company Financials
- 12.1.1.4. SWOT Analysis
- 12.1.2 Haag-Streit Surgical
- 12.1.2.1. Company Overview
- 12.1.2.2. Products
- 12.1.2.3. Company Financials
- 12.1.2.4. SWOT Analysis
- 12.1.3 Leica Microsystems
- 12.1.3.1. Company Overview
- 12.1.3.2. Products
- 12.1.3.3. Company Financials
- 12.1.3.4. SWOT Analysis
- 12.1.4 Life Support Systems
- 12.1.4.1. Company Overview
- 12.1.4.2. Products
- 12.1.4.3. Company Financials
- 12.1.4.4. SWOT Analysis
- 12.1.5 Takagi
- 12.1.5.1. Company Overview
- 12.1.5.2. Products
- 12.1.5.3. Company Financials
- 12.1.5.4. SWOT Analysis
- 12.1.6 Inami
- 12.1.6.1. Company Overview
- 12.1.6.2. Products
- 12.1.6.3. Company Financials
- 12.1.6.4. SWOT Analysis
- 12.1.7 Topcon Europe Medical BV
- 12.1.7.1. Company Overview
- 12.1.7.2. Products
- 12.1.7.3. Company Financials
- 12.1.7.4. SWOT Analysis
- 12.1.8 Allition (Wuzhou)
- 12.1.8.1. Company Overview
- 12.1.8.2. Products
- 12.1.8.3. Company Financials
- 12.1.8.4. SWOT Analysis
- 12.1.9 Alcon
- 12.1.9.1. Company Overview
- 12.1.9.2. Products
- 12.1.9.3. Company Financials
- 12.1.9.4. SWOT Analysis
- 12.1.10 Seiler
- 12.1.10.1. Company Overview
- 12.1.10.2. Products
- 12.1.10.3. Company Financials
- 12.1.10.4. SWOT Analysis
- 12.1.11 Haag-Streit Surgical
- 12.1.11.1. Company Overview
- 12.1.11.2. Products
- 12.1.11.3. Company Financials
- 12.1.11.4. SWOT Analysis
- 12.1.1 Carl Zeiss Meditec
- 12.2. Market Entropy
- 12.2.1 Company's Key Areas Served
- 12.2.2 Recent Developments
- 12.3. Company Market Share Analysis 2025
- 12.3.1 Top 5 Companies Market Share Analysis
- 12.3.2 Top 3 Companies Market Share Analysis
- 12.4. List of Potential Customers
- 13. Research Methodology
List of Figures
- Figure 1: Global Operating Microscope Revenue Breakdown (undefined, %) by Region 2025 & 2033
- Figure 2: Global Operating Microscope Volume Breakdown (K, %) by Region 2025 & 2033
- Figure 3: North America Operating Microscope Revenue (undefined), by Application 2025 & 2033
- Figure 4: North America Operating Microscope Volume (K), by Application 2025 & 2033
- Figure 5: North America Operating Microscope Revenue Share (%), by Application 2025 & 2033
- Figure 6: North America Operating Microscope Volume Share (%), by Application 2025 & 2033
- Figure 7: North America Operating Microscope Revenue (undefined), by Type 2025 & 2033
- Figure 8: North America Operating Microscope Volume (K), by Type 2025 & 2033
- Figure 9: North America Operating Microscope Revenue Share (%), by Type 2025 & 2033
- Figure 10: North America Operating Microscope Volume Share (%), by Type 2025 & 2033
- Figure 11: North America Operating Microscope Revenue (undefined), by Country 2025 & 2033
- Figure 12: North America Operating Microscope Volume (K), by Country 2025 & 2033
- Figure 13: North America Operating Microscope Revenue Share (%), by Country 2025 & 2033
- Figure 14: North America Operating Microscope Volume Share (%), by Country 2025 & 2033
- Figure 15: South America Operating Microscope Revenue (undefined), by Application 2025 & 2033
- Figure 16: South America Operating Microscope Volume (K), by Application 2025 & 2033
- Figure 17: South America Operating Microscope Revenue Share (%), by Application 2025 & 2033
- Figure 18: South America Operating Microscope Volume Share (%), by Application 2025 & 2033
- Figure 19: South America Operating Microscope Revenue (undefined), by Type 2025 & 2033
- Figure 20: South America Operating Microscope Volume (K), by Type 2025 & 2033
- Figure 21: South America Operating Microscope Revenue Share (%), by Type 2025 & 2033
- Figure 22: South America Operating Microscope Volume Share (%), by Type 2025 & 2033
- Figure 23: South America Operating Microscope Revenue (undefined), by Country 2025 & 2033
- Figure 24: South America Operating Microscope Volume (K), by Country 2025 & 2033
- Figure 25: South America Operating Microscope Revenue Share (%), by Country 2025 & 2033
- Figure 26: South America Operating Microscope Volume Share (%), by Country 2025 & 2033
- Figure 27: Europe Operating Microscope Revenue (undefined), by Application 2025 & 2033
- Figure 28: Europe Operating Microscope Volume (K), by Application 2025 & 2033
- Figure 29: Europe Operating Microscope Revenue Share (%), by Application 2025 & 2033
- Figure 30: Europe Operating Microscope Volume Share (%), by Application 2025 & 2033
- Figure 31: Europe Operating Microscope Revenue (undefined), by Type 2025 & 2033
- Figure 32: Europe Operating Microscope Volume (K), by Type 2025 & 2033
- Figure 33: Europe Operating Microscope Revenue Share (%), by Type 2025 & 2033
- Figure 34: Europe Operating Microscope Volume Share (%), by Type 2025 & 2033
- Figure 35: Europe Operating Microscope Revenue (undefined), by Country 2025 & 2033
- Figure 36: Europe Operating Microscope Volume (K), by Country 2025 & 2033
- Figure 37: Europe Operating Microscope Revenue Share (%), by Country 2025 & 2033
- Figure 38: Europe Operating Microscope Volume Share (%), by Country 2025 & 2033
- Figure 39: Middle East & Africa Operating Microscope Revenue (undefined), by Application 2025 & 2033
- Figure 40: Middle East & Africa Operating Microscope Volume (K), by Application 2025 & 2033
- Figure 41: Middle East & Africa Operating Microscope Revenue Share (%), by Application 2025 & 2033
- Figure 42: Middle East & Africa Operating Microscope Volume Share (%), by Application 2025 & 2033
- Figure 43: Middle East & Africa Operating Microscope Revenue (undefined), by Type 2025 & 2033
- Figure 44: Middle East & Africa Operating Microscope Volume (K), by Type 2025 & 2033
- Figure 45: Middle East & Africa Operating Microscope Revenue Share (%), by Type 2025 & 2033
- Figure 46: Middle East & Africa Operating Microscope Volume Share (%), by Type 2025 & 2033
- Figure 47: Middle East & Africa Operating Microscope Revenue (undefined), by Country 2025 & 2033
- Figure 48: Middle East & Africa Operating Microscope Volume (K), by Country 2025 & 2033
- Figure 49: Middle East & Africa Operating Microscope Revenue Share (%), by Country 2025 & 2033
- Figure 50: Middle East & Africa Operating Microscope Volume Share (%), by Country 2025 & 2033
- Figure 51: Asia Pacific Operating Microscope Revenue (undefined), by Application 2025 & 2033
- Figure 52: Asia Pacific Operating Microscope Volume (K), by Application 2025 & 2033
- Figure 53: Asia Pacific Operating Microscope Revenue Share (%), by Application 2025 & 2033
- Figure 54: Asia Pacific Operating Microscope Volume Share (%), by Application 2025 & 2033
- Figure 55: Asia Pacific Operating Microscope Revenue (undefined), by Type 2025 & 2033
- Figure 56: Asia Pacific Operating Microscope Volume (K), by Type 2025 & 2033
- Figure 57: Asia Pacific Operating Microscope Revenue Share (%), by Type 2025 & 2033
- Figure 58: Asia Pacific Operating Microscope Volume Share (%), by Type 2025 & 2033
- Figure 59: Asia Pacific Operating Microscope Revenue (undefined), by Country 2025 & 2033
- Figure 60: Asia Pacific Operating Microscope Volume (K), by Country 2025 & 2033
- Figure 61: Asia Pacific Operating Microscope Revenue Share (%), by Country 2025 & 2033
- Figure 62: Asia Pacific Operating Microscope Volume Share (%), by Country 2025 & 2033
List of Tables
- Table 1: Global Operating Microscope Revenue undefined Forecast, by Application 2020 & 2033
- Table 2: Global Operating Microscope Volume K Forecast, by Application 2020 & 2033
- Table 3: Global Operating Microscope Revenue undefined Forecast, by Type 2020 & 2033
- Table 4: Global Operating Microscope Volume K Forecast, by Type 2020 & 2033
- Table 5: Global Operating Microscope Revenue undefined Forecast, by Region 2020 & 2033
- Table 6: Global Operating Microscope Volume K Forecast, by Region 2020 & 2033
- Table 7: Global Operating Microscope Revenue undefined Forecast, by Application 2020 & 2033
- Table 8: Global Operating Microscope Volume K Forecast, by Application 2020 & 2033
- Table 9: Global Operating Microscope Revenue undefined Forecast, by Type 2020 & 2033
- Table 10: Global Operating Microscope Volume K Forecast, by Type 2020 & 2033
- Table 11: Global Operating Microscope Revenue undefined Forecast, by Country 2020 & 2033
- Table 12: Global Operating Microscope Volume K Forecast, by Country 2020 & 2033
- Table 13: United States Operating Microscope Revenue (undefined) Forecast, by Application 2020 & 2033
- Table 14: United States Operating Microscope Volume (K) Forecast, by Application 2020 & 2033
- Table 15: Canada Operating Microscope Revenue (undefined) Forecast, by Application 2020 & 2033
- Table 16: Canada Operating Microscope Volume (K) Forecast, by Application 2020 & 2033
- Table 17: Mexico Operating Microscope Revenue (undefined) Forecast, by Application 2020 & 2033
- Table 18: Mexico Operating Microscope Volume (K) Forecast, by Application 2020 & 2033
- Table 19: Global Operating Microscope Revenue undefined Forecast, by Application 2020 & 2033
- Table 20: Global Operating Microscope Volume K Forecast, by Application 2020 & 2033
- Table 21: Global Operating Microscope Revenue undefined Forecast, by Type 2020 & 2033
- Table 22: Global Operating Microscope Volume K Forecast, by Type 2020 & 2033
- Table 23: Global Operating Microscope Revenue undefined Forecast, by Country 2020 & 2033
- Table 24: Global Operating Microscope Volume K Forecast, by Country 2020 & 2033
- Table 25: Brazil Operating Microscope Revenue (undefined) Forecast, by Application 2020 & 2033
- Table 26: Brazil Operating Microscope Volume (K) Forecast, by Application 2020 & 2033
- Table 27: Argentina Operating Microscope Revenue (undefined) Forecast, by Application 2020 & 2033
- Table 28: Argentina Operating Microscope Volume (K) Forecast, by Application 2020 & 2033
- Table 29: Rest of South America Operating Microscope Revenue (undefined) Forecast, by Application 2020 & 2033
- Table 30: Rest of South America Operating Microscope Volume (K) Forecast, by Application 2020 & 2033
- Table 31: Global Operating Microscope Revenue undefined Forecast, by Application 2020 & 2033
- Table 32: Global Operating Microscope Volume K Forecast, by Application 2020 & 2033
- Table 33: Global Operating Microscope Revenue undefined Forecast, by Type 2020 & 2033
- Table 34: Global Operating Microscope Volume K Forecast, by Type 2020 & 2033
- Table 35: Global Operating Microscope Revenue undefined Forecast, by Country 2020 & 2033
- Table 36: Global Operating Microscope Volume K Forecast, by Country 2020 & 2033
- Table 37: United Kingdom Operating Microscope Revenue (undefined) Forecast, by Application 2020 & 2033
- Table 38: United Kingdom Operating Microscope Volume (K) Forecast, by Application 2020 & 2033
- Table 39: Germany Operating Microscope Revenue (undefined) Forecast, by Application 2020 & 2033
- Table 40: Germany Operating Microscope Volume (K) Forecast, by Application 2020 & 2033
- Table 41: France Operating Microscope Revenue (undefined) Forecast, by Application 2020 & 2033
- Table 42: France Operating Microscope Volume (K) Forecast, by Application 2020 & 2033
- Table 43: Italy Operating Microscope Revenue (undefined) Forecast, by Application 2020 & 2033
- Table 44: Italy Operating Microscope Volume (K) Forecast, by Application 2020 & 2033
- Table 45: Spain Operating Microscope Revenue (undefined) Forecast, by Application 2020 & 2033
- Table 46: Spain Operating Microscope Volume (K) Forecast, by Application 2020 & 2033
- Table 47: Russia Operating Microscope Revenue (undefined) Forecast, by Application 2020 & 2033
- Table 48: Russia Operating Microscope Volume (K) Forecast, by Application 2020 & 2033
- Table 49: Benelux Operating Microscope Revenue (undefined) Forecast, by Application 2020 & 2033
- Table 50: Benelux Operating Microscope Volume (K) Forecast, by Application 2020 & 2033
- Table 51: Nordics Operating Microscope Revenue (undefined) Forecast, by Application 2020 & 2033
- Table 52: Nordics Operating Microscope Volume (K) Forecast, by Application 2020 & 2033
- Table 53: Rest of Europe Operating Microscope Revenue (undefined) Forecast, by Application 2020 & 2033
- Table 54: Rest of Europe Operating Microscope Volume (K) Forecast, by Application 2020 & 2033
- Table 55: Global Operating Microscope Revenue undefined Forecast, by Application 2020 & 2033
- Table 56: Global Operating Microscope Volume K Forecast, by Application 2020 & 2033
- Table 57: Global Operating Microscope Revenue undefined Forecast, by Type 2020 & 2033
- Table 58: Global Operating Microscope Volume K Forecast, by Type 2020 & 2033
- Table 59: Global Operating Microscope Revenue undefined Forecast, by Country 2020 & 2033
- Table 60: Global Operating Microscope Volume K Forecast, by Country 2020 & 2033
- Table 61: Turkey Operating Microscope Revenue (undefined) Forecast, by Application 2020 & 2033
- Table 62: Turkey Operating Microscope Volume (K) Forecast, by Application 2020 & 2033
- Table 63: Israel Operating Microscope Revenue (undefined) Forecast, by Application 2020 & 2033
- Table 64: Israel Operating Microscope Volume (K) Forecast, by Application 2020 & 2033
- Table 65: GCC Operating Microscope Revenue (undefined) Forecast, by Application 2020 & 2033
- Table 66: GCC Operating Microscope Volume (K) Forecast, by Application 2020 & 2033
- Table 67: North Africa Operating Microscope Revenue (undefined) Forecast, by Application 2020 & 2033
- Table 68: North Africa Operating Microscope Volume (K) Forecast, by Application 2020 & 2033
- Table 69: South Africa Operating Microscope Revenue (undefined) Forecast, by Application 2020 & 2033
- Table 70: South Africa Operating Microscope Volume (K) Forecast, by Application 2020 & 2033
- Table 71: Rest of Middle East & Africa Operating Microscope Revenue (undefined) Forecast, by Application 2020 & 2033
- Table 72: Rest of Middle East & Africa Operating Microscope Volume (K) Forecast, by Application 2020 & 2033
- Table 73: Global Operating Microscope Revenue undefined Forecast, by Application 2020 & 2033
- Table 74: Global Operating Microscope Volume K Forecast, by Application 2020 & 2033
- Table 75: Global Operating Microscope Revenue undefined Forecast, by Type 2020 & 2033
- Table 76: Global Operating Microscope Volume K Forecast, by Type 2020 & 2033
- Table 77: Global Operating Microscope Revenue undefined Forecast, by Country 2020 & 2033
- Table 78: Global Operating Microscope Volume K Forecast, by Country 2020 & 2033
- Table 79: China Operating Microscope Revenue (undefined) Forecast, by Application 2020 & 2033
- Table 80: China Operating Microscope Volume (K) Forecast, by Application 2020 & 2033
- Table 81: India Operating Microscope Revenue (undefined) Forecast, by Application 2020 & 2033
- Table 82: India Operating Microscope Volume (K) Forecast, by Application 2020 & 2033
- Table 83: Japan Operating Microscope Revenue (undefined) Forecast, by Application 2020 & 2033
- Table 84: Japan Operating Microscope Volume (K) Forecast, by Application 2020 & 2033
- Table 85: South Korea Operating Microscope Revenue (undefined) Forecast, by Application 2020 & 2033
- Table 86: South Korea Operating Microscope Volume (K) Forecast, by Application 2020 & 2033
- Table 87: ASEAN Operating Microscope Revenue (undefined) Forecast, by Application 2020 & 2033
- Table 88: ASEAN Operating Microscope Volume (K) Forecast, by Application 2020 & 2033
- Table 89: Oceania Operating Microscope Revenue (undefined) Forecast, by Application 2020 & 2033
- Table 90: Oceania Operating Microscope Volume (K) Forecast, by Application 2020 & 2033
- Table 91: Rest of Asia Pacific Operating Microscope Revenue (undefined) Forecast, by Application 2020 & 2033
- Table 92: Rest of Asia Pacific Operating Microscope Volume (K) Forecast, by Application 2020 & 2033
Frequently Asked Questions
1. What is the projected Compound Annual Growth Rate (CAGR) of the Operating Microscope?
The projected CAGR is approximately 10.97%.
2. Which companies are prominent players in the Operating Microscope?
Key companies in the market include Carl Zeiss Meditec, Haag-Streit Surgical, Leica Microsystems, Life Support Systems, Takagi, Inami, Topcon Europe Medical BV, Allition (Wuzhou), Alcon, Seiler, Haag-Streit Surgical.
3. What are the main segments of the Operating Microscope?
The market segments include Application, Type.
4. Can you provide details about the market size?
The market size is estimated to be USD XXX N/A as of 2022.
5. What are some drivers contributing to market growth?
N/A
6. What are the notable trends driving market growth?
N/A
7. Are there any restraints impacting market growth?
N/A
8. Can you provide examples of recent developments in the market?
N/A
9. What pricing options are available for accessing the report?
Pricing options include single-user, multi-user, and enterprise licenses priced at USD 3950.00, USD 5925.00, and USD 7900.00 respectively.
10. Is the market size provided in terms of value or volume?
The market size is provided in terms of value, measured in N/A and volume, measured in K.
11. Are there any specific market keywords associated with the report?
Yes, the market keyword associated with the report is "Operating Microscope," which aids in identifying and referencing the specific market segment covered.
12. How do I determine which pricing option suits my needs best?
The pricing options vary based on user requirements and access needs. Individual users may opt for single-user licenses, while businesses requiring broader access may choose multi-user or enterprise licenses for cost-effective access to the report.
13. Are there any additional resources or data provided in the Operating Microscope report?
While the report offers comprehensive insights, it's advisable to review the specific contents or supplementary materials provided to ascertain if additional resources or data are available.
14. How can I stay updated on further developments or reports in the Operating Microscope?
To stay informed about further developments, trends, and reports in the Operating Microscope, consider subscribing to industry newsletters, following relevant companies and organizations, or regularly checking reputable industry news sources and publications.
Methodology
Step 1 - Identification of Relevant Samples Size from Population Database


Step 2 - Approaches for Defining Global Market Size (Value, Volume* & Price*)

Note*: In applicable scenarios
Step 3 - Data Sources
Primary Research
- Web Analytics
- Survey Reports
- Research Institute
- Latest Research Reports
- Opinion Leaders
Secondary Research
- Annual Reports
- White Paper
- Latest Press Release
- Industry Association
- Paid Database
- Investor Presentations

Step 4 - Data Triangulation
Involves using different sources of information in order to increase the validity of a study
These sources are likely to be stakeholders in a program - participants, other researchers, program staff, other community members, and so on.
Then we put all data in single framework & apply various statistical tools to find out the dynamic on the market.
During the analysis stage, feedback from the stakeholder groups would be compared to determine areas of agreement as well as areas of divergence