

Key Insights
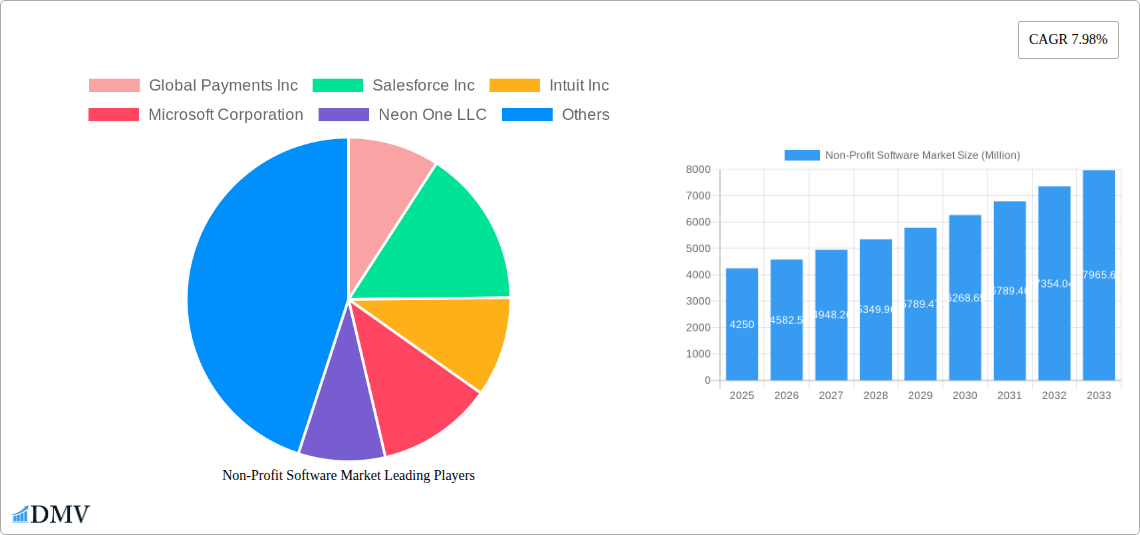
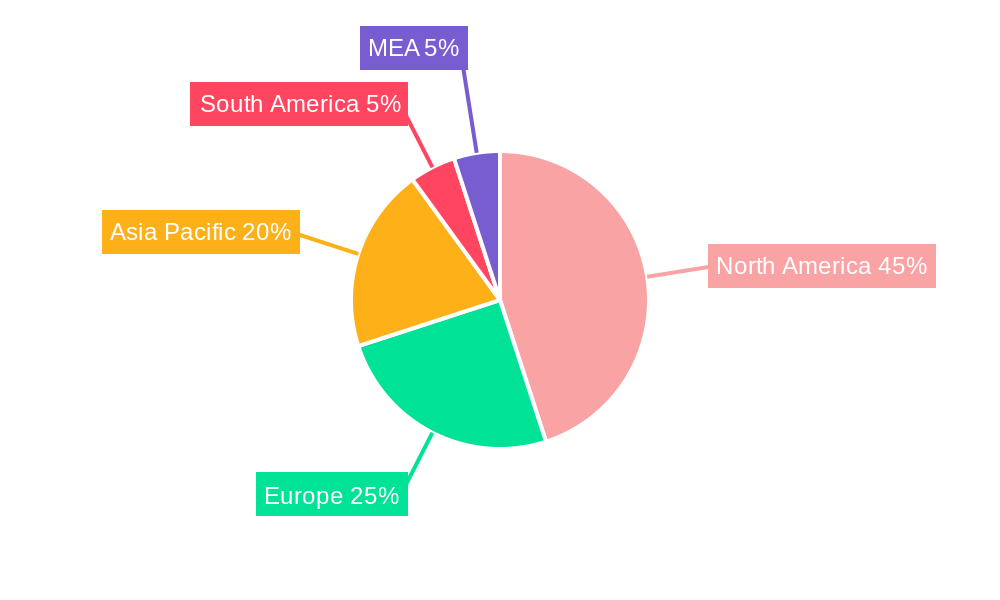
The nonprofit software market, valued at $4.25 billion in 2025, is experiencing robust growth, projected to expand at a compound annual growth rate (CAGR) of 7.98% from 2025 to 2033. This expansion is driven by several key factors. Increasing reliance on technology for efficient fundraising, donor management, and operational streamlining across non-profit organizations of all sizes is a major catalyst. The rising adoption of cloud-based solutions offers scalability, accessibility, and cost-effectiveness, further fueling market growth. Furthermore, the growing need for enhanced data analytics and reporting capabilities within the nonprofit sector is driving demand for sophisticated software solutions that provide actionable insights into donor behavior and program effectiveness. The market is segmented by deployment (on-premises vs. cloud), enterprise size (SMEs vs. large enterprises), and software type (admission-based, fundraising, marketing, volunteer management, CRM, and others), each presenting unique growth opportunities. Competitive forces are shaping the landscape, with established players like Blackbaud, Salesforce, and Microsoft alongside specialized providers like Neon One and Bloomerang vying for market share. The North American market currently holds a significant share, but growth potential in regions like Asia-Pacific and Europe is substantial, given the increasing digitalization and adoption of nonprofit software in these areas.
The market's growth trajectory is influenced by several trends. The increasing integration of artificial intelligence (AI) and machine learning (ML) into nonprofit software is improving fundraising effectiveness and donor engagement. The adoption of mobile-first strategies to enhance communication and engagement with donors is also impacting the market. However, challenges remain. Concerns around data security and privacy, the need for continuous software updates and training, and the varying technological capabilities among nonprofit organizations can potentially restrain market growth. Nevertheless, the overall outlook for the nonprofit software market remains positive, driven by the ongoing need for efficient and effective management tools within the sector. The market is expected to continue its upward trend, especially with the increasing focus on improving operational efficiency and maximizing the impact of nonprofit organizations globally.
Non-Profit Software Market: A Comprehensive Report (2019-2033)
This insightful report provides a detailed analysis of the Non-Profit Software Market, offering a comprehensive overview of its current state, future trajectory, and key players. With a study period spanning 2019-2033, a base year of 2025, and a forecast period of 2025-2033, this report is an invaluable resource for stakeholders seeking to understand and capitalize on the opportunities within this dynamic market. The market is projected to reach xx Million by 2033.
Non-Profit Software Market Composition & Trends
This section delves into the competitive landscape of the Non-Profit Software Market, examining market concentration, innovation drivers, regulatory influences, substitute products, end-user profiles, and mergers & acquisitions (M&A) activity. We analyze market share distribution amongst key players, revealing the competitive dynamics at play. The report also quantifies M&A deal values, providing insights into strategic investment trends within the sector. The market exhibits a moderately concentrated structure, with several major players commanding significant market share. Innovation is driven by the need for enhanced data analytics, improved user interfaces, and greater integration capabilities. Regulatory compliance, particularly concerning data privacy, significantly impacts market operations. The increasing availability of open-source alternatives presents a competitive challenge. End-users, primarily non-profit organizations of varying sizes and types, exhibit diverse needs and technological capabilities.
- Market Share Distribution (2024): Blackbaud: 20%; Salesforce: 15%; Global Payments: 10%; Others: 55% (estimated)
- M&A Deal Value (2019-2024): xx Million (estimated)
- Key Innovation Catalysts: Cloud computing, AI-driven analytics, mobile optimization.
- Regulatory Landscape: GDPR, CCPA, and other data privacy regulations significantly impact software development and data handling practices.
Non-Profit Software Market Industry Evolution
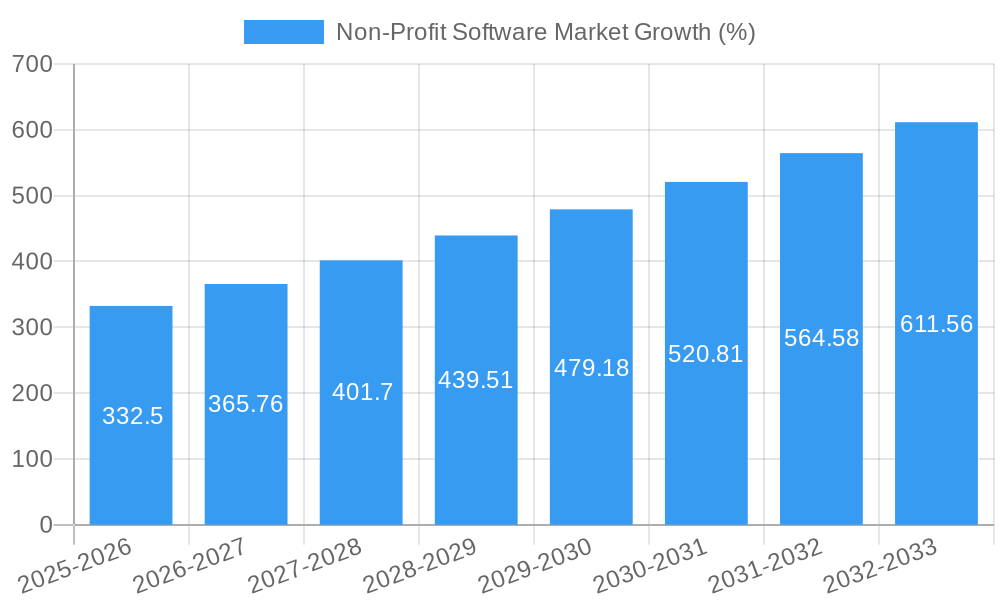
This section examines the historical and projected growth trajectory of the Non-Profit Software Market. Analyzing factors such as technological advancements, evolving consumer preferences, and market dynamics, this report details market growth rates and adoption metrics across different segments. We explore the transition from on-premise solutions to cloud-based offerings, the rising adoption of mobile-first strategies, and the increasing demand for specialized software tailored to specific non-profit functions. The market has witnessed robust growth throughout the historical period, driven by the increasing adoption of technology by non-profit organizations. The forecast period anticipates continued growth, fueled by factors such as increasing digitalization and the need for improved operational efficiency.
- CAGR (2019-2024): xx% (estimated)
- Projected CAGR (2025-2033): xx% (estimated)
- Cloud Adoption Rate (2024): xx% (estimated)
Leading Regions, Countries, or Segments in Non-Profit Software Market
This section identifies the dominant regions, countries, and segments within the Non-Profit Software Market. We analyze market performance across different deployment models (on-premise vs. cloud), enterprise sizes (SMEs vs. large enterprises), and software types (fundraising, CRM, volunteer management, etc.). The analysis explores the key drivers behind the dominance of specific regions and segments, including investment trends, regulatory support, and market maturity. The Cloud deployment model is currently the fastest-growing segment, driven by its scalability and cost-effectiveness. Large enterprises represent a significant portion of the market, owing to their greater technological capabilities and resources. Fundraising software and CRM solutions dominate the software type segment, reflecting the critical role of these applications in non-profit operations.
Dominant Region: North America
Fastest-Growing Segment (Deployment): Cloud
Largest Segment (Enterprise Size): Large Enterprises
Leading Software Type: Fundraising Software and CRM
Key Drivers for North America's Dominance: High technology adoption rate, strong regulatory framework supporting non-profits.
Key Drivers for Cloud's Growth: Scalability, cost-effectiveness, accessibility.
Key Drivers for Large Enterprise Dominance: Higher budgets, greater technological expertise.
Non-Profit Software Market Product Innovations
This section highlights recent product innovations within the non-profit software market, focusing on features, applications, and performance metrics. We examine unique selling propositions and technological advancements that differentiate market offerings, highlighting the integration of AI and machine learning capabilities to improve fundraising effectiveness, automate administrative tasks, and enhance donor engagement. New features focused on data security, user experience, and integration with existing systems are driving adoption.
Propelling Factors for Non-Profit Software Market Growth
Several factors fuel the growth of the Non-Profit Software Market. The increasing reliance on technology for efficient operations, enhanced donor management capabilities, and improved fundraising strategies are major drivers. Government initiatives and funding programs aimed at promoting digitalization within the non-profit sector further stimulate market expansion. The rising availability of affordable cloud-based solutions democratizes access to advanced software functionalities.
Obstacles in the Non-Profit Software Market
Despite the growth potential, the Non-Profit Software Market faces challenges. High upfront costs, complexity of implementation, and the need for ongoing technical support can deter adoption, particularly among smaller non-profit organizations. Integration difficulties with legacy systems and the potential for data breaches pose additional obstacles. Intense competition among established players and emerging vendors adds complexity to the market. The estimated cost of implementing a new system is xx Million.
Future Opportunities in Non-Profit Software Market
The future of the Non-Profit Software Market holds substantial opportunities. The expansion into emerging markets with increasing digital adoption rates presents a significant avenue for growth. Integration of emerging technologies like blockchain for enhanced transparency and security and the use of AI for predictive analytics will create new market opportunities. The focus on personalized donor experiences and the development of niche software solutions are other key future opportunities.
Major Players in the Non-Profit Software Market Ecosystem
- Global Payments Inc
- Salesforce Inc
- Intuit Inc
- Microsoft Corporation
- Neon One LLC
- Network For Good Inc (BONTERRA)
- Cvent Holding Corp
- WealthEngine Inc
- Faithlife LLC
- DonorSearch
- SAP SE
- Community Brands Intermediate LLC
- Blackbaud Inc
- Double the Donation
- Bloomerang LLC
Key Developments in Non-Profit Software Market Industry
- October 2023: NetForum AMS, backed by Community Brands, launched a new website (NetForumAMS.com) and streamlined implementation options for association management software.
- July 2023: Cvent unveiled Cvent Events+, enhancing event marketing strategies with video-centric engagement tools.
Strategic Non-Profit Software Market Forecast
The Non-Profit Software Market is poised for continued growth, driven by technological advancements, increasing digital adoption by non-profits, and the growing need for efficient fundraising and operational management tools. The market is expected to witness significant expansion in the forecast period, fueled by the rising adoption of cloud-based solutions and the integration of AI and machine learning capabilities. The focus on personalized donor experiences and the emergence of specialized software cater to the unique needs of the non-profit sector, further driving market growth.
Non-Profit Software Market Segmentation
-
1. Deployment
- 1.1. On Premises
- 1.2. Cloud
-
2. Enterprise Size
- 2.1. SMEs
- 2.2. Large Enterprise
-
3. Type
- 3.1. Admission-Based Nonprofit Software
- 3.2. Fund Raising Software
- 3.3. Marketing Software
- 3.4. Volunteer Management
- 3.5. CRM
- 3.6. Other Types
Non-Profit Software Market Segmentation By Geography
- 1. North America
- 2. Europe
- 3. Asia Pacific
- 4. Latin America
- 5. Middle East and Africa
Non-Profit Software Market REPORT HIGHLIGHTS
| Aspects | Details |
|---|---|
| Study Period | 2019-2033 |
| Base Year | 2024 |
| Estimated Year | 2025 |
| Forecast Period | 2025-2033 |
| Historical Period | 2019-2024 |
| Growth Rate | CAGR of 7.98% from 2019-2033 |
| Segmentation |
|
Table of Contents
- 1. Introduction
- 1.1. Research Scope
- 1.2. Market Segmentation
- 1.3. Research Methodology
- 1.4. Definitions and Assumptions
- 2. Executive Summary
- 2.1. Introduction
- 3. Market Dynamics
- 3.1. Introduction
- 3.2. Market Drivers
- 3.2.1. Growing Demand For Fund Raising Software; Rising Adoption of Automation in the Non-Profit Business
- 3.3. Market Restrains
- 3.3.1. Budget Constraints Related to Software Implementation
- 3.4. Market Trends
- 3.4.1. Fund Raising Software to Witness Major Growth
- 4. Market Factor Analysis
- 4.1. Porters Five Forces
- 4.2. Supply/Value Chain
- 4.3. PESTEL analysis
- 4.4. Market Entropy
- 4.5. Patent/Trademark Analysis
- 5. Global Non-Profit Software Market Analysis, Insights and Forecast, 2019-2031
- 5.1. Market Analysis, Insights and Forecast - by Deployment
- 5.1.1. On Premises
- 5.1.2. Cloud
- 5.2. Market Analysis, Insights and Forecast - by Enterprise Size
- 5.2.1. SMEs
- 5.2.2. Large Enterprise
- 5.3. Market Analysis, Insights and Forecast - by Type
- 5.3.1. Admission-Based Nonprofit Software
- 5.3.2. Fund Raising Software
- 5.3.3. Marketing Software
- 5.3.4. Volunteer Management
- 5.3.5. CRM
- 5.3.6. Other Types
- 5.4. Market Analysis, Insights and Forecast - by Region
- 5.4.1. North America
- 5.4.2. Europe
- 5.4.3. Asia Pacific
- 5.4.4. Latin America
- 5.4.5. Middle East and Africa
- 5.1. Market Analysis, Insights and Forecast - by Deployment
- 6. North America Non-Profit Software Market Analysis, Insights and Forecast, 2019-2031
- 6.1. Market Analysis, Insights and Forecast - by Deployment
- 6.1.1. On Premises
- 6.1.2. Cloud
- 6.2. Market Analysis, Insights and Forecast - by Enterprise Size
- 6.2.1. SMEs
- 6.2.2. Large Enterprise
- 6.3. Market Analysis, Insights and Forecast - by Type
- 6.3.1. Admission-Based Nonprofit Software
- 6.3.2. Fund Raising Software
- 6.3.3. Marketing Software
- 6.3.4. Volunteer Management
- 6.3.5. CRM
- 6.3.6. Other Types
- 6.1. Market Analysis, Insights and Forecast - by Deployment
- 7. Europe Non-Profit Software Market Analysis, Insights and Forecast, 2019-2031
- 7.1. Market Analysis, Insights and Forecast - by Deployment
- 7.1.1. On Premises
- 7.1.2. Cloud
- 7.2. Market Analysis, Insights and Forecast - by Enterprise Size
- 7.2.1. SMEs
- 7.2.2. Large Enterprise
- 7.3. Market Analysis, Insights and Forecast - by Type
- 7.3.1. Admission-Based Nonprofit Software
- 7.3.2. Fund Raising Software
- 7.3.3. Marketing Software
- 7.3.4. Volunteer Management
- 7.3.5. CRM
- 7.3.6. Other Types
- 7.1. Market Analysis, Insights and Forecast - by Deployment
- 8. Asia Pacific Non-Profit Software Market Analysis, Insights and Forecast, 2019-2031
- 8.1. Market Analysis, Insights and Forecast - by Deployment
- 8.1.1. On Premises
- 8.1.2. Cloud
- 8.2. Market Analysis, Insights and Forecast - by Enterprise Size
- 8.2.1. SMEs
- 8.2.2. Large Enterprise
- 8.3. Market Analysis, Insights and Forecast - by Type
- 8.3.1. Admission-Based Nonprofit Software
- 8.3.2. Fund Raising Software
- 8.3.3. Marketing Software
- 8.3.4. Volunteer Management
- 8.3.5. CRM
- 8.3.6. Other Types
- 8.1. Market Analysis, Insights and Forecast - by Deployment
- 9. Latin America Non-Profit Software Market Analysis, Insights and Forecast, 2019-2031
- 9.1. Market Analysis, Insights and Forecast - by Deployment
- 9.1.1. On Premises
- 9.1.2. Cloud
- 9.2. Market Analysis, Insights and Forecast - by Enterprise Size
- 9.2.1. SMEs
- 9.2.2. Large Enterprise
- 9.3. Market Analysis, Insights and Forecast - by Type
- 9.3.1. Admission-Based Nonprofit Software
- 9.3.2. Fund Raising Software
- 9.3.3. Marketing Software
- 9.3.4. Volunteer Management
- 9.3.5. CRM
- 9.3.6. Other Types
- 9.1. Market Analysis, Insights and Forecast - by Deployment
- 10. Middle East and Africa Non-Profit Software Market Analysis, Insights and Forecast, 2019-2031
- 10.1. Market Analysis, Insights and Forecast - by Deployment
- 10.1.1. On Premises
- 10.1.2. Cloud
- 10.2. Market Analysis, Insights and Forecast - by Enterprise Size
- 10.2.1. SMEs
- 10.2.2. Large Enterprise
- 10.3. Market Analysis, Insights and Forecast - by Type
- 10.3.1. Admission-Based Nonprofit Software
- 10.3.2. Fund Raising Software
- 10.3.3. Marketing Software
- 10.3.4. Volunteer Management
- 10.3.5. CRM
- 10.3.6. Other Types
- 10.1. Market Analysis, Insights and Forecast - by Deployment
- 11. North America Non-Profit Software Market Analysis, Insights and Forecast, 2019-2031
- 11.1. Market Analysis, Insights and Forecast - By Country/Sub-region
- 11.1.1 United States
- 11.1.2 Canada
- 11.1.3 Mexico
- 12. Europe Non-Profit Software Market Analysis, Insights and Forecast, 2019-2031
- 12.1. Market Analysis, Insights and Forecast - By Country/Sub-region
- 12.1.1 Germany
- 12.1.2 United Kingdom
- 12.1.3 France
- 12.1.4 Spain
- 12.1.5 Italy
- 12.1.6 Spain
- 12.1.7 Belgium
- 12.1.8 Netherland
- 12.1.9 Nordics
- 12.1.10 Rest of Europe
- 13. Asia Pacific Non-Profit Software Market Analysis, Insights and Forecast, 2019-2031
- 13.1. Market Analysis, Insights and Forecast - By Country/Sub-region
- 13.1.1 China
- 13.1.2 Japan
- 13.1.3 India
- 13.1.4 South Korea
- 13.1.5 Southeast Asia
- 13.1.6 Australia
- 13.1.7 Indonesia
- 13.1.8 Phillipes
- 13.1.9 Singapore
- 13.1.10 Thailandc
- 13.1.11 Rest of Asia Pacific
- 14. South America Non-Profit Software Market Analysis, Insights and Forecast, 2019-2031
- 14.1. Market Analysis, Insights and Forecast - By Country/Sub-region
- 14.1.1 Brazil
- 14.1.2 Argentina
- 14.1.3 Peru
- 14.1.4 Chile
- 14.1.5 Colombia
- 14.1.6 Ecuador
- 14.1.7 Venezuela
- 14.1.8 Rest of South America
- 15. North America Non-Profit Software Market Analysis, Insights and Forecast, 2019-2031
- 15.1. Market Analysis, Insights and Forecast - By Country/Sub-region
- 15.1.1 United States
- 15.1.2 Canada
- 15.1.3 Mexico
- 16. MEA Non-Profit Software Market Analysis, Insights and Forecast, 2019-2031
- 16.1. Market Analysis, Insights and Forecast - By Country/Sub-region
- 16.1.1 United Arab Emirates
- 16.1.2 Saudi Arabia
- 16.1.3 South Africa
- 16.1.4 Rest of Middle East and Africa
- 17. Competitive Analysis
- 17.1. Global Market Share Analysis 2024
- 17.2. Company Profiles
- 17.2.1 Global Payments Inc
- 17.2.1.1. Overview
- 17.2.1.2. Products
- 17.2.1.3. SWOT Analysis
- 17.2.1.4. Recent Developments
- 17.2.1.5. Financials (Based on Availability)
- 17.2.2 Salesforce Inc
- 17.2.2.1. Overview
- 17.2.2.2. Products
- 17.2.2.3. SWOT Analysis
- 17.2.2.4. Recent Developments
- 17.2.2.5. Financials (Based on Availability)
- 17.2.3 Intuit Inc
- 17.2.3.1. Overview
- 17.2.3.2. Products
- 17.2.3.3. SWOT Analysis
- 17.2.3.4. Recent Developments
- 17.2.3.5. Financials (Based on Availability)
- 17.2.4 Microsoft Corporation
- 17.2.4.1. Overview
- 17.2.4.2. Products
- 17.2.4.3. SWOT Analysis
- 17.2.4.4. Recent Developments
- 17.2.4.5. Financials (Based on Availability)
- 17.2.5 Neon One LLC
- 17.2.5.1. Overview
- 17.2.5.2. Products
- 17.2.5.3. SWOT Analysis
- 17.2.5.4. Recent Developments
- 17.2.5.5. Financials (Based on Availability)
- 17.2.6 Network For Good Inc (BONTERRA)
- 17.2.6.1. Overview
- 17.2.6.2. Products
- 17.2.6.3. SWOT Analysis
- 17.2.6.4. Recent Developments
- 17.2.6.5. Financials (Based on Availability)
- 17.2.7 Cvent Holding Corp
- 17.2.7.1. Overview
- 17.2.7.2. Products
- 17.2.7.3. SWOT Analysis
- 17.2.7.4. Recent Developments
- 17.2.7.5. Financials (Based on Availability)
- 17.2.8 WealthEngine Inc
- 17.2.8.1. Overview
- 17.2.8.2. Products
- 17.2.8.3. SWOT Analysis
- 17.2.8.4. Recent Developments
- 17.2.8.5. Financials (Based on Availability)
- 17.2.9 Faithlife LLC
- 17.2.9.1. Overview
- 17.2.9.2. Products
- 17.2.9.3. SWOT Analysis
- 17.2.9.4. Recent Developments
- 17.2.9.5. Financials (Based on Availability)
- 17.2.10 DonorSearch
- 17.2.10.1. Overview
- 17.2.10.2. Products
- 17.2.10.3. SWOT Analysis
- 17.2.10.4. Recent Developments
- 17.2.10.5. Financials (Based on Availability)
- 17.2.11 SAP SE
- 17.2.11.1. Overview
- 17.2.11.2. Products
- 17.2.11.3. SWOT Analysis
- 17.2.11.4. Recent Developments
- 17.2.11.5. Financials (Based on Availability)
- 17.2.12 Community Brands Intermediate LLC
- 17.2.12.1. Overview
- 17.2.12.2. Products
- 17.2.12.3. SWOT Analysis
- 17.2.12.4. Recent Developments
- 17.2.12.5. Financials (Based on Availability)
- 17.2.13 Blackbaud Inc
- 17.2.13.1. Overview
- 17.2.13.2. Products
- 17.2.13.3. SWOT Analysis
- 17.2.13.4. Recent Developments
- 17.2.13.5. Financials (Based on Availability)
- 17.2.14 Double the Donation
- 17.2.14.1. Overview
- 17.2.14.2. Products
- 17.2.14.3. SWOT Analysis
- 17.2.14.4. Recent Developments
- 17.2.14.5. Financials (Based on Availability)
- 17.2.15 Bloomerang LLC
- 17.2.15.1. Overview
- 17.2.15.2. Products
- 17.2.15.3. SWOT Analysis
- 17.2.15.4. Recent Developments
- 17.2.15.5. Financials (Based on Availability)
- 17.2.1 Global Payments Inc
List of Figures
- Figure 1: Global Non-Profit Software Market Revenue Breakdown (Million, %) by Region 2024 & 2032
- Figure 2: Global Non-Profit Software Market Volume Breakdown (K Unit, %) by Region 2024 & 2032
- Figure 3: North America Non-Profit Software Market Revenue (Million), by Country 2024 & 2032
- Figure 4: North America Non-Profit Software Market Volume (K Unit), by Country 2024 & 2032
- Figure 5: North America Non-Profit Software Market Revenue Share (%), by Country 2024 & 2032
- Figure 6: North America Non-Profit Software Market Volume Share (%), by Country 2024 & 2032
- Figure 7: Europe Non-Profit Software Market Revenue (Million), by Country 2024 & 2032
- Figure 8: Europe Non-Profit Software Market Volume (K Unit), by Country 2024 & 2032
- Figure 9: Europe Non-Profit Software Market Revenue Share (%), by Country 2024 & 2032
- Figure 10: Europe Non-Profit Software Market Volume Share (%), by Country 2024 & 2032
- Figure 11: Asia Pacific Non-Profit Software Market Revenue (Million), by Country 2024 & 2032
- Figure 12: Asia Pacific Non-Profit Software Market Volume (K Unit), by Country 2024 & 2032
- Figure 13: Asia Pacific Non-Profit Software Market Revenue Share (%), by Country 2024 & 2032
- Figure 14: Asia Pacific Non-Profit Software Market Volume Share (%), by Country 2024 & 2032
- Figure 15: South America Non-Profit Software Market Revenue (Million), by Country 2024 & 2032
- Figure 16: South America Non-Profit Software Market Volume (K Unit), by Country 2024 & 2032
- Figure 17: South America Non-Profit Software Market Revenue Share (%), by Country 2024 & 2032
- Figure 18: South America Non-Profit Software Market Volume Share (%), by Country 2024 & 2032
- Figure 19: North America Non-Profit Software Market Revenue (Million), by Country 2024 & 2032
- Figure 20: North America Non-Profit Software Market Volume (K Unit), by Country 2024 & 2032
- Figure 21: North America Non-Profit Software Market Revenue Share (%), by Country 2024 & 2032
- Figure 22: North America Non-Profit Software Market Volume Share (%), by Country 2024 & 2032
- Figure 23: MEA Non-Profit Software Market Revenue (Million), by Country 2024 & 2032
- Figure 24: MEA Non-Profit Software Market Volume (K Unit), by Country 2024 & 2032
- Figure 25: MEA Non-Profit Software Market Revenue Share (%), by Country 2024 & 2032
- Figure 26: MEA Non-Profit Software Market Volume Share (%), by Country 2024 & 2032
- Figure 27: North America Non-Profit Software Market Revenue (Million), by Deployment 2024 & 2032
- Figure 28: North America Non-Profit Software Market Volume (K Unit), by Deployment 2024 & 2032
- Figure 29: North America Non-Profit Software Market Revenue Share (%), by Deployment 2024 & 2032
- Figure 30: North America Non-Profit Software Market Volume Share (%), by Deployment 2024 & 2032
- Figure 31: North America Non-Profit Software Market Revenue (Million), by Enterprise Size 2024 & 2032
- Figure 32: North America Non-Profit Software Market Volume (K Unit), by Enterprise Size 2024 & 2032
- Figure 33: North America Non-Profit Software Market Revenue Share (%), by Enterprise Size 2024 & 2032
- Figure 34: North America Non-Profit Software Market Volume Share (%), by Enterprise Size 2024 & 2032
- Figure 35: North America Non-Profit Software Market Revenue (Million), by Type 2024 & 2032
- Figure 36: North America Non-Profit Software Market Volume (K Unit), by Type 2024 & 2032
- Figure 37: North America Non-Profit Software Market Revenue Share (%), by Type 2024 & 2032
- Figure 38: North America Non-Profit Software Market Volume Share (%), by Type 2024 & 2032
- Figure 39: North America Non-Profit Software Market Revenue (Million), by Country 2024 & 2032
- Figure 40: North America Non-Profit Software Market Volume (K Unit), by Country 2024 & 2032
- Figure 41: North America Non-Profit Software Market Revenue Share (%), by Country 2024 & 2032
- Figure 42: North America Non-Profit Software Market Volume Share (%), by Country 2024 & 2032
- Figure 43: Europe Non-Profit Software Market Revenue (Million), by Deployment 2024 & 2032
- Figure 44: Europe Non-Profit Software Market Volume (K Unit), by Deployment 2024 & 2032
- Figure 45: Europe Non-Profit Software Market Revenue Share (%), by Deployment 2024 & 2032
- Figure 46: Europe Non-Profit Software Market Volume Share (%), by Deployment 2024 & 2032
- Figure 47: Europe Non-Profit Software Market Revenue (Million), by Enterprise Size 2024 & 2032
- Figure 48: Europe Non-Profit Software Market Volume (K Unit), by Enterprise Size 2024 & 2032
- Figure 49: Europe Non-Profit Software Market Revenue Share (%), by Enterprise Size 2024 & 2032
- Figure 50: Europe Non-Profit Software Market Volume Share (%), by Enterprise Size 2024 & 2032
- Figure 51: Europe Non-Profit Software Market Revenue (Million), by Type 2024 & 2032
- Figure 52: Europe Non-Profit Software Market Volume (K Unit), by Type 2024 & 2032
- Figure 53: Europe Non-Profit Software Market Revenue Share (%), by Type 2024 & 2032
- Figure 54: Europe Non-Profit Software Market Volume Share (%), by Type 2024 & 2032
- Figure 55: Europe Non-Profit Software Market Revenue (Million), by Country 2024 & 2032
- Figure 56: Europe Non-Profit Software Market Volume (K Unit), by Country 2024 & 2032
- Figure 57: Europe Non-Profit Software Market Revenue Share (%), by Country 2024 & 2032
- Figure 58: Europe Non-Profit Software Market Volume Share (%), by Country 2024 & 2032
- Figure 59: Asia Pacific Non-Profit Software Market Revenue (Million), by Deployment 2024 & 2032
- Figure 60: Asia Pacific Non-Profit Software Market Volume (K Unit), by Deployment 2024 & 2032
- Figure 61: Asia Pacific Non-Profit Software Market Revenue Share (%), by Deployment 2024 & 2032
- Figure 62: Asia Pacific Non-Profit Software Market Volume Share (%), by Deployment 2024 & 2032
- Figure 63: Asia Pacific Non-Profit Software Market Revenue (Million), by Enterprise Size 2024 & 2032
- Figure 64: Asia Pacific Non-Profit Software Market Volume (K Unit), by Enterprise Size 2024 & 2032
- Figure 65: Asia Pacific Non-Profit Software Market Revenue Share (%), by Enterprise Size 2024 & 2032
- Figure 66: Asia Pacific Non-Profit Software Market Volume Share (%), by Enterprise Size 2024 & 2032
- Figure 67: Asia Pacific Non-Profit Software Market Revenue (Million), by Type 2024 & 2032
- Figure 68: Asia Pacific Non-Profit Software Market Volume (K Unit), by Type 2024 & 2032
- Figure 69: Asia Pacific Non-Profit Software Market Revenue Share (%), by Type 2024 & 2032
- Figure 70: Asia Pacific Non-Profit Software Market Volume Share (%), by Type 2024 & 2032
- Figure 71: Asia Pacific Non-Profit Software Market Revenue (Million), by Country 2024 & 2032
- Figure 72: Asia Pacific Non-Profit Software Market Volume (K Unit), by Country 2024 & 2032
- Figure 73: Asia Pacific Non-Profit Software Market Revenue Share (%), by Country 2024 & 2032
- Figure 74: Asia Pacific Non-Profit Software Market Volume Share (%), by Country 2024 & 2032
- Figure 75: Latin America Non-Profit Software Market Revenue (Million), by Deployment 2024 & 2032
- Figure 76: Latin America Non-Profit Software Market Volume (K Unit), by Deployment 2024 & 2032
- Figure 77: Latin America Non-Profit Software Market Revenue Share (%), by Deployment 2024 & 2032
- Figure 78: Latin America Non-Profit Software Market Volume Share (%), by Deployment 2024 & 2032
- Figure 79: Latin America Non-Profit Software Market Revenue (Million), by Enterprise Size 2024 & 2032
- Figure 80: Latin America Non-Profit Software Market Volume (K Unit), by Enterprise Size 2024 & 2032
- Figure 81: Latin America Non-Profit Software Market Revenue Share (%), by Enterprise Size 2024 & 2032
- Figure 82: Latin America Non-Profit Software Market Volume Share (%), by Enterprise Size 2024 & 2032
- Figure 83: Latin America Non-Profit Software Market Revenue (Million), by Type 2024 & 2032
- Figure 84: Latin America Non-Profit Software Market Volume (K Unit), by Type 2024 & 2032
- Figure 85: Latin America Non-Profit Software Market Revenue Share (%), by Type 2024 & 2032
- Figure 86: Latin America Non-Profit Software Market Volume Share (%), by Type 2024 & 2032
- Figure 87: Latin America Non-Profit Software Market Revenue (Million), by Country 2024 & 2032
- Figure 88: Latin America Non-Profit Software Market Volume (K Unit), by Country 2024 & 2032
- Figure 89: Latin America Non-Profit Software Market Revenue Share (%), by Country 2024 & 2032
- Figure 90: Latin America Non-Profit Software Market Volume Share (%), by Country 2024 & 2032
- Figure 91: Middle East and Africa Non-Profit Software Market Revenue (Million), by Deployment 2024 & 2032
- Figure 92: Middle East and Africa Non-Profit Software Market Volume (K Unit), by Deployment 2024 & 2032
- Figure 93: Middle East and Africa Non-Profit Software Market Revenue Share (%), by Deployment 2024 & 2032
- Figure 94: Middle East and Africa Non-Profit Software Market Volume Share (%), by Deployment 2024 & 2032
- Figure 95: Middle East and Africa Non-Profit Software Market Revenue (Million), by Enterprise Size 2024 & 2032
- Figure 96: Middle East and Africa Non-Profit Software Market Volume (K Unit), by Enterprise Size 2024 & 2032
- Figure 97: Middle East and Africa Non-Profit Software Market Revenue Share (%), by Enterprise Size 2024 & 2032
- Figure 98: Middle East and Africa Non-Profit Software Market Volume Share (%), by Enterprise Size 2024 & 2032
- Figure 99: Middle East and Africa Non-Profit Software Market Revenue (Million), by Type 2024 & 2032
- Figure 100: Middle East and Africa Non-Profit Software Market Volume (K Unit), by Type 2024 & 2032
- Figure 101: Middle East and Africa Non-Profit Software Market Revenue Share (%), by Type 2024 & 2032
- Figure 102: Middle East and Africa Non-Profit Software Market Volume Share (%), by Type 2024 & 2032
- Figure 103: Middle East and Africa Non-Profit Software Market Revenue (Million), by Country 2024 & 2032
- Figure 104: Middle East and Africa Non-Profit Software Market Volume (K Unit), by Country 2024 & 2032
- Figure 105: Middle East and Africa Non-Profit Software Market Revenue Share (%), by Country 2024 & 2032
- Figure 106: Middle East and Africa Non-Profit Software Market Volume Share (%), by Country 2024 & 2032
List of Tables
- Table 1: Global Non-Profit Software Market Revenue Million Forecast, by Region 2019 & 2032
- Table 2: Global Non-Profit Software Market Volume K Unit Forecast, by Region 2019 & 2032
- Table 3: Global Non-Profit Software Market Revenue Million Forecast, by Deployment 2019 & 2032
- Table 4: Global Non-Profit Software Market Volume K Unit Forecast, by Deployment 2019 & 2032
- Table 5: Global Non-Profit Software Market Revenue Million Forecast, by Enterprise Size 2019 & 2032
- Table 6: Global Non-Profit Software Market Volume K Unit Forecast, by Enterprise Size 2019 & 2032
- Table 7: Global Non-Profit Software Market Revenue Million Forecast, by Type 2019 & 2032
- Table 8: Global Non-Profit Software Market Volume K Unit Forecast, by Type 2019 & 2032
- Table 9: Global Non-Profit Software Market Revenue Million Forecast, by Region 2019 & 2032
- Table 10: Global Non-Profit Software Market Volume K Unit Forecast, by Region 2019 & 2032
- Table 11: Global Non-Profit Software Market Revenue Million Forecast, by Country 2019 & 2032
- Table 12: Global Non-Profit Software Market Volume K Unit Forecast, by Country 2019 & 2032
- Table 13: United States Non-Profit Software Market Revenue (Million) Forecast, by Application 2019 & 2032
- Table 14: United States Non-Profit Software Market Volume (K Unit) Forecast, by Application 2019 & 2032
- Table 15: Canada Non-Profit Software Market Revenue (Million) Forecast, by Application 2019 & 2032
- Table 16: Canada Non-Profit Software Market Volume (K Unit) Forecast, by Application 2019 & 2032
- Table 17: Mexico Non-Profit Software Market Revenue (Million) Forecast, by Application 2019 & 2032
- Table 18: Mexico Non-Profit Software Market Volume (K Unit) Forecast, by Application 2019 & 2032
- Table 19: Global Non-Profit Software Market Revenue Million Forecast, by Country 2019 & 2032
- Table 20: Global Non-Profit Software Market Volume K Unit Forecast, by Country 2019 & 2032
- Table 21: Germany Non-Profit Software Market Revenue (Million) Forecast, by Application 2019 & 2032
- Table 22: Germany Non-Profit Software Market Volume (K Unit) Forecast, by Application 2019 & 2032
- Table 23: United Kingdom Non-Profit Software Market Revenue (Million) Forecast, by Application 2019 & 2032
- Table 24: United Kingdom Non-Profit Software Market Volume (K Unit) Forecast, by Application 2019 & 2032
- Table 25: France Non-Profit Software Market Revenue (Million) Forecast, by Application 2019 & 2032
- Table 26: France Non-Profit Software Market Volume (K Unit) Forecast, by Application 2019 & 2032
- Table 27: Spain Non-Profit Software Market Revenue (Million) Forecast, by Application 2019 & 2032
- Table 28: Spain Non-Profit Software Market Volume (K Unit) Forecast, by Application 2019 & 2032
- Table 29: Italy Non-Profit Software Market Revenue (Million) Forecast, by Application 2019 & 2032
- Table 30: Italy Non-Profit Software Market Volume (K Unit) Forecast, by Application 2019 & 2032
- Table 31: Spain Non-Profit Software Market Revenue (Million) Forecast, by Application 2019 & 2032
- Table 32: Spain Non-Profit Software Market Volume (K Unit) Forecast, by Application 2019 & 2032
- Table 33: Belgium Non-Profit Software Market Revenue (Million) Forecast, by Application 2019 & 2032
- Table 34: Belgium Non-Profit Software Market Volume (K Unit) Forecast, by Application 2019 & 2032
- Table 35: Netherland Non-Profit Software Market Revenue (Million) Forecast, by Application 2019 & 2032
- Table 36: Netherland Non-Profit Software Market Volume (K Unit) Forecast, by Application 2019 & 2032
- Table 37: Nordics Non-Profit Software Market Revenue (Million) Forecast, by Application 2019 & 2032
- Table 38: Nordics Non-Profit Software Market Volume (K Unit) Forecast, by Application 2019 & 2032
- Table 39: Rest of Europe Non-Profit Software Market Revenue (Million) Forecast, by Application 2019 & 2032
- Table 40: Rest of Europe Non-Profit Software Market Volume (K Unit) Forecast, by Application 2019 & 2032
- Table 41: Global Non-Profit Software Market Revenue Million Forecast, by Country 2019 & 2032
- Table 42: Global Non-Profit Software Market Volume K Unit Forecast, by Country 2019 & 2032
- Table 43: China Non-Profit Software Market Revenue (Million) Forecast, by Application 2019 & 2032
- Table 44: China Non-Profit Software Market Volume (K Unit) Forecast, by Application 2019 & 2032
- Table 45: Japan Non-Profit Software Market Revenue (Million) Forecast, by Application 2019 & 2032
- Table 46: Japan Non-Profit Software Market Volume (K Unit) Forecast, by Application 2019 & 2032
- Table 47: India Non-Profit Software Market Revenue (Million) Forecast, by Application 2019 & 2032
- Table 48: India Non-Profit Software Market Volume (K Unit) Forecast, by Application 2019 & 2032
- Table 49: South Korea Non-Profit Software Market Revenue (Million) Forecast, by Application 2019 & 2032
- Table 50: South Korea Non-Profit Software Market Volume (K Unit) Forecast, by Application 2019 & 2032
- Table 51: Southeast Asia Non-Profit Software Market Revenue (Million) Forecast, by Application 2019 & 2032
- Table 52: Southeast Asia Non-Profit Software Market Volume (K Unit) Forecast, by Application 2019 & 2032
- Table 53: Australia Non-Profit Software Market Revenue (Million) Forecast, by Application 2019 & 2032
- Table 54: Australia Non-Profit Software Market Volume (K Unit) Forecast, by Application 2019 & 2032
- Table 55: Indonesia Non-Profit Software Market Revenue (Million) Forecast, by Application 2019 & 2032
- Table 56: Indonesia Non-Profit Software Market Volume (K Unit) Forecast, by Application 2019 & 2032
- Table 57: Phillipes Non-Profit Software Market Revenue (Million) Forecast, by Application 2019 & 2032
- Table 58: Phillipes Non-Profit Software Market Volume (K Unit) Forecast, by Application 2019 & 2032
- Table 59: Singapore Non-Profit Software Market Revenue (Million) Forecast, by Application 2019 & 2032
- Table 60: Singapore Non-Profit Software Market Volume (K Unit) Forecast, by Application 2019 & 2032
- Table 61: Thailandc Non-Profit Software Market Revenue (Million) Forecast, by Application 2019 & 2032
- Table 62: Thailandc Non-Profit Software Market Volume (K Unit) Forecast, by Application 2019 & 2032
- Table 63: Rest of Asia Pacific Non-Profit Software Market Revenue (Million) Forecast, by Application 2019 & 2032
- Table 64: Rest of Asia Pacific Non-Profit Software Market Volume (K Unit) Forecast, by Application 2019 & 2032
- Table 65: Global Non-Profit Software Market Revenue Million Forecast, by Country 2019 & 2032
- Table 66: Global Non-Profit Software Market Volume K Unit Forecast, by Country 2019 & 2032
- Table 67: Brazil Non-Profit Software Market Revenue (Million) Forecast, by Application 2019 & 2032
- Table 68: Brazil Non-Profit Software Market Volume (K Unit) Forecast, by Application 2019 & 2032
- Table 69: Argentina Non-Profit Software Market Revenue (Million) Forecast, by Application 2019 & 2032
- Table 70: Argentina Non-Profit Software Market Volume (K Unit) Forecast, by Application 2019 & 2032
- Table 71: Peru Non-Profit Software Market Revenue (Million) Forecast, by Application 2019 & 2032
- Table 72: Peru Non-Profit Software Market Volume (K Unit) Forecast, by Application 2019 & 2032
- Table 73: Chile Non-Profit Software Market Revenue (Million) Forecast, by Application 2019 & 2032
- Table 74: Chile Non-Profit Software Market Volume (K Unit) Forecast, by Application 2019 & 2032
- Table 75: Colombia Non-Profit Software Market Revenue (Million) Forecast, by Application 2019 & 2032
- Table 76: Colombia Non-Profit Software Market Volume (K Unit) Forecast, by Application 2019 & 2032
- Table 77: Ecuador Non-Profit Software Market Revenue (Million) Forecast, by Application 2019 & 2032
- Table 78: Ecuador Non-Profit Software Market Volume (K Unit) Forecast, by Application 2019 & 2032
- Table 79: Venezuela Non-Profit Software Market Revenue (Million) Forecast, by Application 2019 & 2032
- Table 80: Venezuela Non-Profit Software Market Volume (K Unit) Forecast, by Application 2019 & 2032
- Table 81: Rest of South America Non-Profit Software Market Revenue (Million) Forecast, by Application 2019 & 2032
- Table 82: Rest of South America Non-Profit Software Market Volume (K Unit) Forecast, by Application 2019 & 2032
- Table 83: Global Non-Profit Software Market Revenue Million Forecast, by Country 2019 & 2032
- Table 84: Global Non-Profit Software Market Volume K Unit Forecast, by Country 2019 & 2032
- Table 85: United States Non-Profit Software Market Revenue (Million) Forecast, by Application 2019 & 2032
- Table 86: United States Non-Profit Software Market Volume (K Unit) Forecast, by Application 2019 & 2032
- Table 87: Canada Non-Profit Software Market Revenue (Million) Forecast, by Application 2019 & 2032
- Table 88: Canada Non-Profit Software Market Volume (K Unit) Forecast, by Application 2019 & 2032
- Table 89: Mexico Non-Profit Software Market Revenue (Million) Forecast, by Application 2019 & 2032
- Table 90: Mexico Non-Profit Software Market Volume (K Unit) Forecast, by Application 2019 & 2032
- Table 91: Global Non-Profit Software Market Revenue Million Forecast, by Country 2019 & 2032
- Table 92: Global Non-Profit Software Market Volume K Unit Forecast, by Country 2019 & 2032
- Table 93: United Arab Emirates Non-Profit Software Market Revenue (Million) Forecast, by Application 2019 & 2032
- Table 94: United Arab Emirates Non-Profit Software Market Volume (K Unit) Forecast, by Application 2019 & 2032
- Table 95: Saudi Arabia Non-Profit Software Market Revenue (Million) Forecast, by Application 2019 & 2032
- Table 96: Saudi Arabia Non-Profit Software Market Volume (K Unit) Forecast, by Application 2019 & 2032
- Table 97: South Africa Non-Profit Software Market Revenue (Million) Forecast, by Application 2019 & 2032
- Table 98: South Africa Non-Profit Software Market Volume (K Unit) Forecast, by Application 2019 & 2032
- Table 99: Rest of Middle East and Africa Non-Profit Software Market Revenue (Million) Forecast, by Application 2019 & 2032
- Table 100: Rest of Middle East and Africa Non-Profit Software Market Volume (K Unit) Forecast, by Application 2019 & 2032
- Table 101: Global Non-Profit Software Market Revenue Million Forecast, by Deployment 2019 & 2032
- Table 102: Global Non-Profit Software Market Volume K Unit Forecast, by Deployment 2019 & 2032
- Table 103: Global Non-Profit Software Market Revenue Million Forecast, by Enterprise Size 2019 & 2032
- Table 104: Global Non-Profit Software Market Volume K Unit Forecast, by Enterprise Size 2019 & 2032
- Table 105: Global Non-Profit Software Market Revenue Million Forecast, by Type 2019 & 2032
- Table 106: Global Non-Profit Software Market Volume K Unit Forecast, by Type 2019 & 2032
- Table 107: Global Non-Profit Software Market Revenue Million Forecast, by Country 2019 & 2032
- Table 108: Global Non-Profit Software Market Volume K Unit Forecast, by Country 2019 & 2032
- Table 109: Global Non-Profit Software Market Revenue Million Forecast, by Deployment 2019 & 2032
- Table 110: Global Non-Profit Software Market Volume K Unit Forecast, by Deployment 2019 & 2032
- Table 111: Global Non-Profit Software Market Revenue Million Forecast, by Enterprise Size 2019 & 2032
- Table 112: Global Non-Profit Software Market Volume K Unit Forecast, by Enterprise Size 2019 & 2032
- Table 113: Global Non-Profit Software Market Revenue Million Forecast, by Type 2019 & 2032
- Table 114: Global Non-Profit Software Market Volume K Unit Forecast, by Type 2019 & 2032
- Table 115: Global Non-Profit Software Market Revenue Million Forecast, by Country 2019 & 2032
- Table 116: Global Non-Profit Software Market Volume K Unit Forecast, by Country 2019 & 2032
- Table 117: Global Non-Profit Software Market Revenue Million Forecast, by Deployment 2019 & 2032
- Table 118: Global Non-Profit Software Market Volume K Unit Forecast, by Deployment 2019 & 2032
- Table 119: Global Non-Profit Software Market Revenue Million Forecast, by Enterprise Size 2019 & 2032
- Table 120: Global Non-Profit Software Market Volume K Unit Forecast, by Enterprise Size 2019 & 2032
- Table 121: Global Non-Profit Software Market Revenue Million Forecast, by Type 2019 & 2032
- Table 122: Global Non-Profit Software Market Volume K Unit Forecast, by Type 2019 & 2032
- Table 123: Global Non-Profit Software Market Revenue Million Forecast, by Country 2019 & 2032
- Table 124: Global Non-Profit Software Market Volume K Unit Forecast, by Country 2019 & 2032
- Table 125: Global Non-Profit Software Market Revenue Million Forecast, by Deployment 2019 & 2032
- Table 126: Global Non-Profit Software Market Volume K Unit Forecast, by Deployment 2019 & 2032
- Table 127: Global Non-Profit Software Market Revenue Million Forecast, by Enterprise Size 2019 & 2032
- Table 128: Global Non-Profit Software Market Volume K Unit Forecast, by Enterprise Size 2019 & 2032
- Table 129: Global Non-Profit Software Market Revenue Million Forecast, by Type 2019 & 2032
- Table 130: Global Non-Profit Software Market Volume K Unit Forecast, by Type 2019 & 2032
- Table 131: Global Non-Profit Software Market Revenue Million Forecast, by Country 2019 & 2032
- Table 132: Global Non-Profit Software Market Volume K Unit Forecast, by Country 2019 & 2032
- Table 133: Global Non-Profit Software Market Revenue Million Forecast, by Deployment 2019 & 2032
- Table 134: Global Non-Profit Software Market Volume K Unit Forecast, by Deployment 2019 & 2032
- Table 135: Global Non-Profit Software Market Revenue Million Forecast, by Enterprise Size 2019 & 2032
- Table 136: Global Non-Profit Software Market Volume K Unit Forecast, by Enterprise Size 2019 & 2032
- Table 137: Global Non-Profit Software Market Revenue Million Forecast, by Type 2019 & 2032
- Table 138: Global Non-Profit Software Market Volume K Unit Forecast, by Type 2019 & 2032
- Table 139: Global Non-Profit Software Market Revenue Million Forecast, by Country 2019 & 2032
- Table 140: Global Non-Profit Software Market Volume K Unit Forecast, by Country 2019 & 2032
Frequently Asked Questions
1. What is the projected Compound Annual Growth Rate (CAGR) of the Non-Profit Software Market?
The projected CAGR is approximately 7.98%.
2. Which companies are prominent players in the Non-Profit Software Market?
Key companies in the market include Global Payments Inc, Salesforce Inc, Intuit Inc, Microsoft Corporation, Neon One LLC, Network For Good Inc (BONTERRA), Cvent Holding Corp, WealthEngine Inc, Faithlife LLC, DonorSearch, SAP SE, Community Brands Intermediate LLC, Blackbaud Inc, Double the Donation, Bloomerang LLC.
3. What are the main segments of the Non-Profit Software Market?
The market segments include Deployment, Enterprise Size, Type.
4. Can you provide details about the market size?
The market size is estimated to be USD 4.25 Million as of 2022.
5. What are some drivers contributing to market growth?
Growing Demand For Fund Raising Software; Rising Adoption of Automation in the Non-Profit Business.
6. What are the notable trends driving market growth?
Fund Raising Software to Witness Major Growth.
7. Are there any restraints impacting market growth?
Budget Constraints Related to Software Implementation.
8. Can you provide examples of recent developments in the market?
October 2023 - NetForum AMS, backed by Community Brands, revealed a new website to serve associations with comprehensive association management software (AMS) and added implementation options. The shift is reflected with a URL change to NetForumAMS.com and will help associations implement the AMS system quickly without heavy customization. NetForum supports midmarket to enterprise-level associations and non-profits with a robust association management system tailored for the budgets or time constraints facing mid-to-large organizations.
9. What pricing options are available for accessing the report?
Pricing options include single-user, multi-user, and enterprise licenses priced at USD 4750, USD 5250, and USD 8750 respectively.
10. Is the market size provided in terms of value or volume?
The market size is provided in terms of value, measured in Million and volume, measured in K Unit.
11. Are there any specific market keywords associated with the report?
Yes, the market keyword associated with the report is "Non-Profit Software Market," which aids in identifying and referencing the specific market segment covered.
12. How do I determine which pricing option suits my needs best?
The pricing options vary based on user requirements and access needs. Individual users may opt for single-user licenses, while businesses requiring broader access may choose multi-user or enterprise licenses for cost-effective access to the report.
13. Are there any additional resources or data provided in the Non-Profit Software Market report?
While the report offers comprehensive insights, it's advisable to review the specific contents or supplementary materials provided to ascertain if additional resources or data are available.
14. How can I stay updated on further developments or reports in the Non-Profit Software Market?
To stay informed about further developments, trends, and reports in the Non-Profit Software Market, consider subscribing to industry newsletters, following relevant companies and organizations, or regularly checking reputable industry news sources and publications.
Methodology
Step 1 - Identification of Relevant Samples Size from Population Database


Step 2 - Approaches for Defining Global Market Size (Value, Volume* & Price*)

Note*: In applicable scenarios
Step 3 - Data Sources
Primary Research
- Web Analytics
- Survey Reports
- Research Institute
- Latest Research Reports
- Opinion Leaders
Secondary Research
- Annual Reports
- White Paper
- Latest Press Release
- Industry Association
- Paid Database
- Investor Presentations

Step 4 - Data Triangulation
Involves using different sources of information in order to increase the validity of a study
These sources are likely to be stakeholders in a program - participants, other researchers, program staff, other community members, and so on.
Then we put all data in single framework & apply various statistical tools to find out the dynamic on the market.
During the analysis stage, feedback from the stakeholder groups would be compared to determine areas of agreement as well as areas of divergence
