

Key Insights
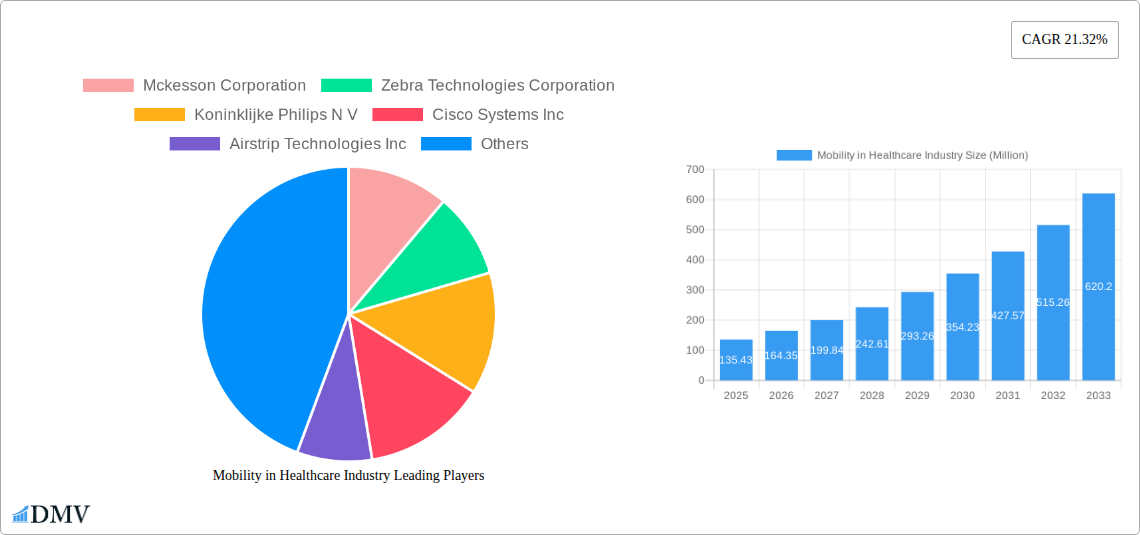
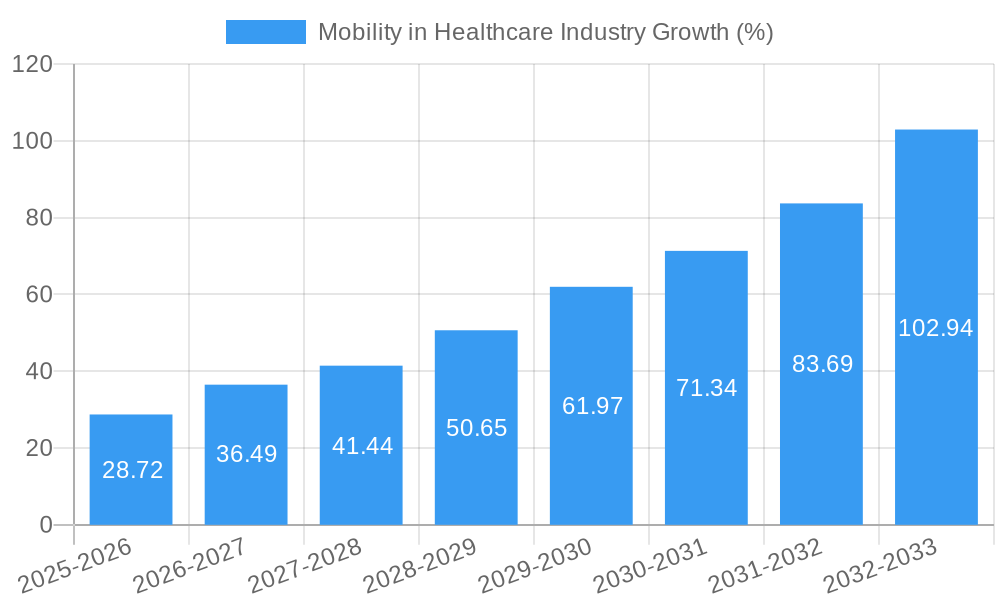
The global mobility in healthcare market, valued at $135.43 million in 2025, is experiencing robust growth, projected to expand significantly over the forecast period (2025-2033). A compound annual growth rate (CAGR) of 21.32% indicates a rapidly evolving landscape driven by several key factors. The increasing adoption of mobile health (mHealth) applications for remote patient monitoring, telehealth consultations, and chronic disease management is a primary driver. Furthermore, the rising demand for efficient workforce management solutions, including mobile-based scheduling and communication tools, is fueling market expansion. Enterprise mobility platforms are also gaining traction, enabling seamless data exchange and improved operational efficiency across healthcare organizations. Technological advancements, such as the development of 5G networks and improved mobile device capabilities, further contribute to this growth. While data security and privacy concerns represent a potential restraint, the overall market outlook remains positive, driven by the increasing focus on patient-centric care and the growing need for cost-effective healthcare delivery solutions.
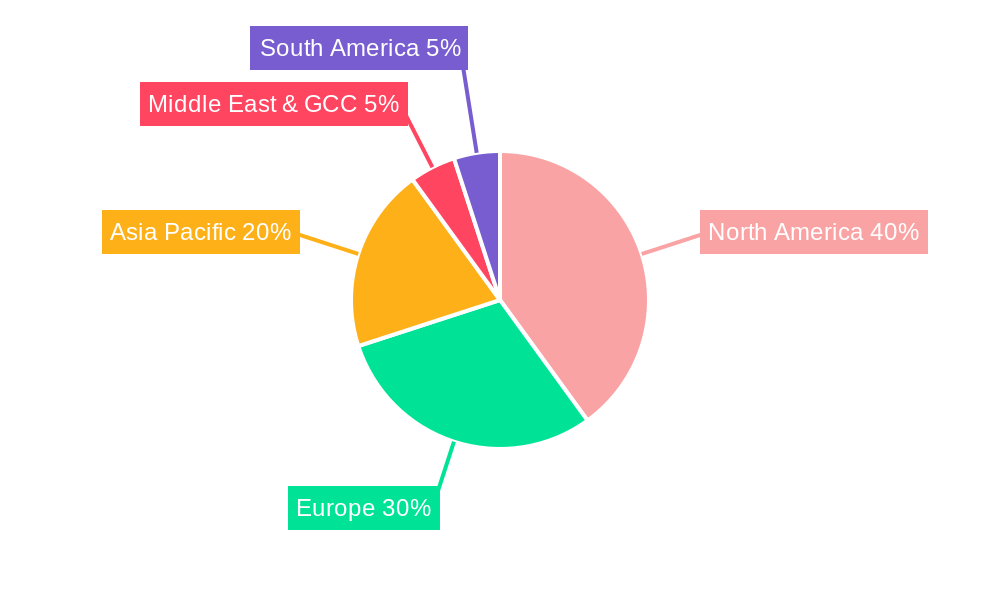
Market segmentation reveals a diverse landscape with significant opportunities across various product and service categories. Enterprise mobility platforms offer integrated solutions for managing mobile devices and applications within healthcare organizations. Mobile applications cater to diverse needs, ranging from patient engagement tools to clinical decision support systems. The application segment shows strong growth potential, driven by increasing demand for mHealth apps. Workforce management solutions focusing on mobile technologies are streamlining operations and improving healthcare professional productivity. Finally, the end-user segment, comprising payers, providers, and patients, demonstrates the broad reach of mobility solutions across the healthcare ecosystem. Geographical analysis indicates strong growth in North America and Europe, but emerging markets in Asia-Pacific and the Middle East are also experiencing increasing adoption rates, further contributing to the overall market expansion. Leading players like McKesson, Zebra Technologies, Philips, Cisco, and others are actively shaping the market through innovation and strategic partnerships.
Mobility in Healthcare Industry: A Comprehensive Market Report (2019-2033)
This insightful report provides a comprehensive analysis of the Mobility in Healthcare Industry market, offering a detailed examination of its current state, future trajectory, and key players. Valued at $XX Million in 2025, the market is projected to reach $XX Million by 2033, exhibiting a robust Compound Annual Growth Rate (CAGR) of XX% during the forecast period (2025-2033). The study covers the historical period (2019-2024) and utilizes 2025 as its base year. This report is essential for stakeholders seeking to understand the dynamic landscape of this rapidly evolving sector.
Mobility in Healthcare Industry Market Composition & Trends
The Mobility in Healthcare Industry market is characterized by moderate concentration, with key players like McKesson Corporation, Zebra Technologies Corporation, Koninklijke Philips N.V., and Cisco Systems Inc. holding significant market share. However, the market also features numerous smaller, specialized companies, contributing to a dynamic competitive landscape. Innovation is driven by the need for improved patient care, operational efficiency, and data-driven decision-making. Stringent regulatory frameworks, particularly concerning data privacy (HIPAA, GDPR), significantly impact market dynamics. Substitute products, such as traditional communication methods, are gradually being replaced by mobile solutions, indicating market growth. Mergers and acquisitions (M&A) activities are frequent, with deal values exceeding $XX Million in recent years, driving market consolidation.
- Market Share Distribution (2025): McKesson Corporation (XX%), Zebra Technologies Corporation (XX%), Koninklijke Philips N.V. (XX%), Others (XX%).
- M&A Activity (2019-2024): Total deal value exceeding $XX Million, with an average deal size of $XX Million.
- Key Regulatory Factors: HIPAA compliance, GDPR, local data privacy regulations.
- End-User Profile: Payers, providers (hospitals, clinics), and patients.
Mobility in Healthcare Industry Industry Evolution
The Mobility in Healthcare Industry has witnessed exponential growth, driven by technological advancements, increasing smartphone penetration, and the growing demand for remote healthcare services. The market has evolved from basic mobile devices for communication to sophisticated enterprise mobility platforms supporting complex clinical workflows. The integration of artificial intelligence (AI), Internet of Things (IoT), and cloud computing has further propelled this evolution. The adoption of mHealth applications for chronic disease management and telehealth consultations has seen remarkable growth, particularly among older populations and patients in remote areas. Consumer demands for personalized, convenient, and accessible healthcare are central to this evolution. Growth is largely attributed to rising adoption rates across all end-user segments.
Leading Regions, Countries, or Segments in Mobility in Healthcare Industry
North America currently dominates the Mobility in Healthcare Industry, driven by high technology adoption rates, substantial investments in healthcare IT, and well-established regulatory frameworks. However, regions like Europe and Asia-Pacific are experiencing rapid growth. Within segments:
- Dominant Segment: Enterprise Mobility Platforms, driven by the need for integrated solutions across healthcare organizations.
- Fastest Growing Segment: mHealth Applications, fueled by the rising adoption of telehealth and remote patient monitoring.
- Key Drivers:
- North America: High healthcare spending, advanced technology infrastructure, strong regulatory support.
- Europe: Increasing focus on digital health initiatives, strong government funding.
- Asia-Pacific: Expanding healthcare infrastructure, growing smartphone penetration.
Mobility in Healthcare Industry Product Innovations
Recent innovations include the development of advanced mobile EHR systems, AI-powered diagnostic tools, and secure messaging platforms for improved patient-provider communication. These innovations offer improved usability, enhanced data security, and streamlined workflows. Unique selling propositions include features like voice-activated functionalities (as seen in athenahealth's launch), real-time data analytics, and integration with wearable devices for remote patient monitoring. These advancements significantly enhance efficiency and the quality of care.
Propelling Factors for Mobility in Healthcare Industry Growth
The market is propelled by technological advancements such as 5G connectivity, AI, and cloud computing, enabling seamless data exchange and real-time insights. Economically, increasing healthcare spending and the shift toward value-based care create demand for efficient, cost-effective solutions. Regulatory support for telehealth and remote patient monitoring further stimulates market expansion. For example, the Indonesian Health Ministry's launch of the Indonesia Health Services platform exemplifies government initiatives driving adoption.
Obstacles in the Mobility in Healthcare Industry Market
Significant barriers include stringent regulatory compliance requirements, potential supply chain disruptions impacting device availability, and intense competition from established players and emerging startups. Data security concerns and the need for robust cybersecurity measures also pose challenges. These factors can impact market penetration and profitability.
Future Opportunities in Mobility in Healthcare Industry
Emerging opportunities include the expansion into untapped markets in developing economies, the integration of blockchain technology for enhanced data security and interoperability, and the development of innovative solutions for chronic disease management. Growing demand for personalized medicine and precision healthcare will also drive future growth.
Major Players in the Mobility in Healthcare Industry Ecosystem
- Mckesson Corporation
- Zebra Technologies Corporation
- Koninklijke Philips N.V.
- Cisco Systems Inc
- Airstrip Technologies Inc
- Omron Corporation
- At&T Inc
- SAP SE
- Oracle Cerner
Key Developments in Mobility in Healthcare Industry Industry
- August 2022: Indonesia's Health Ministry launched the Indonesia Health Services platform, accelerating digital transformation in the country's healthcare system.
- June 2022: athenahealth, Inc. launched athenaOne Voice Assistant, enhancing provider efficiency and streamlining clinical workflows through voice-activated EHR access.
Strategic Mobility in Healthcare Industry Market Forecast
The Mobility in Healthcare Industry is poised for continued robust growth, driven by technological innovations, increasing demand for remote healthcare services, and supportive regulatory environments. The market's potential is substantial, particularly in developing economies and with the integration of emerging technologies. Opportunities abound for companies to capitalize on this expanding market by developing innovative, user-friendly, and secure mobile healthcare solutions.
Mobility in Healthcare Industry Segmentation
-
1. Products and Services
- 1.1. Enterprise Mobility Platforms
- 1.2. Mobile Applications (Apps)
- 1.3. Mobile Devices
-
2. Application
-
2.1. Enterprise Solutions
- 2.1.1. Operation Management
- 2.1.2. Patient Care Management
- 2.1.3. Work Force Management
- 2.2. mHealth Applications
-
2.1. Enterprise Solutions
-
3. End User
- 3.1. Payers
- 3.2. Providers
- 3.3. Patients
Mobility in Healthcare Industry Segmentation By Geography
-
1. North America
- 1.1. United States
- 1.2. Canada
- 1.3. Mexico
-
2. Europe
- 2.1. Germany
- 2.2. United Kingdom
- 2.3. France
- 2.4. Italy
- 2.5. Spain
- 2.6. Rest of Europe
-
3. Asia Pacific
- 3.1. China
- 3.2. Japan
- 3.3. India
- 3.4. Australia
- 3.5. South Korea
- 3.6. Rest of Asia Pacific
- 4. Middle East
-
5. GCC
- 5.1. South Africa
- 5.2. Rest of Middle East
-
6. South America
- 6.1. Brazil
- 6.2. Argentina
- 6.3. Rest of South America
Mobility in Healthcare Industry REPORT HIGHLIGHTS
| Aspects | Details |
|---|---|
| Study Period | 2019-2033 |
| Base Year | 2024 |
| Estimated Year | 2025 |
| Forecast Period | 2025-2033 |
| Historical Period | 2019-2024 |
| Growth Rate | CAGR of 21.32% from 2019-2033 |
| Segmentation |
|
Table of Contents
- 1. Introduction
- 1.1. Research Scope
- 1.2. Market Segmentation
- 1.3. Research Methodology
- 1.4. Definitions and Assumptions
- 2. Executive Summary
- 2.1. Introduction
- 3. Market Dynamics
- 3.1. Introduction
- 3.2. Market Drivers
- 3.2.1 Increasing Utilization of the Smart Devices (Smartphones
- 3.2.2 Smart watches
- 3.2.3 etc.); Increased Influence of the Social Media on Healthcare; Rise in the Demand of Personalized Medicines
- 3.3. Market Restrains
- 3.3.1. Safety and Security Issues Associated with Patient Health Information; Lack of Skilled Professionals
- 3.4. Market Trends
- 3.4.1. Patient Care Management Segment is Expected to Witness a Healthy Growth Over the Forecast Period
- 4. Market Factor Analysis
- 4.1. Porters Five Forces
- 4.2. Supply/Value Chain
- 4.3. PESTEL analysis
- 4.4. Market Entropy
- 4.5. Patent/Trademark Analysis
- 5. Global Mobility in Healthcare Industry Analysis, Insights and Forecast, 2019-2031
- 5.1. Market Analysis, Insights and Forecast - by Products and Services
- 5.1.1. Enterprise Mobility Platforms
- 5.1.2. Mobile Applications (Apps)
- 5.1.3. Mobile Devices
- 5.2. Market Analysis, Insights and Forecast - by Application
- 5.2.1. Enterprise Solutions
- 5.2.1.1. Operation Management
- 5.2.1.2. Patient Care Management
- 5.2.1.3. Work Force Management
- 5.2.2. mHealth Applications
- 5.2.1. Enterprise Solutions
- 5.3. Market Analysis, Insights and Forecast - by End User
- 5.3.1. Payers
- 5.3.2. Providers
- 5.3.3. Patients
- 5.4. Market Analysis, Insights and Forecast - by Region
- 5.4.1. North America
- 5.4.2. Europe
- 5.4.3. Asia Pacific
- 5.4.4. Middle East
- 5.4.5. GCC
- 5.4.6. South America
- 5.1. Market Analysis, Insights and Forecast - by Products and Services
- 6. North America Mobility in Healthcare Industry Analysis, Insights and Forecast, 2019-2031
- 6.1. Market Analysis, Insights and Forecast - by Products and Services
- 6.1.1. Enterprise Mobility Platforms
- 6.1.2. Mobile Applications (Apps)
- 6.1.3. Mobile Devices
- 6.2. Market Analysis, Insights and Forecast - by Application
- 6.2.1. Enterprise Solutions
- 6.2.1.1. Operation Management
- 6.2.1.2. Patient Care Management
- 6.2.1.3. Work Force Management
- 6.2.2. mHealth Applications
- 6.2.1. Enterprise Solutions
- 6.3. Market Analysis, Insights and Forecast - by End User
- 6.3.1. Payers
- 6.3.2. Providers
- 6.3.3. Patients
- 6.1. Market Analysis, Insights and Forecast - by Products and Services
- 7. Europe Mobility in Healthcare Industry Analysis, Insights and Forecast, 2019-2031
- 7.1. Market Analysis, Insights and Forecast - by Products and Services
- 7.1.1. Enterprise Mobility Platforms
- 7.1.2. Mobile Applications (Apps)
- 7.1.3. Mobile Devices
- 7.2. Market Analysis, Insights and Forecast - by Application
- 7.2.1. Enterprise Solutions
- 7.2.1.1. Operation Management
- 7.2.1.2. Patient Care Management
- 7.2.1.3. Work Force Management
- 7.2.2. mHealth Applications
- 7.2.1. Enterprise Solutions
- 7.3. Market Analysis, Insights and Forecast - by End User
- 7.3.1. Payers
- 7.3.2. Providers
- 7.3.3. Patients
- 7.1. Market Analysis, Insights and Forecast - by Products and Services
- 8. Asia Pacific Mobility in Healthcare Industry Analysis, Insights and Forecast, 2019-2031
- 8.1. Market Analysis, Insights and Forecast - by Products and Services
- 8.1.1. Enterprise Mobility Platforms
- 8.1.2. Mobile Applications (Apps)
- 8.1.3. Mobile Devices
- 8.2. Market Analysis, Insights and Forecast - by Application
- 8.2.1. Enterprise Solutions
- 8.2.1.1. Operation Management
- 8.2.1.2. Patient Care Management
- 8.2.1.3. Work Force Management
- 8.2.2. mHealth Applications
- 8.2.1. Enterprise Solutions
- 8.3. Market Analysis, Insights and Forecast - by End User
- 8.3.1. Payers
- 8.3.2. Providers
- 8.3.3. Patients
- 8.1. Market Analysis, Insights and Forecast - by Products and Services
- 9. Middle East Mobility in Healthcare Industry Analysis, Insights and Forecast, 2019-2031
- 9.1. Market Analysis, Insights and Forecast - by Products and Services
- 9.1.1. Enterprise Mobility Platforms
- 9.1.2. Mobile Applications (Apps)
- 9.1.3. Mobile Devices
- 9.2. Market Analysis, Insights and Forecast - by Application
- 9.2.1. Enterprise Solutions
- 9.2.1.1. Operation Management
- 9.2.1.2. Patient Care Management
- 9.2.1.3. Work Force Management
- 9.2.2. mHealth Applications
- 9.2.1. Enterprise Solutions
- 9.3. Market Analysis, Insights and Forecast - by End User
- 9.3.1. Payers
- 9.3.2. Providers
- 9.3.3. Patients
- 9.1. Market Analysis, Insights and Forecast - by Products and Services
- 10. GCC Mobility in Healthcare Industry Analysis, Insights and Forecast, 2019-2031
- 10.1. Market Analysis, Insights and Forecast - by Products and Services
- 10.1.1. Enterprise Mobility Platforms
- 10.1.2. Mobile Applications (Apps)
- 10.1.3. Mobile Devices
- 10.2. Market Analysis, Insights and Forecast - by Application
- 10.2.1. Enterprise Solutions
- 10.2.1.1. Operation Management
- 10.2.1.2. Patient Care Management
- 10.2.1.3. Work Force Management
- 10.2.2. mHealth Applications
- 10.2.1. Enterprise Solutions
- 10.3. Market Analysis, Insights and Forecast - by End User
- 10.3.1. Payers
- 10.3.2. Providers
- 10.3.3. Patients
- 10.1. Market Analysis, Insights and Forecast - by Products and Services
- 11. South America Mobility in Healthcare Industry Analysis, Insights and Forecast, 2019-2031
- 11.1. Market Analysis, Insights and Forecast - by Products and Services
- 11.1.1. Enterprise Mobility Platforms
- 11.1.2. Mobile Applications (Apps)
- 11.1.3. Mobile Devices
- 11.2. Market Analysis, Insights and Forecast - by Application
- 11.2.1. Enterprise Solutions
- 11.2.1.1. Operation Management
- 11.2.1.2. Patient Care Management
- 11.2.1.3. Work Force Management
- 11.2.2. mHealth Applications
- 11.2.1. Enterprise Solutions
- 11.3. Market Analysis, Insights and Forecast - by End User
- 11.3.1. Payers
- 11.3.2. Providers
- 11.3.3. Patients
- 11.1. Market Analysis, Insights and Forecast - by Products and Services
- 12. North America Mobility in Healthcare Industry Analysis, Insights and Forecast, 2019-2031
- 12.1. Market Analysis, Insights and Forecast - By Country/Sub-region
- 12.1.1. undefined
- 13. Europe Mobility in Healthcare Industry Analysis, Insights and Forecast, 2019-2031
- 13.1. Market Analysis, Insights and Forecast - By Country/Sub-region
- 13.1.1. undefined
- 14. Asia Pacific Mobility in Healthcare Industry Analysis, Insights and Forecast, 2019-2031
- 14.1. Market Analysis, Insights and Forecast - By Country/Sub-region
- 14.1.1. undefined
- 15. Middle East Mobility in Healthcare Industry Analysis, Insights and Forecast, 2019-2031
- 15.1. Market Analysis, Insights and Forecast - By Country/Sub-region
- 15.1.1. undefined
- 16. GCC Mobility in Healthcare Industry Analysis, Insights and Forecast, 2019-2031
- 16.1. Market Analysis, Insights and Forecast - By Country/Sub-region
- 16.1.1. undefined
- 17. South America Mobility in Healthcare Industry Analysis, Insights and Forecast, 2019-2031
- 17.1. Market Analysis, Insights and Forecast - By Country/Sub-region
- 17.1.1. undefined
- 18. Competitive Analysis
- 18.1. Global Market Share Analysis 2024
- 18.2. Company Profiles
- 18.2.1 Mckesson Corporation
- 18.2.1.1. Overview
- 18.2.1.2. Products
- 18.2.1.3. SWOT Analysis
- 18.2.1.4. Recent Developments
- 18.2.1.5. Financials (Based on Availability)
- 18.2.2 Zebra Technologies Corporation
- 18.2.2.1. Overview
- 18.2.2.2. Products
- 18.2.2.3. SWOT Analysis
- 18.2.2.4. Recent Developments
- 18.2.2.5. Financials (Based on Availability)
- 18.2.3 Koninklijke Philips N V
- 18.2.3.1. Overview
- 18.2.3.2. Products
- 18.2.3.3. SWOT Analysis
- 18.2.3.4. Recent Developments
- 18.2.3.5. Financials (Based on Availability)
- 18.2.4 Cisco Systems Inc
- 18.2.4.1. Overview
- 18.2.4.2. Products
- 18.2.4.3. SWOT Analysis
- 18.2.4.4. Recent Developments
- 18.2.4.5. Financials (Based on Availability)
- 18.2.5 Airstrip Technologies Inc
- 18.2.5.1. Overview
- 18.2.5.2. Products
- 18.2.5.3. SWOT Analysis
- 18.2.5.4. Recent Developments
- 18.2.5.5. Financials (Based on Availability)
- 18.2.6 Omron Corporation
- 18.2.6.1. Overview
- 18.2.6.2. Products
- 18.2.6.3. SWOT Analysis
- 18.2.6.4. Recent Developments
- 18.2.6.5. Financials (Based on Availability)
- 18.2.7 At&T Inc
- 18.2.7.1. Overview
- 18.2.7.2. Products
- 18.2.7.3. SWOT Analysis
- 18.2.7.4. Recent Developments
- 18.2.7.5. Financials (Based on Availability)
- 18.2.8 SAP SE
- 18.2.8.1. Overview
- 18.2.8.2. Products
- 18.2.8.3. SWOT Analysis
- 18.2.8.4. Recent Developments
- 18.2.8.5. Financials (Based on Availability)
- 18.2.9 Oracle Cerner
- 18.2.9.1. Overview
- 18.2.9.2. Products
- 18.2.9.3. SWOT Analysis
- 18.2.9.4. Recent Developments
- 18.2.9.5. Financials (Based on Availability)
- 18.2.1 Mckesson Corporation
List of Figures
- Figure 1: Global Mobility in Healthcare Industry Revenue Breakdown (Million, %) by Region 2024 & 2032
- Figure 2: Global Mobility in Healthcare Industry Volume Breakdown (K Unit, %) by Region 2024 & 2032
- Figure 3: North America Mobility in Healthcare Industry Revenue (Million), by Country 2024 & 2032
- Figure 4: North America Mobility in Healthcare Industry Volume (K Unit), by Country 2024 & 2032
- Figure 5: North America Mobility in Healthcare Industry Revenue Share (%), by Country 2024 & 2032
- Figure 6: North America Mobility in Healthcare Industry Volume Share (%), by Country 2024 & 2032
- Figure 7: Europe Mobility in Healthcare Industry Revenue (Million), by Country 2024 & 2032
- Figure 8: Europe Mobility in Healthcare Industry Volume (K Unit), by Country 2024 & 2032
- Figure 9: Europe Mobility in Healthcare Industry Revenue Share (%), by Country 2024 & 2032
- Figure 10: Europe Mobility in Healthcare Industry Volume Share (%), by Country 2024 & 2032
- Figure 11: Asia Pacific Mobility in Healthcare Industry Revenue (Million), by Country 2024 & 2032
- Figure 12: Asia Pacific Mobility in Healthcare Industry Volume (K Unit), by Country 2024 & 2032
- Figure 13: Asia Pacific Mobility in Healthcare Industry Revenue Share (%), by Country 2024 & 2032
- Figure 14: Asia Pacific Mobility in Healthcare Industry Volume Share (%), by Country 2024 & 2032
- Figure 15: Middle East Mobility in Healthcare Industry Revenue (Million), by Country 2024 & 2032
- Figure 16: Middle East Mobility in Healthcare Industry Volume (K Unit), by Country 2024 & 2032
- Figure 17: Middle East Mobility in Healthcare Industry Revenue Share (%), by Country 2024 & 2032
- Figure 18: Middle East Mobility in Healthcare Industry Volume Share (%), by Country 2024 & 2032
- Figure 19: GCC Mobility in Healthcare Industry Revenue (Million), by Country 2024 & 2032
- Figure 20: GCC Mobility in Healthcare Industry Volume (K Unit), by Country 2024 & 2032
- Figure 21: GCC Mobility in Healthcare Industry Revenue Share (%), by Country 2024 & 2032
- Figure 22: GCC Mobility in Healthcare Industry Volume Share (%), by Country 2024 & 2032
- Figure 23: South America Mobility in Healthcare Industry Revenue (Million), by Country 2024 & 2032
- Figure 24: South America Mobility in Healthcare Industry Volume (K Unit), by Country 2024 & 2032
- Figure 25: South America Mobility in Healthcare Industry Revenue Share (%), by Country 2024 & 2032
- Figure 26: South America Mobility in Healthcare Industry Volume Share (%), by Country 2024 & 2032
- Figure 27: North America Mobility in Healthcare Industry Revenue (Million), by Products and Services 2024 & 2032
- Figure 28: North America Mobility in Healthcare Industry Volume (K Unit), by Products and Services 2024 & 2032
- Figure 29: North America Mobility in Healthcare Industry Revenue Share (%), by Products and Services 2024 & 2032
- Figure 30: North America Mobility in Healthcare Industry Volume Share (%), by Products and Services 2024 & 2032
- Figure 31: North America Mobility in Healthcare Industry Revenue (Million), by Application 2024 & 2032
- Figure 32: North America Mobility in Healthcare Industry Volume (K Unit), by Application 2024 & 2032
- Figure 33: North America Mobility in Healthcare Industry Revenue Share (%), by Application 2024 & 2032
- Figure 34: North America Mobility in Healthcare Industry Volume Share (%), by Application 2024 & 2032
- Figure 35: North America Mobility in Healthcare Industry Revenue (Million), by End User 2024 & 2032
- Figure 36: North America Mobility in Healthcare Industry Volume (K Unit), by End User 2024 & 2032
- Figure 37: North America Mobility in Healthcare Industry Revenue Share (%), by End User 2024 & 2032
- Figure 38: North America Mobility in Healthcare Industry Volume Share (%), by End User 2024 & 2032
- Figure 39: North America Mobility in Healthcare Industry Revenue (Million), by Country 2024 & 2032
- Figure 40: North America Mobility in Healthcare Industry Volume (K Unit), by Country 2024 & 2032
- Figure 41: North America Mobility in Healthcare Industry Revenue Share (%), by Country 2024 & 2032
- Figure 42: North America Mobility in Healthcare Industry Volume Share (%), by Country 2024 & 2032
- Figure 43: Europe Mobility in Healthcare Industry Revenue (Million), by Products and Services 2024 & 2032
- Figure 44: Europe Mobility in Healthcare Industry Volume (K Unit), by Products and Services 2024 & 2032
- Figure 45: Europe Mobility in Healthcare Industry Revenue Share (%), by Products and Services 2024 & 2032
- Figure 46: Europe Mobility in Healthcare Industry Volume Share (%), by Products and Services 2024 & 2032
- Figure 47: Europe Mobility in Healthcare Industry Revenue (Million), by Application 2024 & 2032
- Figure 48: Europe Mobility in Healthcare Industry Volume (K Unit), by Application 2024 & 2032
- Figure 49: Europe Mobility in Healthcare Industry Revenue Share (%), by Application 2024 & 2032
- Figure 50: Europe Mobility in Healthcare Industry Volume Share (%), by Application 2024 & 2032
- Figure 51: Europe Mobility in Healthcare Industry Revenue (Million), by End User 2024 & 2032
- Figure 52: Europe Mobility in Healthcare Industry Volume (K Unit), by End User 2024 & 2032
- Figure 53: Europe Mobility in Healthcare Industry Revenue Share (%), by End User 2024 & 2032
- Figure 54: Europe Mobility in Healthcare Industry Volume Share (%), by End User 2024 & 2032
- Figure 55: Europe Mobility in Healthcare Industry Revenue (Million), by Country 2024 & 2032
- Figure 56: Europe Mobility in Healthcare Industry Volume (K Unit), by Country 2024 & 2032
- Figure 57: Europe Mobility in Healthcare Industry Revenue Share (%), by Country 2024 & 2032
- Figure 58: Europe Mobility in Healthcare Industry Volume Share (%), by Country 2024 & 2032
- Figure 59: Asia Pacific Mobility in Healthcare Industry Revenue (Million), by Products and Services 2024 & 2032
- Figure 60: Asia Pacific Mobility in Healthcare Industry Volume (K Unit), by Products and Services 2024 & 2032
- Figure 61: Asia Pacific Mobility in Healthcare Industry Revenue Share (%), by Products and Services 2024 & 2032
- Figure 62: Asia Pacific Mobility in Healthcare Industry Volume Share (%), by Products and Services 2024 & 2032
- Figure 63: Asia Pacific Mobility in Healthcare Industry Revenue (Million), by Application 2024 & 2032
- Figure 64: Asia Pacific Mobility in Healthcare Industry Volume (K Unit), by Application 2024 & 2032
- Figure 65: Asia Pacific Mobility in Healthcare Industry Revenue Share (%), by Application 2024 & 2032
- Figure 66: Asia Pacific Mobility in Healthcare Industry Volume Share (%), by Application 2024 & 2032
- Figure 67: Asia Pacific Mobility in Healthcare Industry Revenue (Million), by End User 2024 & 2032
- Figure 68: Asia Pacific Mobility in Healthcare Industry Volume (K Unit), by End User 2024 & 2032
- Figure 69: Asia Pacific Mobility in Healthcare Industry Revenue Share (%), by End User 2024 & 2032
- Figure 70: Asia Pacific Mobility in Healthcare Industry Volume Share (%), by End User 2024 & 2032
- Figure 71: Asia Pacific Mobility in Healthcare Industry Revenue (Million), by Country 2024 & 2032
- Figure 72: Asia Pacific Mobility in Healthcare Industry Volume (K Unit), by Country 2024 & 2032
- Figure 73: Asia Pacific Mobility in Healthcare Industry Revenue Share (%), by Country 2024 & 2032
- Figure 74: Asia Pacific Mobility in Healthcare Industry Volume Share (%), by Country 2024 & 2032
- Figure 75: Middle East Mobility in Healthcare Industry Revenue (Million), by Products and Services 2024 & 2032
- Figure 76: Middle East Mobility in Healthcare Industry Volume (K Unit), by Products and Services 2024 & 2032
- Figure 77: Middle East Mobility in Healthcare Industry Revenue Share (%), by Products and Services 2024 & 2032
- Figure 78: Middle East Mobility in Healthcare Industry Volume Share (%), by Products and Services 2024 & 2032
- Figure 79: Middle East Mobility in Healthcare Industry Revenue (Million), by Application 2024 & 2032
- Figure 80: Middle East Mobility in Healthcare Industry Volume (K Unit), by Application 2024 & 2032
- Figure 81: Middle East Mobility in Healthcare Industry Revenue Share (%), by Application 2024 & 2032
- Figure 82: Middle East Mobility in Healthcare Industry Volume Share (%), by Application 2024 & 2032
- Figure 83: Middle East Mobility in Healthcare Industry Revenue (Million), by End User 2024 & 2032
- Figure 84: Middle East Mobility in Healthcare Industry Volume (K Unit), by End User 2024 & 2032
- Figure 85: Middle East Mobility in Healthcare Industry Revenue Share (%), by End User 2024 & 2032
- Figure 86: Middle East Mobility in Healthcare Industry Volume Share (%), by End User 2024 & 2032
- Figure 87: Middle East Mobility in Healthcare Industry Revenue (Million), by Country 2024 & 2032
- Figure 88: Middle East Mobility in Healthcare Industry Volume (K Unit), by Country 2024 & 2032
- Figure 89: Middle East Mobility in Healthcare Industry Revenue Share (%), by Country 2024 & 2032
- Figure 90: Middle East Mobility in Healthcare Industry Volume Share (%), by Country 2024 & 2032
- Figure 91: GCC Mobility in Healthcare Industry Revenue (Million), by Products and Services 2024 & 2032
- Figure 92: GCC Mobility in Healthcare Industry Volume (K Unit), by Products and Services 2024 & 2032
- Figure 93: GCC Mobility in Healthcare Industry Revenue Share (%), by Products and Services 2024 & 2032
- Figure 94: GCC Mobility in Healthcare Industry Volume Share (%), by Products and Services 2024 & 2032
- Figure 95: GCC Mobility in Healthcare Industry Revenue (Million), by Application 2024 & 2032
- Figure 96: GCC Mobility in Healthcare Industry Volume (K Unit), by Application 2024 & 2032
- Figure 97: GCC Mobility in Healthcare Industry Revenue Share (%), by Application 2024 & 2032
- Figure 98: GCC Mobility in Healthcare Industry Volume Share (%), by Application 2024 & 2032
- Figure 99: GCC Mobility in Healthcare Industry Revenue (Million), by End User 2024 & 2032
- Figure 100: GCC Mobility in Healthcare Industry Volume (K Unit), by End User 2024 & 2032
- Figure 101: GCC Mobility in Healthcare Industry Revenue Share (%), by End User 2024 & 2032
- Figure 102: GCC Mobility in Healthcare Industry Volume Share (%), by End User 2024 & 2032
- Figure 103: GCC Mobility in Healthcare Industry Revenue (Million), by Country 2024 & 2032
- Figure 104: GCC Mobility in Healthcare Industry Volume (K Unit), by Country 2024 & 2032
- Figure 105: GCC Mobility in Healthcare Industry Revenue Share (%), by Country 2024 & 2032
- Figure 106: GCC Mobility in Healthcare Industry Volume Share (%), by Country 2024 & 2032
- Figure 107: South America Mobility in Healthcare Industry Revenue (Million), by Products and Services 2024 & 2032
- Figure 108: South America Mobility in Healthcare Industry Volume (K Unit), by Products and Services 2024 & 2032
- Figure 109: South America Mobility in Healthcare Industry Revenue Share (%), by Products and Services 2024 & 2032
- Figure 110: South America Mobility in Healthcare Industry Volume Share (%), by Products and Services 2024 & 2032
- Figure 111: South America Mobility in Healthcare Industry Revenue (Million), by Application 2024 & 2032
- Figure 112: South America Mobility in Healthcare Industry Volume (K Unit), by Application 2024 & 2032
- Figure 113: South America Mobility in Healthcare Industry Revenue Share (%), by Application 2024 & 2032
- Figure 114: South America Mobility in Healthcare Industry Volume Share (%), by Application 2024 & 2032
- Figure 115: South America Mobility in Healthcare Industry Revenue (Million), by End User 2024 & 2032
- Figure 116: South America Mobility in Healthcare Industry Volume (K Unit), by End User 2024 & 2032
- Figure 117: South America Mobility in Healthcare Industry Revenue Share (%), by End User 2024 & 2032
- Figure 118: South America Mobility in Healthcare Industry Volume Share (%), by End User 2024 & 2032
- Figure 119: South America Mobility in Healthcare Industry Revenue (Million), by Country 2024 & 2032
- Figure 120: South America Mobility in Healthcare Industry Volume (K Unit), by Country 2024 & 2032
- Figure 121: South America Mobility in Healthcare Industry Revenue Share (%), by Country 2024 & 2032
- Figure 122: South America Mobility in Healthcare Industry Volume Share (%), by Country 2024 & 2032
List of Tables
- Table 1: Global Mobility in Healthcare Industry Revenue Million Forecast, by Region 2019 & 2032
- Table 2: Global Mobility in Healthcare Industry Volume K Unit Forecast, by Region 2019 & 2032
- Table 3: Global Mobility in Healthcare Industry Revenue Million Forecast, by Products and Services 2019 & 2032
- Table 4: Global Mobility in Healthcare Industry Volume K Unit Forecast, by Products and Services 2019 & 2032
- Table 5: Global Mobility in Healthcare Industry Revenue Million Forecast, by Application 2019 & 2032
- Table 6: Global Mobility in Healthcare Industry Volume K Unit Forecast, by Application 2019 & 2032
- Table 7: Global Mobility in Healthcare Industry Revenue Million Forecast, by End User 2019 & 2032
- Table 8: Global Mobility in Healthcare Industry Volume K Unit Forecast, by End User 2019 & 2032
- Table 9: Global Mobility in Healthcare Industry Revenue Million Forecast, by Region 2019 & 2032
- Table 10: Global Mobility in Healthcare Industry Volume K Unit Forecast, by Region 2019 & 2032
- Table 11: Global Mobility in Healthcare Industry Revenue Million Forecast, by Country 2019 & 2032
- Table 12: Global Mobility in Healthcare Industry Volume K Unit Forecast, by Country 2019 & 2032
- Table 13: Global Mobility in Healthcare Industry Revenue Million Forecast, by Country 2019 & 2032
- Table 14: Global Mobility in Healthcare Industry Volume K Unit Forecast, by Country 2019 & 2032
- Table 15: Global Mobility in Healthcare Industry Revenue Million Forecast, by Country 2019 & 2032
- Table 16: Global Mobility in Healthcare Industry Volume K Unit Forecast, by Country 2019 & 2032
- Table 17: Global Mobility in Healthcare Industry Revenue Million Forecast, by Country 2019 & 2032
- Table 18: Global Mobility in Healthcare Industry Volume K Unit Forecast, by Country 2019 & 2032
- Table 19: Global Mobility in Healthcare Industry Revenue Million Forecast, by Country 2019 & 2032
- Table 20: Global Mobility in Healthcare Industry Volume K Unit Forecast, by Country 2019 & 2032
- Table 21: Global Mobility in Healthcare Industry Revenue Million Forecast, by Country 2019 & 2032
- Table 22: Global Mobility in Healthcare Industry Volume K Unit Forecast, by Country 2019 & 2032
- Table 23: Global Mobility in Healthcare Industry Revenue Million Forecast, by Products and Services 2019 & 2032
- Table 24: Global Mobility in Healthcare Industry Volume K Unit Forecast, by Products and Services 2019 & 2032
- Table 25: Global Mobility in Healthcare Industry Revenue Million Forecast, by Application 2019 & 2032
- Table 26: Global Mobility in Healthcare Industry Volume K Unit Forecast, by Application 2019 & 2032
- Table 27: Global Mobility in Healthcare Industry Revenue Million Forecast, by End User 2019 & 2032
- Table 28: Global Mobility in Healthcare Industry Volume K Unit Forecast, by End User 2019 & 2032
- Table 29: Global Mobility in Healthcare Industry Revenue Million Forecast, by Country 2019 & 2032
- Table 30: Global Mobility in Healthcare Industry Volume K Unit Forecast, by Country 2019 & 2032
- Table 31: United States Mobility in Healthcare Industry Revenue (Million) Forecast, by Application 2019 & 2032
- Table 32: United States Mobility in Healthcare Industry Volume (K Unit) Forecast, by Application 2019 & 2032
- Table 33: Canada Mobility in Healthcare Industry Revenue (Million) Forecast, by Application 2019 & 2032
- Table 34: Canada Mobility in Healthcare Industry Volume (K Unit) Forecast, by Application 2019 & 2032
- Table 35: Mexico Mobility in Healthcare Industry Revenue (Million) Forecast, by Application 2019 & 2032
- Table 36: Mexico Mobility in Healthcare Industry Volume (K Unit) Forecast, by Application 2019 & 2032
- Table 37: Global Mobility in Healthcare Industry Revenue Million Forecast, by Products and Services 2019 & 2032
- Table 38: Global Mobility in Healthcare Industry Volume K Unit Forecast, by Products and Services 2019 & 2032
- Table 39: Global Mobility in Healthcare Industry Revenue Million Forecast, by Application 2019 & 2032
- Table 40: Global Mobility in Healthcare Industry Volume K Unit Forecast, by Application 2019 & 2032
- Table 41: Global Mobility in Healthcare Industry Revenue Million Forecast, by End User 2019 & 2032
- Table 42: Global Mobility in Healthcare Industry Volume K Unit Forecast, by End User 2019 & 2032
- Table 43: Global Mobility in Healthcare Industry Revenue Million Forecast, by Country 2019 & 2032
- Table 44: Global Mobility in Healthcare Industry Volume K Unit Forecast, by Country 2019 & 2032
- Table 45: Germany Mobility in Healthcare Industry Revenue (Million) Forecast, by Application 2019 & 2032
- Table 46: Germany Mobility in Healthcare Industry Volume (K Unit) Forecast, by Application 2019 & 2032
- Table 47: United Kingdom Mobility in Healthcare Industry Revenue (Million) Forecast, by Application 2019 & 2032
- Table 48: United Kingdom Mobility in Healthcare Industry Volume (K Unit) Forecast, by Application 2019 & 2032
- Table 49: France Mobility in Healthcare Industry Revenue (Million) Forecast, by Application 2019 & 2032
- Table 50: France Mobility in Healthcare Industry Volume (K Unit) Forecast, by Application 2019 & 2032
- Table 51: Italy Mobility in Healthcare Industry Revenue (Million) Forecast, by Application 2019 & 2032
- Table 52: Italy Mobility in Healthcare Industry Volume (K Unit) Forecast, by Application 2019 & 2032
- Table 53: Spain Mobility in Healthcare Industry Revenue (Million) Forecast, by Application 2019 & 2032
- Table 54: Spain Mobility in Healthcare Industry Volume (K Unit) Forecast, by Application 2019 & 2032
- Table 55: Rest of Europe Mobility in Healthcare Industry Revenue (Million) Forecast, by Application 2019 & 2032
- Table 56: Rest of Europe Mobility in Healthcare Industry Volume (K Unit) Forecast, by Application 2019 & 2032
- Table 57: Global Mobility in Healthcare Industry Revenue Million Forecast, by Products and Services 2019 & 2032
- Table 58: Global Mobility in Healthcare Industry Volume K Unit Forecast, by Products and Services 2019 & 2032
- Table 59: Global Mobility in Healthcare Industry Revenue Million Forecast, by Application 2019 & 2032
- Table 60: Global Mobility in Healthcare Industry Volume K Unit Forecast, by Application 2019 & 2032
- Table 61: Global Mobility in Healthcare Industry Revenue Million Forecast, by End User 2019 & 2032
- Table 62: Global Mobility in Healthcare Industry Volume K Unit Forecast, by End User 2019 & 2032
- Table 63: Global Mobility in Healthcare Industry Revenue Million Forecast, by Country 2019 & 2032
- Table 64: Global Mobility in Healthcare Industry Volume K Unit Forecast, by Country 2019 & 2032
- Table 65: China Mobility in Healthcare Industry Revenue (Million) Forecast, by Application 2019 & 2032
- Table 66: China Mobility in Healthcare Industry Volume (K Unit) Forecast, by Application 2019 & 2032
- Table 67: Japan Mobility in Healthcare Industry Revenue (Million) Forecast, by Application 2019 & 2032
- Table 68: Japan Mobility in Healthcare Industry Volume (K Unit) Forecast, by Application 2019 & 2032
- Table 69: India Mobility in Healthcare Industry Revenue (Million) Forecast, by Application 2019 & 2032
- Table 70: India Mobility in Healthcare Industry Volume (K Unit) Forecast, by Application 2019 & 2032
- Table 71: Australia Mobility in Healthcare Industry Revenue (Million) Forecast, by Application 2019 & 2032
- Table 72: Australia Mobility in Healthcare Industry Volume (K Unit) Forecast, by Application 2019 & 2032
- Table 73: South Korea Mobility in Healthcare Industry Revenue (Million) Forecast, by Application 2019 & 2032
- Table 74: South Korea Mobility in Healthcare Industry Volume (K Unit) Forecast, by Application 2019 & 2032
- Table 75: Rest of Asia Pacific Mobility in Healthcare Industry Revenue (Million) Forecast, by Application 2019 & 2032
- Table 76: Rest of Asia Pacific Mobility in Healthcare Industry Volume (K Unit) Forecast, by Application 2019 & 2032
- Table 77: Global Mobility in Healthcare Industry Revenue Million Forecast, by Products and Services 2019 & 2032
- Table 78: Global Mobility in Healthcare Industry Volume K Unit Forecast, by Products and Services 2019 & 2032
- Table 79: Global Mobility in Healthcare Industry Revenue Million Forecast, by Application 2019 & 2032
- Table 80: Global Mobility in Healthcare Industry Volume K Unit Forecast, by Application 2019 & 2032
- Table 81: Global Mobility in Healthcare Industry Revenue Million Forecast, by End User 2019 & 2032
- Table 82: Global Mobility in Healthcare Industry Volume K Unit Forecast, by End User 2019 & 2032
- Table 83: Global Mobility in Healthcare Industry Revenue Million Forecast, by Country 2019 & 2032
- Table 84: Global Mobility in Healthcare Industry Volume K Unit Forecast, by Country 2019 & 2032
- Table 85: Global Mobility in Healthcare Industry Revenue Million Forecast, by Products and Services 2019 & 2032
- Table 86: Global Mobility in Healthcare Industry Volume K Unit Forecast, by Products and Services 2019 & 2032
- Table 87: Global Mobility in Healthcare Industry Revenue Million Forecast, by Application 2019 & 2032
- Table 88: Global Mobility in Healthcare Industry Volume K Unit Forecast, by Application 2019 & 2032
- Table 89: Global Mobility in Healthcare Industry Revenue Million Forecast, by End User 2019 & 2032
- Table 90: Global Mobility in Healthcare Industry Volume K Unit Forecast, by End User 2019 & 2032
- Table 91: Global Mobility in Healthcare Industry Revenue Million Forecast, by Country 2019 & 2032
- Table 92: Global Mobility in Healthcare Industry Volume K Unit Forecast, by Country 2019 & 2032
- Table 93: South Africa Mobility in Healthcare Industry Revenue (Million) Forecast, by Application 2019 & 2032
- Table 94: South Africa Mobility in Healthcare Industry Volume (K Unit) Forecast, by Application 2019 & 2032
- Table 95: Rest of Middle East Mobility in Healthcare Industry Revenue (Million) Forecast, by Application 2019 & 2032
- Table 96: Rest of Middle East Mobility in Healthcare Industry Volume (K Unit) Forecast, by Application 2019 & 2032
- Table 97: Global Mobility in Healthcare Industry Revenue Million Forecast, by Products and Services 2019 & 2032
- Table 98: Global Mobility in Healthcare Industry Volume K Unit Forecast, by Products and Services 2019 & 2032
- Table 99: Global Mobility in Healthcare Industry Revenue Million Forecast, by Application 2019 & 2032
- Table 100: Global Mobility in Healthcare Industry Volume K Unit Forecast, by Application 2019 & 2032
- Table 101: Global Mobility in Healthcare Industry Revenue Million Forecast, by End User 2019 & 2032
- Table 102: Global Mobility in Healthcare Industry Volume K Unit Forecast, by End User 2019 & 2032
- Table 103: Global Mobility in Healthcare Industry Revenue Million Forecast, by Country 2019 & 2032
- Table 104: Global Mobility in Healthcare Industry Volume K Unit Forecast, by Country 2019 & 2032
- Table 105: Brazil Mobility in Healthcare Industry Revenue (Million) Forecast, by Application 2019 & 2032
- Table 106: Brazil Mobility in Healthcare Industry Volume (K Unit) Forecast, by Application 2019 & 2032
- Table 107: Argentina Mobility in Healthcare Industry Revenue (Million) Forecast, by Application 2019 & 2032
- Table 108: Argentina Mobility in Healthcare Industry Volume (K Unit) Forecast, by Application 2019 & 2032
- Table 109: Rest of South America Mobility in Healthcare Industry Revenue (Million) Forecast, by Application 2019 & 2032
- Table 110: Rest of South America Mobility in Healthcare Industry Volume (K Unit) Forecast, by Application 2019 & 2032
Frequently Asked Questions
1. What is the projected Compound Annual Growth Rate (CAGR) of the Mobility in Healthcare Industry?
The projected CAGR is approximately 21.32%.
2. Which companies are prominent players in the Mobility in Healthcare Industry?
Key companies in the market include Mckesson Corporation, Zebra Technologies Corporation, Koninklijke Philips N V, Cisco Systems Inc, Airstrip Technologies Inc, Omron Corporation, At&T Inc, SAP SE, Oracle Cerner.
3. What are the main segments of the Mobility in Healthcare Industry?
The market segments include Products and Services, Application, End User.
4. Can you provide details about the market size?
The market size is estimated to be USD 135.43 Million as of 2022.
5. What are some drivers contributing to market growth?
Increasing Utilization of the Smart Devices (Smartphones. Smart watches. etc.); Increased Influence of the Social Media on Healthcare; Rise in the Demand of Personalized Medicines.
6. What are the notable trends driving market growth?
Patient Care Management Segment is Expected to Witness a Healthy Growth Over the Forecast Period.
7. Are there any restraints impacting market growth?
Safety and Security Issues Associated with Patient Health Information; Lack of Skilled Professionals.
8. Can you provide examples of recent developments in the market?
In August 2022, Indonesia's Health Ministry launched the Indonesia Health Services platform in Jakarta as a part of the country's health technology transformation.
9. What pricing options are available for accessing the report?
Pricing options include single-user, multi-user, and enterprise licenses priced at USD 4750, USD 5250, and USD 8750 respectively.
10. Is the market size provided in terms of value or volume?
The market size is provided in terms of value, measured in Million and volume, measured in K Unit.
11. Are there any specific market keywords associated with the report?
Yes, the market keyword associated with the report is "Mobility in Healthcare Industry," which aids in identifying and referencing the specific market segment covered.
12. How do I determine which pricing option suits my needs best?
The pricing options vary based on user requirements and access needs. Individual users may opt for single-user licenses, while businesses requiring broader access may choose multi-user or enterprise licenses for cost-effective access to the report.
13. Are there any additional resources or data provided in the Mobility in Healthcare Industry report?
While the report offers comprehensive insights, it's advisable to review the specific contents or supplementary materials provided to ascertain if additional resources or data are available.
14. How can I stay updated on further developments or reports in the Mobility in Healthcare Industry?
To stay informed about further developments, trends, and reports in the Mobility in Healthcare Industry, consider subscribing to industry newsletters, following relevant companies and organizations, or regularly checking reputable industry news sources and publications.
Methodology
Step 1 - Identification of Relevant Samples Size from Population Database


Step 2 - Approaches for Defining Global Market Size (Value, Volume* & Price*)

Note*: In applicable scenarios
Step 3 - Data Sources
Primary Research
- Web Analytics
- Survey Reports
- Research Institute
- Latest Research Reports
- Opinion Leaders
Secondary Research
- Annual Reports
- White Paper
- Latest Press Release
- Industry Association
- Paid Database
- Investor Presentations

Step 4 - Data Triangulation
Involves using different sources of information in order to increase the validity of a study
These sources are likely to be stakeholders in a program - participants, other researchers, program staff, other community members, and so on.
Then we put all data in single framework & apply various statistical tools to find out the dynamic on the market.
During the analysis stage, feedback from the stakeholder groups would be compared to determine areas of agreement as well as areas of divergence
