

Key Insights
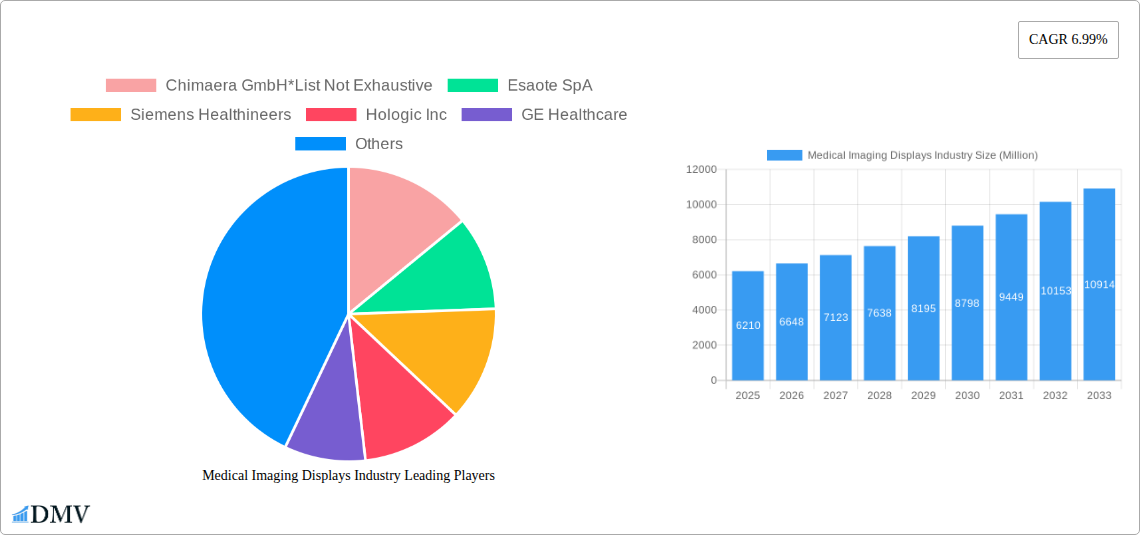
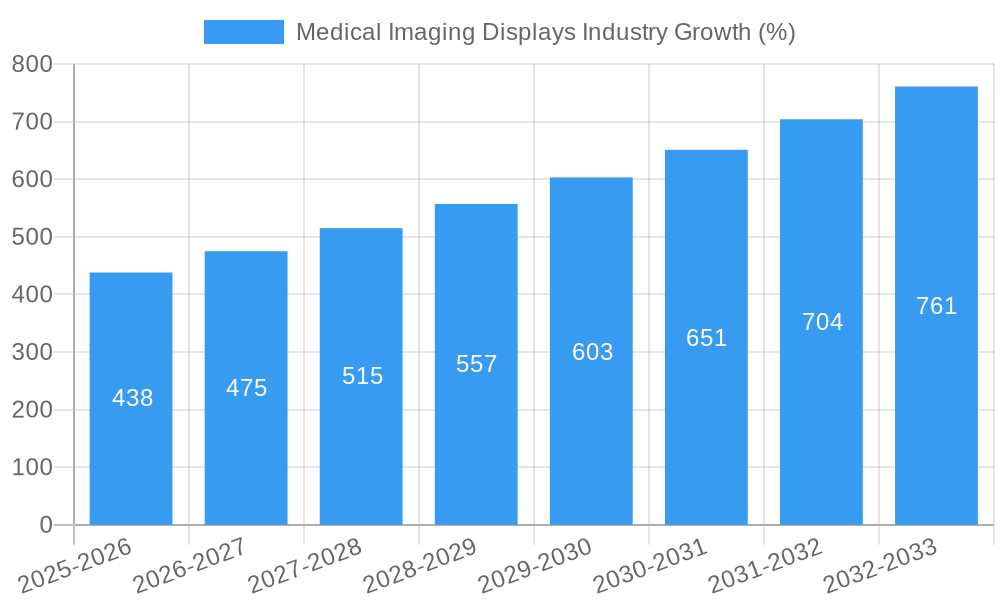
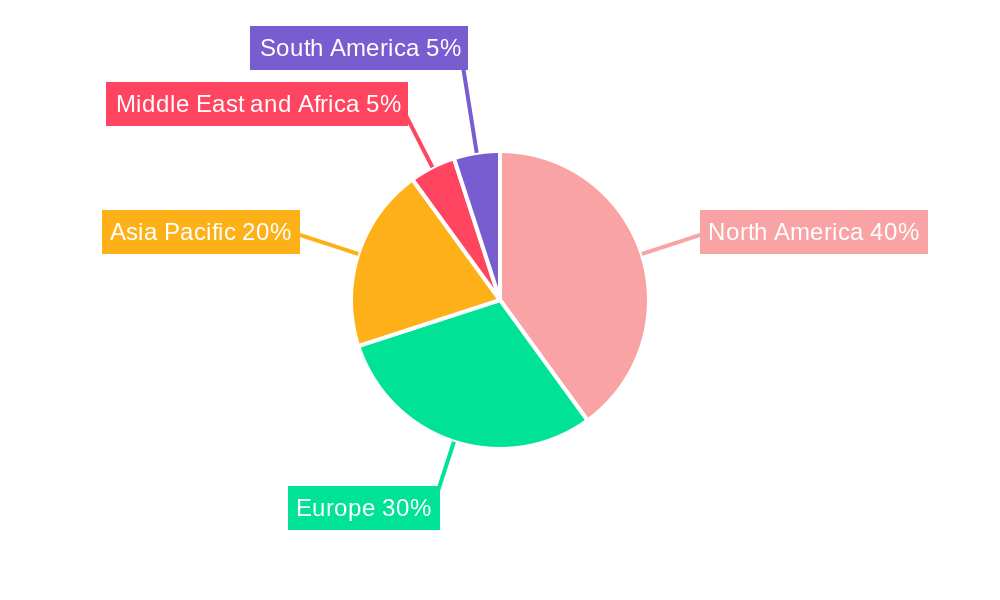
The Medical Imaging Displays market, valued at $6.21 billion in 2025, is projected to experience robust growth, exhibiting a Compound Annual Growth Rate (CAGR) of 6.99% from 2025 to 2033. This expansion is fueled by several key drivers. Technological advancements, such as the increasing adoption of high-resolution displays with improved image quality and ergonomics, are significantly impacting market growth. The rising prevalence of chronic diseases necessitates more frequent and sophisticated diagnostic imaging procedures, thereby boosting demand. Furthermore, the ongoing shift towards minimally invasive procedures and advanced image-guided therapies further contributes to market expansion. The integration of Artificial Intelligence (AI) and machine learning in medical imaging analysis is also playing a crucial role, enhancing diagnostic accuracy and workflow efficiency. Growth is particularly strong in the segments of Computed Tomography (CT) and Magnetic Resonance Imaging (MRI) displays due to their superior image clarity and detail, while the adoption of thin client workstations is gaining traction due to enhanced network connectivity and remote access capabilities. Regional variations exist, with North America currently holding a significant market share, driven by high healthcare expenditure and technological adoption. However, Asia Pacific is projected to experience the fastest growth rate over the forecast period due to the increasing healthcare infrastructure development and rising disposable incomes in emerging economies.
Market restraints include the high initial investment costs associated with advanced medical imaging display systems and the need for ongoing maintenance and service contracts. However, these challenges are being mitigated by the introduction of more cost-effective solutions and the availability of flexible financing options. The competitive landscape is dynamic, with a mix of established players like Siemens Healthineers, GE Healthcare, and Philips, alongside specialized companies focusing on specific modalities or components. The market is characterized by intense competition based on technological innovation, product features, pricing strategies, and geographical expansion. Future growth will be further influenced by regulatory changes, reimbursement policies, and technological breakthroughs in display technologies and image processing. The market’s trajectory suggests a continued upward trend, driven by innovation, improved healthcare infrastructure, and the increasing demand for advanced diagnostic imaging capabilities worldwide.
Medical Imaging Displays Industry: A Comprehensive Market Report (2019-2033)
This insightful report provides a detailed analysis of the Medical Imaging Displays market, encompassing historical data (2019-2024), current estimations (2025), and future forecasts (2025-2033). We delve deep into market dynamics, technological advancements, competitive landscapes, and growth opportunities, equipping stakeholders with crucial intelligence for strategic decision-making. The market is projected to reach xx Million by 2033, exhibiting a robust Compound Annual Growth Rate (CAGR) of xx% during the forecast period.
Medical Imaging Displays Industry Market Composition & Trends
The Medical Imaging Displays market is characterized by a moderately concentrated landscape, with key players like Siemens Healthineers, GE Healthcare, and Koninklijke Philips N.V. holding significant market share. However, smaller, specialized companies are also emerging, driving innovation and competition. Market share distribution in 2025 is estimated as follows: Siemens Healthineers (xx%), GE Healthcare (xx%), Koninklijke Philips N.V. (xx%), and Others (xx%). The market is driven by technological advancements, such as the increasing adoption of Artificial Intelligence (AI) in image analysis and the development of higher-resolution displays. Regulatory landscapes, particularly those related to data privacy and cybersecurity, significantly influence market dynamics. Substitute products, including software-based visualization tools, pose a moderate competitive threat. End-users primarily comprise hospitals, diagnostic imaging centers, and research institutions. M&A activity has been moderate in recent years, with deal values totaling approximately xx Million in the period 2019-2024.
- Market Concentration: Moderately concentrated with key players holding significant share.
- Innovation Catalysts: AI-powered image analysis, higher-resolution displays.
- Regulatory Landscape: Stringent data privacy and cybersecurity regulations.
- Substitute Products: Software-based visualization tools.
- End-User Profile: Hospitals, diagnostic centers, research institutions.
- M&A Activity: Moderate activity, with total deal values of approximately xx Million (2019-2024).
Medical Imaging Displays Industry Evolution
The Medical Imaging Displays market has witnessed substantial growth over the past five years, fueled by the increasing prevalence of chronic diseases, technological advancements, and rising healthcare expenditure. From 2019 to 2024, the market exhibited a CAGR of xx%, reaching xx Million in 2024. This growth trajectory is expected to continue, driven by several factors. The integration of AI and machine learning is revolutionizing image analysis, leading to faster and more accurate diagnoses. The adoption of cloud-based solutions is enhancing accessibility and collaboration among healthcare professionals. Furthermore, the growing demand for high-resolution displays with superior image quality is driving market expansion. Consumer demand is shifting towards user-friendly, cost-effective, and versatile systems that can integrate seamlessly with existing healthcare IT infrastructure. The adoption rate of advanced imaging technologies, particularly in emerging economies, remains a key growth driver, projected to reach xx% by 2033.
Leading Regions, Countries, or Segments in Medical Imaging Displays Industry
North America currently dominates the Medical Imaging Displays market, driven by factors such as high healthcare spending, advanced technological infrastructure, and early adoption of new technologies. Within this region, the United States represents the largest market share.
- By Component: Display Units currently hold the largest market share due to the continuous need for high-quality screens in medical imaging applications. This segment is further projected to grow at a CAGR of xx% from 2025 to 2033. Visualization software is another rapidly growing segment, owing to the increasing demand for advanced image processing and analysis tools.
- By Modality: Computed Tomography (CT) accounts for the largest market share, owing to its widespread use in diagnostic imaging. However, the Ultrasound segment is expected to experience significant growth due to its portability and cost-effectiveness.
- By Usage Mode: Thick client workstations currently dominate the market due to their superior processing power and performance. Thin-client workstations are anticipated to see increased adoption due to their cost-effectiveness and ease of deployment.
Key Drivers:
- High healthcare expenditure in North America.
- Strong technological infrastructure.
- Early adoption of new technologies.
- Government initiatives promoting healthcare IT infrastructure.
Medical Imaging Displays Industry Product Innovations
Recent innovations focus on improving image quality, enhancing workflow efficiency, and incorporating AI capabilities. Manufacturers are introducing displays with higher resolutions, wider color gamuts, and improved ergonomics. The integration of AI algorithms into visualization software is enabling faster and more accurate image analysis, leading to improved diagnostic accuracy and reduced workflow times. Unique selling propositions often revolve around superior image quality, intuitive user interfaces, seamless integration with existing systems, and robust cybersecurity features.
Propelling Factors for Medical Imaging Displays Growth
Technological advancements, particularly in AI and cloud computing, are key growth drivers. Rising healthcare spending globally is fueling demand for advanced imaging technologies. Favorable government regulations and initiatives supporting healthcare IT infrastructure further contribute to market expansion. The increasing prevalence of chronic diseases is driving the need for more sophisticated diagnostic tools. For instance, the growing demand for faster and more accurate diagnoses of cancers is pushing the adoption of high-resolution displays with AI-powered image analysis capabilities.
Obstacles in the Medical Imaging Displays Market
High initial investment costs can pose a significant barrier to entry for smaller players. Supply chain disruptions and the volatility of raw material prices can affect production costs and profitability. Stringent regulatory compliance requirements related to medical device approvals and data privacy impose challenges. Intense competition among established players can lead to price wars and reduced profit margins. The impact of these obstacles varies, but collectively, they may reduce the overall market growth rate by approximately xx% by 2033.
Future Opportunities in Medical Imaging Displays Industry
Emerging markets in Asia and Africa present significant growth potential. The integration of 5G and other advanced connectivity technologies can further enhance remote diagnosis and collaboration. The increasing demand for personalized medicine is driving the need for more sophisticated imaging technologies capable of providing highly detailed images. Focus on developing sustainable and eco-friendly display technologies is also an area of future opportunity.
Major Players in the Medical Imaging Displays Industry Ecosystem
- Chimaera GmbH
- Esaote SpA
- Siemens Healthineers
- Hologic Inc
- GE Healthcare
- Koninklijke Philips N.V.
- PaxeraHealth
- Carestream Health
- NGI Group
- Medicor Imaging
- Carl Zeiss AG
- Capsa Healthcare
Key Developments in Medical Imaging Displays Industry
- 2022 Q3: Siemens Healthineers launched a new line of high-resolution displays with AI-powered image analysis capabilities.
- 2023 Q1: GE Healthcare announced a strategic partnership with a cloud computing provider to enhance the accessibility of its medical imaging solutions.
- 2024 Q2: A significant merger between two mid-sized players resulted in increased market consolidation. (Further details would be added to the full report)
Strategic Medical Imaging Displays Market Forecast
The Medical Imaging Displays market is poised for continued growth, driven by ongoing technological advancements and the increasing adoption of advanced imaging modalities. The market's future expansion will be strongly influenced by the ongoing integration of AI into medical imaging workflows, alongside an increasing demand for high-resolution, user-friendly displays that offer seamless integration with hospital IT infrastructure. The consistent demand for superior image quality in the medical field and sustained investments in improving healthcare facilities will contribute to a positive growth trajectory in the coming years.
Medical Imaging Displays Industry Segmentation
-
1. Component
- 1.1. Visualization Software
- 1.2. Display Units
- 1.3. Others
-
2. Modality
- 2.1. Computed Tomography (CT)
- 2.2. Magnetic Resonance Imaging
- 2.3. Ultrasound
- 2.4. Mammography
- 2.5. Others
-
3. Usage Mode
- 3.1. Thick Client Workstation
- 3.2. Thin Client Workstation
Medical Imaging Displays Industry Segmentation By Geography
-
1. North America
- 1.1. United States
- 1.2. Canada
- 1.3. Mexico
-
2. Europe
- 2.1. Germany
- 2.2. United Kingdom
- 2.3. France
- 2.4. Italy
- 2.5. Spain
- 2.6. Rest of Europe
-
3. Asia Pacific
- 3.1. China
- 3.2. Japan
- 3.3. India
- 3.4. Australia
- 3.5. South Korea
- 3.6. Rest of Asia Pacific
-
4. Middle East and Africa
- 4.1. GCC
- 4.2. South Africa
- 4.3. Rest of Middle East and Africa
-
5. South America
- 5.1. Brazil
- 5.2. Argentina
- 5.3. Rest of South America
Medical Imaging Displays Industry REPORT HIGHLIGHTS
| Aspects | Details |
|---|---|
| Study Period | 2019-2033 |
| Base Year | 2024 |
| Estimated Year | 2025 |
| Forecast Period | 2025-2033 |
| Historical Period | 2019-2024 |
| Growth Rate | CAGR of 6.99% from 2019-2033 |
| Segmentation |
|
Table of Contents
- 1. Introduction
- 1.1. Research Scope
- 1.2. Market Segmentation
- 1.3. Research Methodology
- 1.4. Definitions and Assumptions
- 2. Executive Summary
- 2.1. Introduction
- 3. Market Dynamics
- 3.1. Introduction
- 3.2. Market Drivers
- 3.2.1. Technological Advancements in The Imaging Technologies and Use of Artificial Intelligence; Rising Healthcare Expenditure Coupled with Rising Disease Burden
- 3.3. Market Restrains
- 3.3.1. High Cost of Medical Imaging Equipment; Lack of Skilled Professionals
- 3.4. Market Trends
- 3.4.1. Ultrasound is Expected to Hold the Major Market Share in the Medical Imaging Workstation Market
- 4. Market Factor Analysis
- 4.1. Porters Five Forces
- 4.2. Supply/Value Chain
- 4.3. PESTEL analysis
- 4.4. Market Entropy
- 4.5. Patent/Trademark Analysis
- 5. Global Medical Imaging Displays Industry Analysis, Insights and Forecast, 2019-2031
- 5.1. Market Analysis, Insights and Forecast - by Component
- 5.1.1. Visualization Software
- 5.1.2. Display Units
- 5.1.3. Others
- 5.2. Market Analysis, Insights and Forecast - by Modality
- 5.2.1. Computed Tomography (CT)
- 5.2.2. Magnetic Resonance Imaging
- 5.2.3. Ultrasound
- 5.2.4. Mammography
- 5.2.5. Others
- 5.3. Market Analysis, Insights and Forecast - by Usage Mode
- 5.3.1. Thick Client Workstation
- 5.3.2. Thin Client Workstation
- 5.4. Market Analysis, Insights and Forecast - by Region
- 5.4.1. North America
- 5.4.2. Europe
- 5.4.3. Asia Pacific
- 5.4.4. Middle East and Africa
- 5.4.5. South America
- 5.1. Market Analysis, Insights and Forecast - by Component
- 6. North America Medical Imaging Displays Industry Analysis, Insights and Forecast, 2019-2031
- 6.1. Market Analysis, Insights and Forecast - by Component
- 6.1.1. Visualization Software
- 6.1.2. Display Units
- 6.1.3. Others
- 6.2. Market Analysis, Insights and Forecast - by Modality
- 6.2.1. Computed Tomography (CT)
- 6.2.2. Magnetic Resonance Imaging
- 6.2.3. Ultrasound
- 6.2.4. Mammography
- 6.2.5. Others
- 6.3. Market Analysis, Insights and Forecast - by Usage Mode
- 6.3.1. Thick Client Workstation
- 6.3.2. Thin Client Workstation
- 6.1. Market Analysis, Insights and Forecast - by Component
- 7. Europe Medical Imaging Displays Industry Analysis, Insights and Forecast, 2019-2031
- 7.1. Market Analysis, Insights and Forecast - by Component
- 7.1.1. Visualization Software
- 7.1.2. Display Units
- 7.1.3. Others
- 7.2. Market Analysis, Insights and Forecast - by Modality
- 7.2.1. Computed Tomography (CT)
- 7.2.2. Magnetic Resonance Imaging
- 7.2.3. Ultrasound
- 7.2.4. Mammography
- 7.2.5. Others
- 7.3. Market Analysis, Insights and Forecast - by Usage Mode
- 7.3.1. Thick Client Workstation
- 7.3.2. Thin Client Workstation
- 7.1. Market Analysis, Insights and Forecast - by Component
- 8. Asia Pacific Medical Imaging Displays Industry Analysis, Insights and Forecast, 2019-2031
- 8.1. Market Analysis, Insights and Forecast - by Component
- 8.1.1. Visualization Software
- 8.1.2. Display Units
- 8.1.3. Others
- 8.2. Market Analysis, Insights and Forecast - by Modality
- 8.2.1. Computed Tomography (CT)
- 8.2.2. Magnetic Resonance Imaging
- 8.2.3. Ultrasound
- 8.2.4. Mammography
- 8.2.5. Others
- 8.3. Market Analysis, Insights and Forecast - by Usage Mode
- 8.3.1. Thick Client Workstation
- 8.3.2. Thin Client Workstation
- 8.1. Market Analysis, Insights and Forecast - by Component
- 9. Middle East and Africa Medical Imaging Displays Industry Analysis, Insights and Forecast, 2019-2031
- 9.1. Market Analysis, Insights and Forecast - by Component
- 9.1.1. Visualization Software
- 9.1.2. Display Units
- 9.1.3. Others
- 9.2. Market Analysis, Insights and Forecast - by Modality
- 9.2.1. Computed Tomography (CT)
- 9.2.2. Magnetic Resonance Imaging
- 9.2.3. Ultrasound
- 9.2.4. Mammography
- 9.2.5. Others
- 9.3. Market Analysis, Insights and Forecast - by Usage Mode
- 9.3.1. Thick Client Workstation
- 9.3.2. Thin Client Workstation
- 9.1. Market Analysis, Insights and Forecast - by Component
- 10. South America Medical Imaging Displays Industry Analysis, Insights and Forecast, 2019-2031
- 10.1. Market Analysis, Insights and Forecast - by Component
- 10.1.1. Visualization Software
- 10.1.2. Display Units
- 10.1.3. Others
- 10.2. Market Analysis, Insights and Forecast - by Modality
- 10.2.1. Computed Tomography (CT)
- 10.2.2. Magnetic Resonance Imaging
- 10.2.3. Ultrasound
- 10.2.4. Mammography
- 10.2.5. Others
- 10.3. Market Analysis, Insights and Forecast - by Usage Mode
- 10.3.1. Thick Client Workstation
- 10.3.2. Thin Client Workstation
- 10.1. Market Analysis, Insights and Forecast - by Component
- 11. North America Medical Imaging Displays Industry Analysis, Insights and Forecast, 2019-2031
- 11.1. Market Analysis, Insights and Forecast - By Country/Sub-region
- 11.1.1 United States
- 11.1.2 Canada
- 11.1.3 Mexico
- 12. Europe Medical Imaging Displays Industry Analysis, Insights and Forecast, 2019-2031
- 12.1. Market Analysis, Insights and Forecast - By Country/Sub-region
- 12.1.1 Germany
- 12.1.2 United Kingdom
- 12.1.3 France
- 12.1.4 Italy
- 12.1.5 Spain
- 12.1.6 Rest of Europe
- 13. Asia Pacific Medical Imaging Displays Industry Analysis, Insights and Forecast, 2019-2031
- 13.1. Market Analysis, Insights and Forecast - By Country/Sub-region
- 13.1.1 China
- 13.1.2 Japan
- 13.1.3 India
- 13.1.4 Australia
- 13.1.5 South Korea
- 13.1.6 Rest of Asia Pacific
- 14. Middle East and Africa Medical Imaging Displays Industry Analysis, Insights and Forecast, 2019-2031
- 14.1. Market Analysis, Insights and Forecast - By Country/Sub-region
- 14.1.1 GCC
- 14.1.2 South Africa
- 14.1.3 Rest of Middle East and Africa
- 15. South America Medical Imaging Displays Industry Analysis, Insights and Forecast, 2019-2031
- 15.1. Market Analysis, Insights and Forecast - By Country/Sub-region
- 15.1.1 Brazil
- 15.1.2 Argentina
- 15.1.3 Rest of South America
- 16. Competitive Analysis
- 16.1. Global Market Share Analysis 2024
- 16.2. Company Profiles
- 16.2.1 Chimaera GmbH*List Not Exhaustive
- 16.2.1.1. Overview
- 16.2.1.2. Products
- 16.2.1.3. SWOT Analysis
- 16.2.1.4. Recent Developments
- 16.2.1.5. Financials (Based on Availability)
- 16.2.2 Esaote SpA
- 16.2.2.1. Overview
- 16.2.2.2. Products
- 16.2.2.3. SWOT Analysis
- 16.2.2.4. Recent Developments
- 16.2.2.5. Financials (Based on Availability)
- 16.2.3 Siemens Healthineers
- 16.2.3.1. Overview
- 16.2.3.2. Products
- 16.2.3.3. SWOT Analysis
- 16.2.3.4. Recent Developments
- 16.2.3.5. Financials (Based on Availability)
- 16.2.4 Hologic Inc
- 16.2.4.1. Overview
- 16.2.4.2. Products
- 16.2.4.3. SWOT Analysis
- 16.2.4.4. Recent Developments
- 16.2.4.5. Financials (Based on Availability)
- 16.2.5 GE Healthcare
- 16.2.5.1. Overview
- 16.2.5.2. Products
- 16.2.5.3. SWOT Analysis
- 16.2.5.4. Recent Developments
- 16.2.5.5. Financials (Based on Availability)
- 16.2.6 Koninklijke Philips N V
- 16.2.6.1. Overview
- 16.2.6.2. Products
- 16.2.6.3. SWOT Analysis
- 16.2.6.4. Recent Developments
- 16.2.6.5. Financials (Based on Availability)
- 16.2.7 PaxeraHealth
- 16.2.7.1. Overview
- 16.2.7.2. Products
- 16.2.7.3. SWOT Analysis
- 16.2.7.4. Recent Developments
- 16.2.7.5. Financials (Based on Availability)
- 16.2.8 Carestream Health
- 16.2.8.1. Overview
- 16.2.8.2. Products
- 16.2.8.3. SWOT Analysis
- 16.2.8.4. Recent Developments
- 16.2.8.5. Financials (Based on Availability)
- 16.2.9 NGI Group
- 16.2.9.1. Overview
- 16.2.9.2. Products
- 16.2.9.3. SWOT Analysis
- 16.2.9.4. Recent Developments
- 16.2.9.5. Financials (Based on Availability)
- 16.2.10 Medicor Imaging
- 16.2.10.1. Overview
- 16.2.10.2. Products
- 16.2.10.3. SWOT Analysis
- 16.2.10.4. Recent Developments
- 16.2.10.5. Financials (Based on Availability)
- 16.2.11 Carl Zeiss AG
- 16.2.11.1. Overview
- 16.2.11.2. Products
- 16.2.11.3. SWOT Analysis
- 16.2.11.4. Recent Developments
- 16.2.11.5. Financials (Based on Availability)
- 16.2.12 Capsa Healthcare
- 16.2.12.1. Overview
- 16.2.12.2. Products
- 16.2.12.3. SWOT Analysis
- 16.2.12.4. Recent Developments
- 16.2.12.5. Financials (Based on Availability)
- 16.2.1 Chimaera GmbH*List Not Exhaustive
List of Figures
- Figure 1: Global Medical Imaging Displays Industry Revenue Breakdown (Million, %) by Region 2024 & 2032
- Figure 2: North America Medical Imaging Displays Industry Revenue (Million), by Country 2024 & 2032
- Figure 3: North America Medical Imaging Displays Industry Revenue Share (%), by Country 2024 & 2032
- Figure 4: Europe Medical Imaging Displays Industry Revenue (Million), by Country 2024 & 2032
- Figure 5: Europe Medical Imaging Displays Industry Revenue Share (%), by Country 2024 & 2032
- Figure 6: Asia Pacific Medical Imaging Displays Industry Revenue (Million), by Country 2024 & 2032
- Figure 7: Asia Pacific Medical Imaging Displays Industry Revenue Share (%), by Country 2024 & 2032
- Figure 8: Middle East and Africa Medical Imaging Displays Industry Revenue (Million), by Country 2024 & 2032
- Figure 9: Middle East and Africa Medical Imaging Displays Industry Revenue Share (%), by Country 2024 & 2032
- Figure 10: South America Medical Imaging Displays Industry Revenue (Million), by Country 2024 & 2032
- Figure 11: South America Medical Imaging Displays Industry Revenue Share (%), by Country 2024 & 2032
- Figure 12: North America Medical Imaging Displays Industry Revenue (Million), by Component 2024 & 2032
- Figure 13: North America Medical Imaging Displays Industry Revenue Share (%), by Component 2024 & 2032
- Figure 14: North America Medical Imaging Displays Industry Revenue (Million), by Modality 2024 & 2032
- Figure 15: North America Medical Imaging Displays Industry Revenue Share (%), by Modality 2024 & 2032
- Figure 16: North America Medical Imaging Displays Industry Revenue (Million), by Usage Mode 2024 & 2032
- Figure 17: North America Medical Imaging Displays Industry Revenue Share (%), by Usage Mode 2024 & 2032
- Figure 18: North America Medical Imaging Displays Industry Revenue (Million), by Country 2024 & 2032
- Figure 19: North America Medical Imaging Displays Industry Revenue Share (%), by Country 2024 & 2032
- Figure 20: Europe Medical Imaging Displays Industry Revenue (Million), by Component 2024 & 2032
- Figure 21: Europe Medical Imaging Displays Industry Revenue Share (%), by Component 2024 & 2032
- Figure 22: Europe Medical Imaging Displays Industry Revenue (Million), by Modality 2024 & 2032
- Figure 23: Europe Medical Imaging Displays Industry Revenue Share (%), by Modality 2024 & 2032
- Figure 24: Europe Medical Imaging Displays Industry Revenue (Million), by Usage Mode 2024 & 2032
- Figure 25: Europe Medical Imaging Displays Industry Revenue Share (%), by Usage Mode 2024 & 2032
- Figure 26: Europe Medical Imaging Displays Industry Revenue (Million), by Country 2024 & 2032
- Figure 27: Europe Medical Imaging Displays Industry Revenue Share (%), by Country 2024 & 2032
- Figure 28: Asia Pacific Medical Imaging Displays Industry Revenue (Million), by Component 2024 & 2032
- Figure 29: Asia Pacific Medical Imaging Displays Industry Revenue Share (%), by Component 2024 & 2032
- Figure 30: Asia Pacific Medical Imaging Displays Industry Revenue (Million), by Modality 2024 & 2032
- Figure 31: Asia Pacific Medical Imaging Displays Industry Revenue Share (%), by Modality 2024 & 2032
- Figure 32: Asia Pacific Medical Imaging Displays Industry Revenue (Million), by Usage Mode 2024 & 2032
- Figure 33: Asia Pacific Medical Imaging Displays Industry Revenue Share (%), by Usage Mode 2024 & 2032
- Figure 34: Asia Pacific Medical Imaging Displays Industry Revenue (Million), by Country 2024 & 2032
- Figure 35: Asia Pacific Medical Imaging Displays Industry Revenue Share (%), by Country 2024 & 2032
- Figure 36: Middle East and Africa Medical Imaging Displays Industry Revenue (Million), by Component 2024 & 2032
- Figure 37: Middle East and Africa Medical Imaging Displays Industry Revenue Share (%), by Component 2024 & 2032
- Figure 38: Middle East and Africa Medical Imaging Displays Industry Revenue (Million), by Modality 2024 & 2032
- Figure 39: Middle East and Africa Medical Imaging Displays Industry Revenue Share (%), by Modality 2024 & 2032
- Figure 40: Middle East and Africa Medical Imaging Displays Industry Revenue (Million), by Usage Mode 2024 & 2032
- Figure 41: Middle East and Africa Medical Imaging Displays Industry Revenue Share (%), by Usage Mode 2024 & 2032
- Figure 42: Middle East and Africa Medical Imaging Displays Industry Revenue (Million), by Country 2024 & 2032
- Figure 43: Middle East and Africa Medical Imaging Displays Industry Revenue Share (%), by Country 2024 & 2032
- Figure 44: South America Medical Imaging Displays Industry Revenue (Million), by Component 2024 & 2032
- Figure 45: South America Medical Imaging Displays Industry Revenue Share (%), by Component 2024 & 2032
- Figure 46: South America Medical Imaging Displays Industry Revenue (Million), by Modality 2024 & 2032
- Figure 47: South America Medical Imaging Displays Industry Revenue Share (%), by Modality 2024 & 2032
- Figure 48: South America Medical Imaging Displays Industry Revenue (Million), by Usage Mode 2024 & 2032
- Figure 49: South America Medical Imaging Displays Industry Revenue Share (%), by Usage Mode 2024 & 2032
- Figure 50: South America Medical Imaging Displays Industry Revenue (Million), by Country 2024 & 2032
- Figure 51: South America Medical Imaging Displays Industry Revenue Share (%), by Country 2024 & 2032
List of Tables
- Table 1: Global Medical Imaging Displays Industry Revenue Million Forecast, by Region 2019 & 2032
- Table 2: Global Medical Imaging Displays Industry Revenue Million Forecast, by Component 2019 & 2032
- Table 3: Global Medical Imaging Displays Industry Revenue Million Forecast, by Modality 2019 & 2032
- Table 4: Global Medical Imaging Displays Industry Revenue Million Forecast, by Usage Mode 2019 & 2032
- Table 5: Global Medical Imaging Displays Industry Revenue Million Forecast, by Region 2019 & 2032
- Table 6: Global Medical Imaging Displays Industry Revenue Million Forecast, by Country 2019 & 2032
- Table 7: United States Medical Imaging Displays Industry Revenue (Million) Forecast, by Application 2019 & 2032
- Table 8: Canada Medical Imaging Displays Industry Revenue (Million) Forecast, by Application 2019 & 2032
- Table 9: Mexico Medical Imaging Displays Industry Revenue (Million) Forecast, by Application 2019 & 2032
- Table 10: Global Medical Imaging Displays Industry Revenue Million Forecast, by Country 2019 & 2032
- Table 11: Germany Medical Imaging Displays Industry Revenue (Million) Forecast, by Application 2019 & 2032
- Table 12: United Kingdom Medical Imaging Displays Industry Revenue (Million) Forecast, by Application 2019 & 2032
- Table 13: France Medical Imaging Displays Industry Revenue (Million) Forecast, by Application 2019 & 2032
- Table 14: Italy Medical Imaging Displays Industry Revenue (Million) Forecast, by Application 2019 & 2032
- Table 15: Spain Medical Imaging Displays Industry Revenue (Million) Forecast, by Application 2019 & 2032
- Table 16: Rest of Europe Medical Imaging Displays Industry Revenue (Million) Forecast, by Application 2019 & 2032
- Table 17: Global Medical Imaging Displays Industry Revenue Million Forecast, by Country 2019 & 2032
- Table 18: China Medical Imaging Displays Industry Revenue (Million) Forecast, by Application 2019 & 2032
- Table 19: Japan Medical Imaging Displays Industry Revenue (Million) Forecast, by Application 2019 & 2032
- Table 20: India Medical Imaging Displays Industry Revenue (Million) Forecast, by Application 2019 & 2032
- Table 21: Australia Medical Imaging Displays Industry Revenue (Million) Forecast, by Application 2019 & 2032
- Table 22: South Korea Medical Imaging Displays Industry Revenue (Million) Forecast, by Application 2019 & 2032
- Table 23: Rest of Asia Pacific Medical Imaging Displays Industry Revenue (Million) Forecast, by Application 2019 & 2032
- Table 24: Global Medical Imaging Displays Industry Revenue Million Forecast, by Country 2019 & 2032
- Table 25: GCC Medical Imaging Displays Industry Revenue (Million) Forecast, by Application 2019 & 2032
- Table 26: South Africa Medical Imaging Displays Industry Revenue (Million) Forecast, by Application 2019 & 2032
- Table 27: Rest of Middle East and Africa Medical Imaging Displays Industry Revenue (Million) Forecast, by Application 2019 & 2032
- Table 28: Global Medical Imaging Displays Industry Revenue Million Forecast, by Country 2019 & 2032
- Table 29: Brazil Medical Imaging Displays Industry Revenue (Million) Forecast, by Application 2019 & 2032
- Table 30: Argentina Medical Imaging Displays Industry Revenue (Million) Forecast, by Application 2019 & 2032
- Table 31: Rest of South America Medical Imaging Displays Industry Revenue (Million) Forecast, by Application 2019 & 2032
- Table 32: Global Medical Imaging Displays Industry Revenue Million Forecast, by Component 2019 & 2032
- Table 33: Global Medical Imaging Displays Industry Revenue Million Forecast, by Modality 2019 & 2032
- Table 34: Global Medical Imaging Displays Industry Revenue Million Forecast, by Usage Mode 2019 & 2032
- Table 35: Global Medical Imaging Displays Industry Revenue Million Forecast, by Country 2019 & 2032
- Table 36: United States Medical Imaging Displays Industry Revenue (Million) Forecast, by Application 2019 & 2032
- Table 37: Canada Medical Imaging Displays Industry Revenue (Million) Forecast, by Application 2019 & 2032
- Table 38: Mexico Medical Imaging Displays Industry Revenue (Million) Forecast, by Application 2019 & 2032
- Table 39: Global Medical Imaging Displays Industry Revenue Million Forecast, by Component 2019 & 2032
- Table 40: Global Medical Imaging Displays Industry Revenue Million Forecast, by Modality 2019 & 2032
- Table 41: Global Medical Imaging Displays Industry Revenue Million Forecast, by Usage Mode 2019 & 2032
- Table 42: Global Medical Imaging Displays Industry Revenue Million Forecast, by Country 2019 & 2032
- Table 43: Germany Medical Imaging Displays Industry Revenue (Million) Forecast, by Application 2019 & 2032
- Table 44: United Kingdom Medical Imaging Displays Industry Revenue (Million) Forecast, by Application 2019 & 2032
- Table 45: France Medical Imaging Displays Industry Revenue (Million) Forecast, by Application 2019 & 2032
- Table 46: Italy Medical Imaging Displays Industry Revenue (Million) Forecast, by Application 2019 & 2032
- Table 47: Spain Medical Imaging Displays Industry Revenue (Million) Forecast, by Application 2019 & 2032
- Table 48: Rest of Europe Medical Imaging Displays Industry Revenue (Million) Forecast, by Application 2019 & 2032
- Table 49: Global Medical Imaging Displays Industry Revenue Million Forecast, by Component 2019 & 2032
- Table 50: Global Medical Imaging Displays Industry Revenue Million Forecast, by Modality 2019 & 2032
- Table 51: Global Medical Imaging Displays Industry Revenue Million Forecast, by Usage Mode 2019 & 2032
- Table 52: Global Medical Imaging Displays Industry Revenue Million Forecast, by Country 2019 & 2032
- Table 53: China Medical Imaging Displays Industry Revenue (Million) Forecast, by Application 2019 & 2032
- Table 54: Japan Medical Imaging Displays Industry Revenue (Million) Forecast, by Application 2019 & 2032
- Table 55: India Medical Imaging Displays Industry Revenue (Million) Forecast, by Application 2019 & 2032
- Table 56: Australia Medical Imaging Displays Industry Revenue (Million) Forecast, by Application 2019 & 2032
- Table 57: South Korea Medical Imaging Displays Industry Revenue (Million) Forecast, by Application 2019 & 2032
- Table 58: Rest of Asia Pacific Medical Imaging Displays Industry Revenue (Million) Forecast, by Application 2019 & 2032
- Table 59: Global Medical Imaging Displays Industry Revenue Million Forecast, by Component 2019 & 2032
- Table 60: Global Medical Imaging Displays Industry Revenue Million Forecast, by Modality 2019 & 2032
- Table 61: Global Medical Imaging Displays Industry Revenue Million Forecast, by Usage Mode 2019 & 2032
- Table 62: Global Medical Imaging Displays Industry Revenue Million Forecast, by Country 2019 & 2032
- Table 63: GCC Medical Imaging Displays Industry Revenue (Million) Forecast, by Application 2019 & 2032
- Table 64: South Africa Medical Imaging Displays Industry Revenue (Million) Forecast, by Application 2019 & 2032
- Table 65: Rest of Middle East and Africa Medical Imaging Displays Industry Revenue (Million) Forecast, by Application 2019 & 2032
- Table 66: Global Medical Imaging Displays Industry Revenue Million Forecast, by Component 2019 & 2032
- Table 67: Global Medical Imaging Displays Industry Revenue Million Forecast, by Modality 2019 & 2032
- Table 68: Global Medical Imaging Displays Industry Revenue Million Forecast, by Usage Mode 2019 & 2032
- Table 69: Global Medical Imaging Displays Industry Revenue Million Forecast, by Country 2019 & 2032
- Table 70: Brazil Medical Imaging Displays Industry Revenue (Million) Forecast, by Application 2019 & 2032
- Table 71: Argentina Medical Imaging Displays Industry Revenue (Million) Forecast, by Application 2019 & 2032
- Table 72: Rest of South America Medical Imaging Displays Industry Revenue (Million) Forecast, by Application 2019 & 2032
Frequently Asked Questions
1. What is the projected Compound Annual Growth Rate (CAGR) of the Medical Imaging Displays Industry?
The projected CAGR is approximately 6.99%.
2. Which companies are prominent players in the Medical Imaging Displays Industry?
Key companies in the market include Chimaera GmbH*List Not Exhaustive, Esaote SpA, Siemens Healthineers, Hologic Inc, GE Healthcare, Koninklijke Philips N V, PaxeraHealth, Carestream Health, NGI Group, Medicor Imaging, Carl Zeiss AG, Capsa Healthcare.
3. What are the main segments of the Medical Imaging Displays Industry?
The market segments include Component, Modality, Usage Mode.
4. Can you provide details about the market size?
The market size is estimated to be USD 6.21 Million as of 2022.
5. What are some drivers contributing to market growth?
Technological Advancements in The Imaging Technologies and Use of Artificial Intelligence; Rising Healthcare Expenditure Coupled with Rising Disease Burden.
6. What are the notable trends driving market growth?
Ultrasound is Expected to Hold the Major Market Share in the Medical Imaging Workstation Market.
7. Are there any restraints impacting market growth?
High Cost of Medical Imaging Equipment; Lack of Skilled Professionals.
8. Can you provide examples of recent developments in the market?
N/A
9. What pricing options are available for accessing the report?
Pricing options include single-user, multi-user, and enterprise licenses priced at USD 4750, USD 5250, and USD 8750 respectively.
10. Is the market size provided in terms of value or volume?
The market size is provided in terms of value, measured in Million.
11. Are there any specific market keywords associated with the report?
Yes, the market keyword associated with the report is "Medical Imaging Displays Industry," which aids in identifying and referencing the specific market segment covered.
12. How do I determine which pricing option suits my needs best?
The pricing options vary based on user requirements and access needs. Individual users may opt for single-user licenses, while businesses requiring broader access may choose multi-user or enterprise licenses for cost-effective access to the report.
13. Are there any additional resources or data provided in the Medical Imaging Displays Industry report?
While the report offers comprehensive insights, it's advisable to review the specific contents or supplementary materials provided to ascertain if additional resources or data are available.
14. How can I stay updated on further developments or reports in the Medical Imaging Displays Industry?
To stay informed about further developments, trends, and reports in the Medical Imaging Displays Industry, consider subscribing to industry newsletters, following relevant companies and organizations, or regularly checking reputable industry news sources and publications.
Methodology
Step 1 - Identification of Relevant Samples Size from Population Database


Step 2 - Approaches for Defining Global Market Size (Value, Volume* & Price*)

Note*: In applicable scenarios
Step 3 - Data Sources
Primary Research
- Web Analytics
- Survey Reports
- Research Institute
- Latest Research Reports
- Opinion Leaders
Secondary Research
- Annual Reports
- White Paper
- Latest Press Release
- Industry Association
- Paid Database
- Investor Presentations

Step 4 - Data Triangulation
Involves using different sources of information in order to increase the validity of a study
These sources are likely to be stakeholders in a program - participants, other researchers, program staff, other community members, and so on.
Then we put all data in single framework & apply various statistical tools to find out the dynamic on the market.
During the analysis stage, feedback from the stakeholder groups would be compared to determine areas of agreement as well as areas of divergence
