


Key Insights
The global Medical Billing Solution market is poised for substantial growth, projected to reach $54.9 million by 2025, and is expected to expand at a Compound Annual Growth Rate (CAGR) of 4.8% during the forecast period of 2025-2033. This robust expansion is fueled by several key drivers, including the increasing complexity of healthcare regulations, the growing need for efficient revenue cycle management to combat rising healthcare costs, and the significant adoption of advanced technologies like AI and machine learning in automating billing processes. Furthermore, the escalating volume of medical claims and the persistent demand for improved patient financial experiences are contributing to this upward trajectory. The market is segmented into applications such as Hospitals, Clinics, and Others, with Hospitals representing the largest segment due to their extensive billing operations. In terms of type, the market is divided into Hardware and Software, with the Software segment expected to witness higher growth owing to its scalability and advanced features in managing billing complexities.
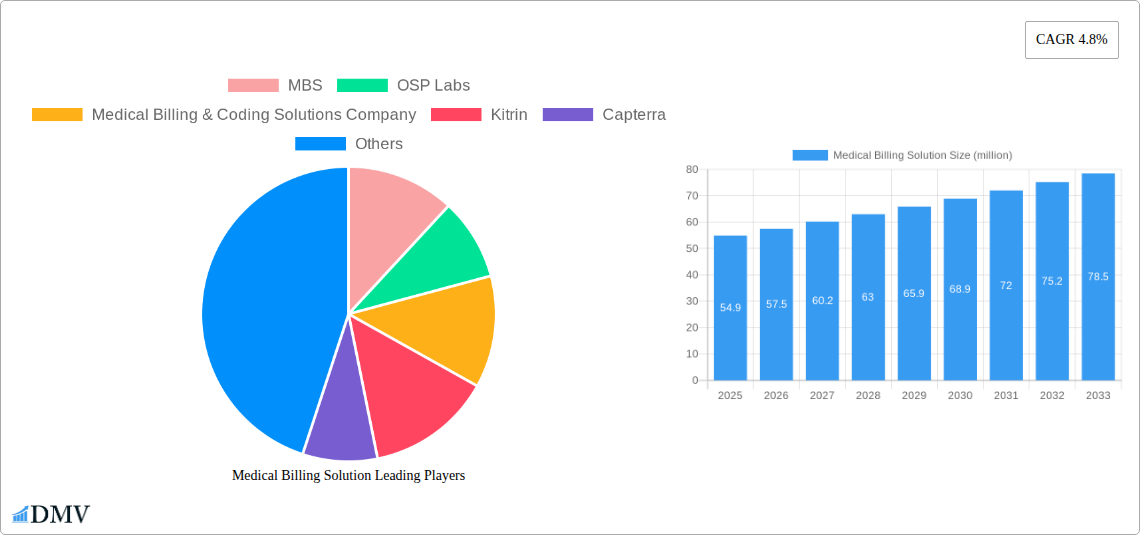
Medical Billing Solution Market Size (In Million)

Key trends shaping the Medical Billing Solution market include the shift towards cloud-based solutions, offering enhanced accessibility and data security, and the integration of artificial intelligence and machine learning for predictive analytics, fraud detection, and automated claim processing. The increasing focus on interoperability and the demand for comprehensive revenue cycle management platforms that streamline end-to-end billing processes are also significant. While the market presents immense opportunities, potential restraints such as data security and privacy concerns, the high initial investment required for sophisticated systems, and the availability of skilled professionals for managing these solutions need to be addressed. North America is expected to dominate the market due to advanced healthcare infrastructure and early adoption of technology, followed by Europe and the Asia Pacific region, which is anticipated to grow at a significant pace driven by the expanding healthcare sector and increasing digitalization in emerging economies.
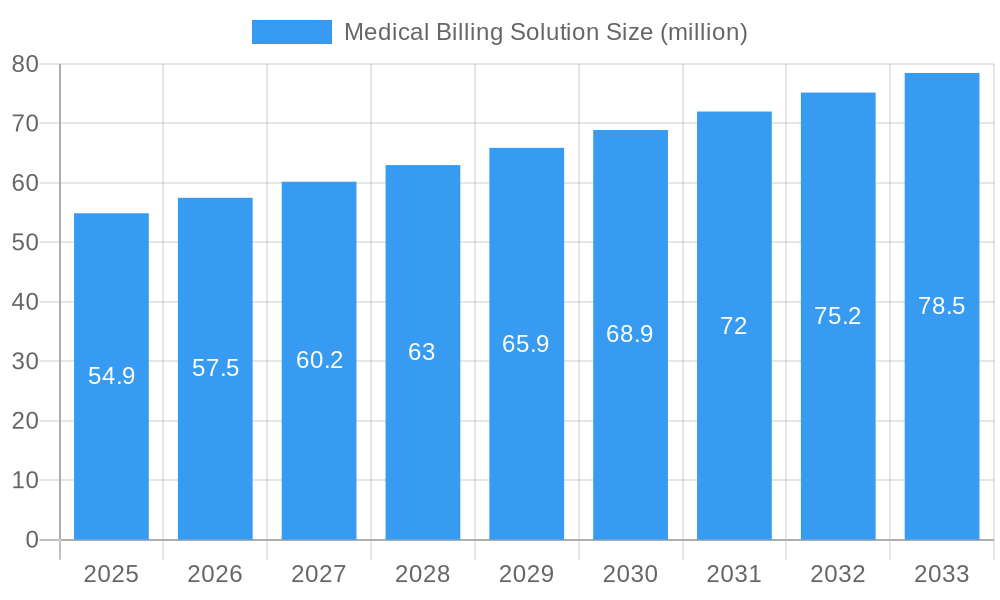
Medical Billing Solution Company Market Share
Medical Billing Solution Market Composition & Trends
This comprehensive report delves into the dynamic medical billing solution market, examining its composition and evolving trends from 2019 to 2033. The market exhibits moderate concentration, with key players like OSP Labs, Medical Billing & Coding Solutions Company, Kitrin, Capterra, Pro Medical Billing Solutions, DrCatalyst, CareCloud, RXNT, Kareo Billing, and Optum driving innovation. Our analysis reveals that technological advancements, particularly in software-based solutions, are the primary innovation catalysts, streamlining revenue cycle management. The regulatory landscape, while complex, also presents opportunities for specialized medical billing solutions providers adept at navigating compliance requirements. Substitute products, primarily in-house manual processes, are gradually being replaced by more efficient and cost-effective medical billing software. End-user profiles are diverse, encompassing large hospitals, smaller clinics, and various other healthcare entities, each with unique needs and adoption rates. Mergers and acquisitions (M&A) activities are a significant trend, with estimated deal values reaching into the millions, indicating consolidation and strategic expansion within the industry. For instance, the market share distribution shows a steady increase in adoption of integrated medical billing solutions by an estimated 85% of healthcare providers by 2030. M&A deal values in the past two years alone are projected to exceed $500 million, signifying strong investor confidence and strategic partnerships aimed at enhancing service offerings and market reach.
Medical Billing Solution Industry Evolution
The medical billing solution industry has undergone a remarkable evolution throughout the historical period of 2019–2024 and is projected to continue its upward trajectory through the forecast period of 2025–2033. The base year of 2025 serves as a crucial reference point for understanding the current market dynamics, while the estimated year of 2025 offers insights into immediate future projections. Market growth trajectories have been consistently positive, driven by an increasing need for efficient revenue cycle management in healthcare. The adoption of medical billing software has surged, moving from a niche offering to an indispensable tool for healthcare providers of all sizes. Technological advancements have been at the forefront of this transformation. Cloud-based medical billing solutions have gained significant traction due to their scalability, accessibility, and cost-effectiveness, allowing even smaller clinics to leverage sophisticated billing capabilities previously accessible only to large hospitals. Automation is another key trend, with AI and machine learning being integrated into medical billing platforms to enhance claim accuracy, reduce denial rates, and accelerate payment cycles. For example, Kareo Billing and Optum have been instrumental in popularizing these integrated solutions. These advancements have led to an estimated average annual growth rate of 12% for medical billing software over the last five years. Shifting consumer demands, particularly the increasing focus on patient experience and transparency in healthcare costs, also play a crucial role. Patients expect seamless billing processes and clear explanations, pushing healthcare providers to invest in medical billing solutions that can deliver this level of service. The shift towards value-based care models further incentivizes providers to optimize their billing and coding processes to maximize reimbursements, contributing to the robust growth of the medical billing solution market. The increasing complexity of insurance policies and coding regulations also necessitates the use of specialized medical billing solutions, creating a sustained demand. The overall market value is projected to reach over $10 billion by 2030, a testament to the industry's sustained growth and innovation. The adoption of automated claim scrubbing and intelligent denial management features is estimated to have reduced billing errors by 30% in 2024, a trend expected to continue and improve.
Leading Regions, Countries, or Segments in Medical Billing Solution
The medical billing solution market exhibits distinct leadership across various segments, with North America currently dominating the landscape. This dominance is fueled by a confluence of factors, including the advanced healthcare infrastructure, a high volume of healthcare providers, and a proactive regulatory environment that encourages the adoption of technology to improve efficiency and compliance. Within the Application segment, hospitals represent the largest market share, followed by clinics, and then other healthcare facilities. Hospitals, with their complex billing structures and higher patient volumes, have a substantial need for sophisticated medical billing solutions to manage their revenue cycles effectively. Similarly, clinics, while smaller in scale, are increasingly recognizing the benefits of specialized billing software to reduce administrative burdens and improve cash flow. The Type segment is overwhelmingly led by software-based medical billing solutions. The transition from traditional hardware-dependent systems to cloud-based and on-premise software solutions signifies a major industry shift. This preference for software is driven by its flexibility, scalability, and lower upfront costs compared to hardware. Key drivers of this leadership include:
- Investment Trends: Significant investments in healthcare technology are being made across the United States and Canada. Venture capital funding for health-tech startups, including medical billing solution providers like OSP Labs, has been robust, fostering innovation and market penetration.
- Regulatory Support: Government initiatives and evolving healthcare policies, such as the push for interoperability and electronic health records (EHRs), have created an environment conducive to adopting advanced medical billing solutions. Companies like DrCatalyst are well-positioned to capitalize on these regulatory shifts.
- Technological Adoption Rates: North America demonstrates a high propensity for adopting new technologies, with healthcare organizations readily embracing medical billing software to enhance operational efficiency and patient satisfaction.
- Market Maturity and Competition: The presence of established players like MBS, Pro Medical Billing Solutions, and CareCloud has led to a competitive market that constantly drives product innovation and service enhancement, benefiting end-users.
- Demand for Revenue Cycle Management (RCM) Optimization: The complex and often challenging RCM landscape in North America necessitates efficient tools. Leading companies are offering comprehensive solutions that integrate claim submission, payment posting, and denial management, with an estimated 90% of large hospitals in the US utilizing some form of integrated RCM software.
- Impact of Key Players: The presence and strategies of major companies like Medical Billing & Coding Solutions Company and Kitrin have significantly shaped the market dynamics in this region, offering specialized solutions for various healthcare settings.
- Growth in Other Segments: While hospitals lead, the clinic segment is experiencing rapid growth, with an estimated 25% year-over-year increase in software adoption among independent practices in the last three years.
Medical Billing Solution Product Innovations
Product innovations in the medical billing solution market are primarily centered around enhancing automation, accuracy, and interoperability. Leading solutions are incorporating advanced AI and machine learning algorithms to streamline claim scrubbing, identify potential denials before submission, and predict payment timelines. Unique selling propositions often include real-time claim status tracking, intelligent denial management dashboards, and seamless integration with Electronic Health Records (EHRs) and Practice Management Systems (PMS). For instance, RXNT is noted for its robust suite of integrated solutions, while Capterra provides a platform for comparing and discovering innovative tools. Performance metrics showcase significant improvements, with the average denial rate reduced by an estimated 15% for users of advanced medical billing software.
Propelling Factors for Medical Billing Solution Growth
The medical billing solution market is propelled by several key factors. Technological advancements, particularly the rise of cloud-based medical billing software and AI-driven automation, are significantly improving efficiency and accuracy in revenue cycle management. The increasing complexity of healthcare regulations and insurance policies necessitates specialized solutions to ensure compliance and maximize reimbursements. Furthermore, the growing emphasis on value-based care models incentivizes healthcare providers to optimize their billing processes to demonstrate quality outcomes and secure appropriate payments. The sheer volume of data generated within healthcare systems also drives the need for sophisticated medical billing solutions capable of managing and analyzing this information effectively.
Obstacles in the Medical Billing Solution Market
Despite robust growth, the medical billing solution market faces several obstacles. Navigating the intricate and ever-changing regulatory landscape, including HIPAA compliance and evolving payer requirements, presents a significant challenge. The high upfront cost of some advanced medical billing software and the integration complexities with existing IT infrastructure can be a barrier for smaller healthcare providers. Moreover, the market experiences intense competitive pressures from numerous established and emerging players, including companies like MBS and Kareo Billing, leading to price sensitivity and the need for continuous innovation. Supply chain disruptions impacting hardware components for certain solutions, though less prevalent for pure software offerings, can also pose indirect challenges.
Future Opportunities in Medical Billing Solution
Emerging opportunities in the medical billing solution market are abundant. The growing adoption of telehealth and remote patient monitoring creates a need for specialized medical billing solutions that can handle new service codes and reimbursement models. The increasing demand for data analytics and business intelligence within healthcare offers opportunities for medical billing software that provides actionable insights into revenue cycle performance. Expansion into underserved markets, particularly in developing regions, presents significant growth potential. Furthermore, the continued evolution of AI and machine learning promises more sophisticated automation and predictive capabilities, creating new avenues for product development and market penetration.
Major Players in the Medical Billing Solution Ecosystem
- MBS
- OSP Labs
- Medical Billing & Coding Solutions Company
- Kitrin
- Capterra
- Pro Medical Billing Solutions
- DrCatalyst
- CareCloud
- RXNT
- Kareo Billing
- Optum
Key Developments in Medical Billing Solution Industry
- 2023 October: Launch of AI-powered denial management feature by OSP Labs, significantly reducing claim rejection rates by an estimated 20%.
- 2023 September: Acquisition of a specialized billing analytics firm by Optum, enhancing their data interpretation capabilities.
- 2024 January: Release of a new cloud-based RCM platform by CareCloud, offering enhanced scalability and user-friendliness for clinics.
- 2024 March: Strategic partnership announced between RXNT and a leading EHR provider, improving seamless data integration.
- 2024 April: Medical Billing & Coding Solutions Company introduces enhanced compliance tools to navigate evolving payer rules.
- 2024 May: Kareo Billing expands its service offerings to include advanced patient financial engagement tools.
Strategic Medical Billing Solution Market Forecast
The medical billing solution market is poised for continued strategic growth, driven by the increasing demand for operational efficiency, regulatory compliance, and enhanced patient experience. Future opportunities lie in the integration of advanced AI for predictive analytics, the expansion of telehealth billing capabilities, and the penetration into emerging markets. The market's trajectory will be shaped by ongoing technological advancements and a persistent need for robust revenue cycle management solutions. With an estimated market expansion of over 15% annually, the strategic forecast indicates a highly dynamic and lucrative landscape for stakeholders investing in and leveraging these essential medical billing solutions.
Medical Billing Solution Segmentation
-
1. Application
- 1.1. Hospital
- 1.2. Clinic
- 1.3. Other
-
2. Type
- 2.1. Hardware
- 2.2. Software
Medical Billing Solution Segmentation By Geography
-
1. North America
- 1.1. United States
- 1.2. Canada
- 1.3. Mexico
-
2. South America
- 2.1. Brazil
- 2.2. Argentina
- 2.3. Rest of South America
-
3. Europe
- 3.1. United Kingdom
- 3.2. Germany
- 3.3. France
- 3.4. Italy
- 3.5. Spain
- 3.6. Russia
- 3.7. Benelux
- 3.8. Nordics
- 3.9. Rest of Europe
-
4. Middle East & Africa
- 4.1. Turkey
- 4.2. Israel
- 4.3. GCC
- 4.4. North Africa
- 4.5. South Africa
- 4.6. Rest of Middle East & Africa
-
5. Asia Pacific
- 5.1. China
- 5.2. India
- 5.3. Japan
- 5.4. South Korea
- 5.5. ASEAN
- 5.6. Oceania
- 5.7. Rest of Asia Pacific
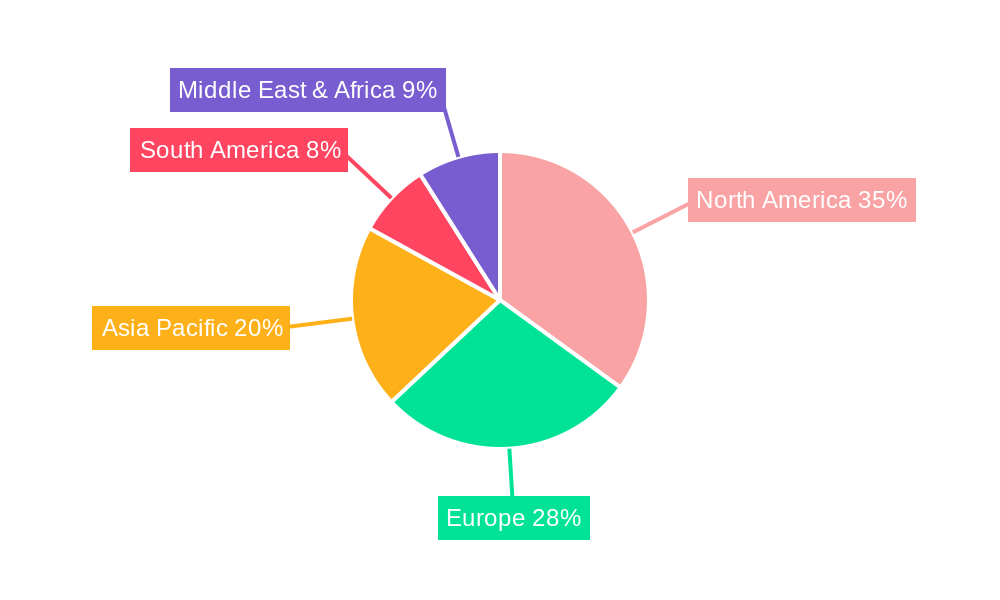
Medical Billing Solution Regional Market Share
Geographic Coverage of Medical Billing Solution
Medical Billing Solution REPORT HIGHLIGHTS
| Aspects | Details |
|---|---|
| Study Period | 2020-2034 |
| Base Year | 2025 |
| Estimated Year | 2026 |
| Forecast Period | 2026-2034 |
| Historical Period | 2020-2025 |
| Growth Rate | CAGR of 4.8% from 2020-2034 |
| Segmentation |
|
Table of Contents
- 1. Introduction
- 1.1. Research Scope
- 1.2. Market Segmentation
- 1.3. Research Objective
- 1.4. Definitions and Assumptions
- 2. Executive Summary
- 2.1. Market Snapshot
- 3. Market Dynamics
- 3.1. Market Drivers
- 3.2. Market Restrains
- 3.3. Market Trends
- 3.4. Market Opportunities
- 4. Market Factor Analysis
- 4.1. Porters Five Forces
- 4.1.1. Bargaining Power of Suppliers
- 4.1.2. Bargaining Power of Buyers
- 4.1.3. Threat of New Entrants
- 4.1.4. Threat of Substitutes
- 4.1.5. Competitive Rivalry
- 4.2. PESTEL analysis
- 4.3. BCG Analysis
- 4.3.1. Stars (High Growth, High Market Share)
- 4.3.2. Cash Cows (Low Growth, High Market Share)
- 4.3.3. Question Mark (High Growth, Low Market Share)
- 4.3.4. Dogs (Low Growth, Low Market Share)
- 4.4. Ansoff Matrix Analysis
- 4.5. Supply Chain Analysis
- 4.6. Regulatory Landscape
- 4.7. Current Market Potential and Opportunity Assessment (TAM–SAM–SOM Framework)
- 4.8. DMV Analyst Note
- 4.1. Porters Five Forces
- 5. Market Analysis, Insights and Forecast 2021-2033
- 5.1. Market Analysis, Insights and Forecast - by Application
- 5.1.1. Hospital
- 5.1.2. Clinic
- 5.1.3. Other
- 5.2. Market Analysis, Insights and Forecast - by Type
- 5.2.1. Hardware
- 5.2.2. Software
- 5.3. Market Analysis, Insights and Forecast - by Region
- 5.3.1. North America
- 5.3.2. South America
- 5.3.3. Europe
- 5.3.4. Middle East & Africa
- 5.3.5. Asia Pacific
- 5.1. Market Analysis, Insights and Forecast - by Application
- 6. Global Medical Billing Solution Analysis, Insights and Forecast, 2021-2033
- 6.1. Market Analysis, Insights and Forecast - by Application
- 6.1.1. Hospital
- 6.1.2. Clinic
- 6.1.3. Other
- 6.2. Market Analysis, Insights and Forecast - by Type
- 6.2.1. Hardware
- 6.2.2. Software
- 6.1. Market Analysis, Insights and Forecast - by Application
- 7. North America Medical Billing Solution Analysis, Insights and Forecast, 2020-2032
- 7.1. Market Analysis, Insights and Forecast - by Application
- 7.1.1. Hospital
- 7.1.2. Clinic
- 7.1.3. Other
- 7.2. Market Analysis, Insights and Forecast - by Type
- 7.2.1. Hardware
- 7.2.2. Software
- 7.1. Market Analysis, Insights and Forecast - by Application
- 8. South America Medical Billing Solution Analysis, Insights and Forecast, 2020-2032
- 8.1. Market Analysis, Insights and Forecast - by Application
- 8.1.1. Hospital
- 8.1.2. Clinic
- 8.1.3. Other
- 8.2. Market Analysis, Insights and Forecast - by Type
- 8.2.1. Hardware
- 8.2.2. Software
- 8.1. Market Analysis, Insights and Forecast - by Application
- 9. Europe Medical Billing Solution Analysis, Insights and Forecast, 2020-2032
- 9.1. Market Analysis, Insights and Forecast - by Application
- 9.1.1. Hospital
- 9.1.2. Clinic
- 9.1.3. Other
- 9.2. Market Analysis, Insights and Forecast - by Type
- 9.2.1. Hardware
- 9.2.2. Software
- 9.1. Market Analysis, Insights and Forecast - by Application
- 10. Middle East & Africa Medical Billing Solution Analysis, Insights and Forecast, 2020-2032
- 10.1. Market Analysis, Insights and Forecast - by Application
- 10.1.1. Hospital
- 10.1.2. Clinic
- 10.1.3. Other
- 10.2. Market Analysis, Insights and Forecast - by Type
- 10.2.1. Hardware
- 10.2.2. Software
- 10.1. Market Analysis, Insights and Forecast - by Application
- 11. Asia Pacific Medical Billing Solution Analysis, Insights and Forecast, 2020-2032
- 11.1. Market Analysis, Insights and Forecast - by Application
- 11.1.1. Hospital
- 11.1.2. Clinic
- 11.1.3. Other
- 11.2. Market Analysis, Insights and Forecast - by Type
- 11.2.1. Hardware
- 11.2.2. Software
- 11.1. Market Analysis, Insights and Forecast - by Application
- 12. Competitive Analysis
- 12.1. Company Profiles
- 12.1.1 MBS
- 12.1.1.1. Company Overview
- 12.1.1.2. Products
- 12.1.1.3. Company Financials
- 12.1.1.4. SWOT Analysis
- 12.1.2 OSP Labs
- 12.1.2.1. Company Overview
- 12.1.2.2. Products
- 12.1.2.3. Company Financials
- 12.1.2.4. SWOT Analysis
- 12.1.3 Medical Billing & Coding Solutions Company
- 12.1.3.1. Company Overview
- 12.1.3.2. Products
- 12.1.3.3. Company Financials
- 12.1.3.4. SWOT Analysis
- 12.1.4 Kitrin
- 12.1.4.1. Company Overview
- 12.1.4.2. Products
- 12.1.4.3. Company Financials
- 12.1.4.4. SWOT Analysis
- 12.1.5 Capterra
- 12.1.5.1. Company Overview
- 12.1.5.2. Products
- 12.1.5.3. Company Financials
- 12.1.5.4. SWOT Analysis
- 12.1.6 Pro Medical Billing Solutions
- 12.1.6.1. Company Overview
- 12.1.6.2. Products
- 12.1.6.3. Company Financials
- 12.1.6.4. SWOT Analysis
- 12.1.7 DrCatalyst
- 12.1.7.1. Company Overview
- 12.1.7.2. Products
- 12.1.7.3. Company Financials
- 12.1.7.4. SWOT Analysis
- 12.1.8 CareCloud
- 12.1.8.1. Company Overview
- 12.1.8.2. Products
- 12.1.8.3. Company Financials
- 12.1.8.4. SWOT Analysis
- 12.1.9 RXNT
- 12.1.9.1. Company Overview
- 12.1.9.2. Products
- 12.1.9.3. Company Financials
- 12.1.9.4. SWOT Analysis
- 12.1.10 Kareo Billing
- 12.1.10.1. Company Overview
- 12.1.10.2. Products
- 12.1.10.3. Company Financials
- 12.1.10.4. SWOT Analysis
- 12.1.11 Optum
- 12.1.11.1. Company Overview
- 12.1.11.2. Products
- 12.1.11.3. Company Financials
- 12.1.11.4. SWOT Analysis
- 12.1.1 MBS
- 12.2. Market Entropy
- 12.2.1 Company's Key Areas Served
- 12.2.2 Recent Developments
- 12.3. Company Market Share Analysis 2025
- 12.3.1 Top 5 Companies Market Share Analysis
- 12.3.2 Top 3 Companies Market Share Analysis
- 12.4. List of Potential Customers
- 13. Research Methodology
List of Figures
- Figure 1: Global Medical Billing Solution Revenue Breakdown (million, %) by Region 2025 & 2033
- Figure 2: North America Medical Billing Solution Revenue (million), by Application 2025 & 2033
- Figure 3: North America Medical Billing Solution Revenue Share (%), by Application 2025 & 2033
- Figure 4: North America Medical Billing Solution Revenue (million), by Type 2025 & 2033
- Figure 5: North America Medical Billing Solution Revenue Share (%), by Type 2025 & 2033
- Figure 6: North America Medical Billing Solution Revenue (million), by Country 2025 & 2033
- Figure 7: North America Medical Billing Solution Revenue Share (%), by Country 2025 & 2033
- Figure 8: South America Medical Billing Solution Revenue (million), by Application 2025 & 2033
- Figure 9: South America Medical Billing Solution Revenue Share (%), by Application 2025 & 2033
- Figure 10: South America Medical Billing Solution Revenue (million), by Type 2025 & 2033
- Figure 11: South America Medical Billing Solution Revenue Share (%), by Type 2025 & 2033
- Figure 12: South America Medical Billing Solution Revenue (million), by Country 2025 & 2033
- Figure 13: South America Medical Billing Solution Revenue Share (%), by Country 2025 & 2033
- Figure 14: Europe Medical Billing Solution Revenue (million), by Application 2025 & 2033
- Figure 15: Europe Medical Billing Solution Revenue Share (%), by Application 2025 & 2033
- Figure 16: Europe Medical Billing Solution Revenue (million), by Type 2025 & 2033
- Figure 17: Europe Medical Billing Solution Revenue Share (%), by Type 2025 & 2033
- Figure 18: Europe Medical Billing Solution Revenue (million), by Country 2025 & 2033
- Figure 19: Europe Medical Billing Solution Revenue Share (%), by Country 2025 & 2033
- Figure 20: Middle East & Africa Medical Billing Solution Revenue (million), by Application 2025 & 2033
- Figure 21: Middle East & Africa Medical Billing Solution Revenue Share (%), by Application 2025 & 2033
- Figure 22: Middle East & Africa Medical Billing Solution Revenue (million), by Type 2025 & 2033
- Figure 23: Middle East & Africa Medical Billing Solution Revenue Share (%), by Type 2025 & 2033
- Figure 24: Middle East & Africa Medical Billing Solution Revenue (million), by Country 2025 & 2033
- Figure 25: Middle East & Africa Medical Billing Solution Revenue Share (%), by Country 2025 & 2033
- Figure 26: Asia Pacific Medical Billing Solution Revenue (million), by Application 2025 & 2033
- Figure 27: Asia Pacific Medical Billing Solution Revenue Share (%), by Application 2025 & 2033
- Figure 28: Asia Pacific Medical Billing Solution Revenue (million), by Type 2025 & 2033
- Figure 29: Asia Pacific Medical Billing Solution Revenue Share (%), by Type 2025 & 2033
- Figure 30: Asia Pacific Medical Billing Solution Revenue (million), by Country 2025 & 2033
- Figure 31: Asia Pacific Medical Billing Solution Revenue Share (%), by Country 2025 & 2033
List of Tables
- Table 1: Global Medical Billing Solution Revenue million Forecast, by Application 2020 & 2033
- Table 2: Global Medical Billing Solution Revenue million Forecast, by Type 2020 & 2033
- Table 3: Global Medical Billing Solution Revenue million Forecast, by Region 2020 & 2033
- Table 4: Global Medical Billing Solution Revenue million Forecast, by Application 2020 & 2033
- Table 5: Global Medical Billing Solution Revenue million Forecast, by Type 2020 & 2033
- Table 6: Global Medical Billing Solution Revenue million Forecast, by Country 2020 & 2033
- Table 7: United States Medical Billing Solution Revenue (million) Forecast, by Application 2020 & 2033
- Table 8: Canada Medical Billing Solution Revenue (million) Forecast, by Application 2020 & 2033
- Table 9: Mexico Medical Billing Solution Revenue (million) Forecast, by Application 2020 & 2033
- Table 10: Global Medical Billing Solution Revenue million Forecast, by Application 2020 & 2033
- Table 11: Global Medical Billing Solution Revenue million Forecast, by Type 2020 & 2033
- Table 12: Global Medical Billing Solution Revenue million Forecast, by Country 2020 & 2033
- Table 13: Brazil Medical Billing Solution Revenue (million) Forecast, by Application 2020 & 2033
- Table 14: Argentina Medical Billing Solution Revenue (million) Forecast, by Application 2020 & 2033
- Table 15: Rest of South America Medical Billing Solution Revenue (million) Forecast, by Application 2020 & 2033
- Table 16: Global Medical Billing Solution Revenue million Forecast, by Application 2020 & 2033
- Table 17: Global Medical Billing Solution Revenue million Forecast, by Type 2020 & 2033
- Table 18: Global Medical Billing Solution Revenue million Forecast, by Country 2020 & 2033
- Table 19: United Kingdom Medical Billing Solution Revenue (million) Forecast, by Application 2020 & 2033
- Table 20: Germany Medical Billing Solution Revenue (million) Forecast, by Application 2020 & 2033
- Table 21: France Medical Billing Solution Revenue (million) Forecast, by Application 2020 & 2033
- Table 22: Italy Medical Billing Solution Revenue (million) Forecast, by Application 2020 & 2033
- Table 23: Spain Medical Billing Solution Revenue (million) Forecast, by Application 2020 & 2033
- Table 24: Russia Medical Billing Solution Revenue (million) Forecast, by Application 2020 & 2033
- Table 25: Benelux Medical Billing Solution Revenue (million) Forecast, by Application 2020 & 2033
- Table 26: Nordics Medical Billing Solution Revenue (million) Forecast, by Application 2020 & 2033
- Table 27: Rest of Europe Medical Billing Solution Revenue (million) Forecast, by Application 2020 & 2033
- Table 28: Global Medical Billing Solution Revenue million Forecast, by Application 2020 & 2033
- Table 29: Global Medical Billing Solution Revenue million Forecast, by Type 2020 & 2033
- Table 30: Global Medical Billing Solution Revenue million Forecast, by Country 2020 & 2033
- Table 31: Turkey Medical Billing Solution Revenue (million) Forecast, by Application 2020 & 2033
- Table 32: Israel Medical Billing Solution Revenue (million) Forecast, by Application 2020 & 2033
- Table 33: GCC Medical Billing Solution Revenue (million) Forecast, by Application 2020 & 2033
- Table 34: North Africa Medical Billing Solution Revenue (million) Forecast, by Application 2020 & 2033
- Table 35: South Africa Medical Billing Solution Revenue (million) Forecast, by Application 2020 & 2033
- Table 36: Rest of Middle East & Africa Medical Billing Solution Revenue (million) Forecast, by Application 2020 & 2033
- Table 37: Global Medical Billing Solution Revenue million Forecast, by Application 2020 & 2033
- Table 38: Global Medical Billing Solution Revenue million Forecast, by Type 2020 & 2033
- Table 39: Global Medical Billing Solution Revenue million Forecast, by Country 2020 & 2033
- Table 40: China Medical Billing Solution Revenue (million) Forecast, by Application 2020 & 2033
- Table 41: India Medical Billing Solution Revenue (million) Forecast, by Application 2020 & 2033
- Table 42: Japan Medical Billing Solution Revenue (million) Forecast, by Application 2020 & 2033
- Table 43: South Korea Medical Billing Solution Revenue (million) Forecast, by Application 2020 & 2033
- Table 44: ASEAN Medical Billing Solution Revenue (million) Forecast, by Application 2020 & 2033
- Table 45: Oceania Medical Billing Solution Revenue (million) Forecast, by Application 2020 & 2033
- Table 46: Rest of Asia Pacific Medical Billing Solution Revenue (million) Forecast, by Application 2020 & 2033
Frequently Asked Questions
1. What is the projected Compound Annual Growth Rate (CAGR) of the Medical Billing Solution?
The projected CAGR is approximately 4.8%.
2. Which companies are prominent players in the Medical Billing Solution?
Key companies in the market include MBS, OSP Labs, Medical Billing & Coding Solutions Company, Kitrin, Capterra, Pro Medical Billing Solutions, DrCatalyst, CareCloud, RXNT, Kareo Billing, Optum.
3. What are the main segments of the Medical Billing Solution?
The market segments include Application, Type.
4. Can you provide details about the market size?
The market size is estimated to be USD 54.9 million as of 2022.
5. What are some drivers contributing to market growth?
N/A
6. What are the notable trends driving market growth?
N/A
7. Are there any restraints impacting market growth?
N/A
8. Can you provide examples of recent developments in the market?
N/A
9. What pricing options are available for accessing the report?
Pricing options include single-user, multi-user, and enterprise licenses priced at USD 2900.00, USD 4350.00, and USD 5800.00 respectively.
10. Is the market size provided in terms of value or volume?
The market size is provided in terms of value, measured in million.
11. Are there any specific market keywords associated with the report?
Yes, the market keyword associated with the report is "Medical Billing Solution," which aids in identifying and referencing the specific market segment covered.
12. How do I determine which pricing option suits my needs best?
The pricing options vary based on user requirements and access needs. Individual users may opt for single-user licenses, while businesses requiring broader access may choose multi-user or enterprise licenses for cost-effective access to the report.
13. Are there any additional resources or data provided in the Medical Billing Solution report?
While the report offers comprehensive insights, it's advisable to review the specific contents or supplementary materials provided to ascertain if additional resources or data are available.
14. How can I stay updated on further developments or reports in the Medical Billing Solution?
To stay informed about further developments, trends, and reports in the Medical Billing Solution, consider subscribing to industry newsletters, following relevant companies and organizations, or regularly checking reputable industry news sources and publications.
Methodology
Step 1 - Identification of Relevant Samples Size from Population Database



Step 2 - Approaches for Defining Global Market Size (Value, Volume* & Price*)

Note*: In applicable scenarios
Step 3 - Data Sources
Primary Research
- Web Analytics
- Survey Reports
- Research Institute
- Latest Research Reports
- Opinion Leaders
Secondary Research
- Annual Reports
- White Paper
- Latest Press Release
- Industry Association
- Paid Database
- Investor Presentations

Step 4 - Data Triangulation
Involves using different sources of information in order to increase the validity of a study
These sources are likely to be stakeholders in a program - participants, other researchers, program staff, other community members, and so on.
Then we put all data in single framework & apply various statistical tools to find out the dynamic on the market.
During the analysis stage, feedback from the stakeholder groups would be compared to determine areas of agreement as well as areas of divergence