

Key Insights
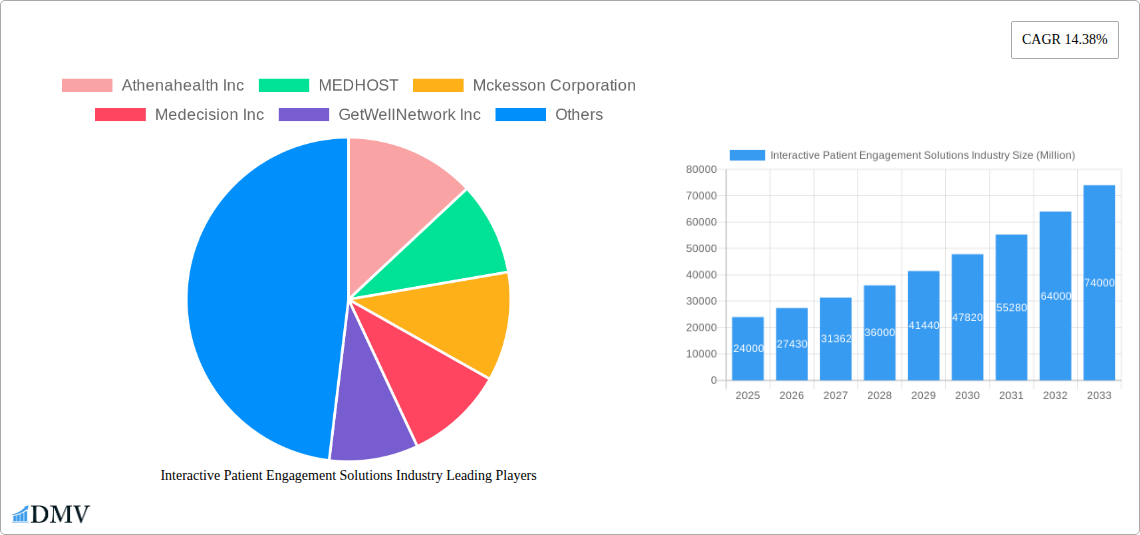
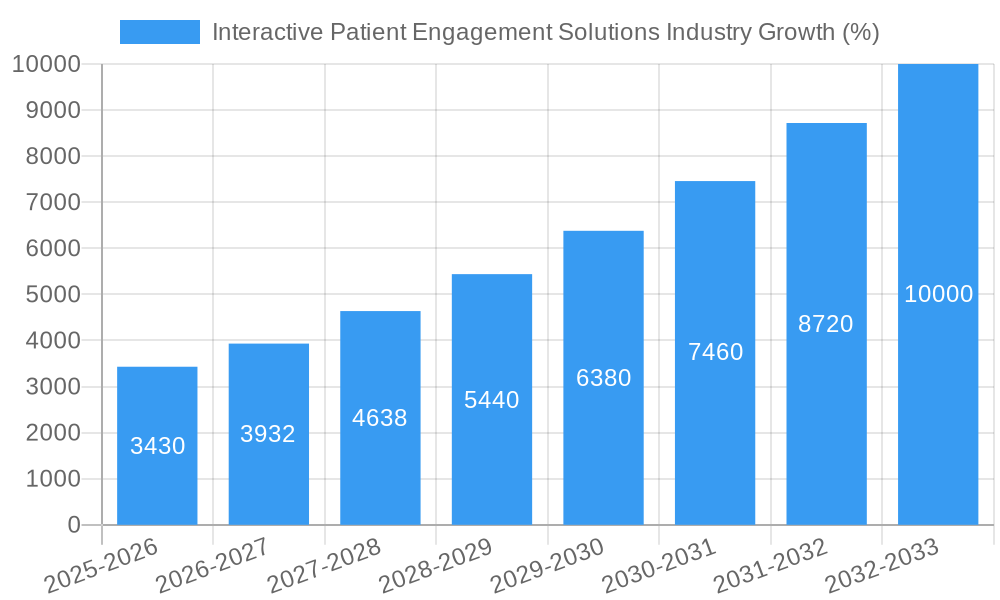
The Interactive Patient Engagement Solutions market is experiencing robust growth, projected to reach $24 billion in 2025 and exhibiting a Compound Annual Growth Rate (CAGR) of 14.38% from 2025 to 2033. This expansion is driven by several key factors. The increasing adoption of telehealth and remote patient monitoring, fueled by technological advancements and the rising prevalence of chronic diseases, is a significant catalyst. Furthermore, a growing emphasis on patient-centric care, coupled with the desire for improved healthcare outcomes and reduced healthcare costs, is pushing providers and payers to invest in interactive patient engagement solutions. The shift towards value-based care models further incentivizes the use of these solutions, as they enable proactive patient management and improved adherence to treatment plans. Specific applications like social management tools fostering community support, and fitness and health management apps promoting preventative care, are experiencing particularly strong growth. The market's segmentation reflects this diverse demand, with hardware, software, and service components catering to web-based, cloud-based, and on-premise deployment models across various end-user segments, including providers, payers, and patients.
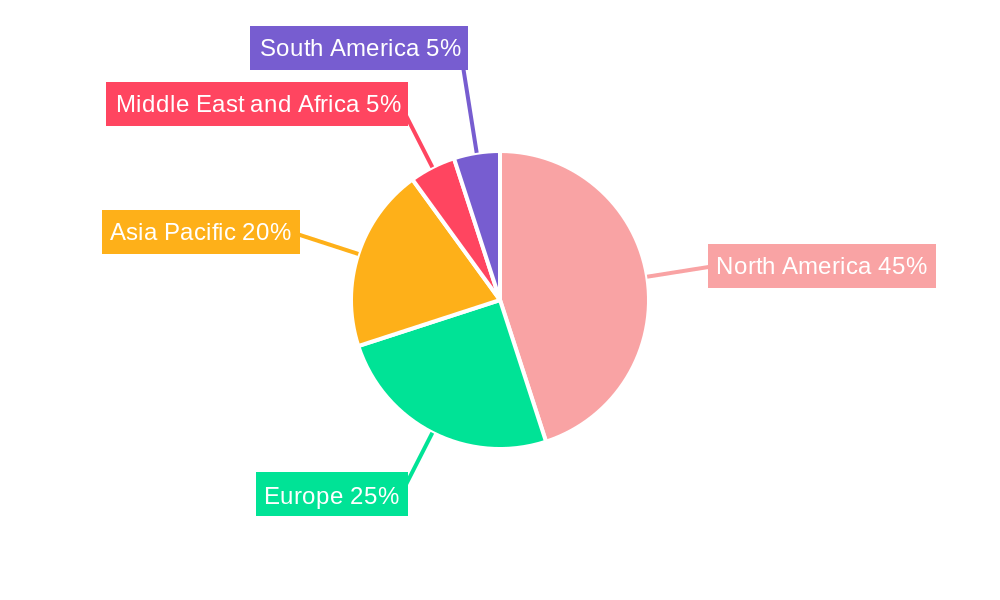
Competition in the market is intense, with established players like Athenahealth, McKesson, and Cerner competing alongside emerging companies. Geographic expansion is also a key trend, with North America currently dominating the market due to advanced healthcare infrastructure and high technology adoption. However, significant growth opportunities exist in the Asia-Pacific region, driven by rising healthcare expenditure and increasing smartphone penetration. The market's future hinges on factors such as regulatory changes affecting data privacy and security, the ongoing development of sophisticated AI-powered engagement tools, and the ability of companies to effectively integrate these solutions into existing healthcare workflows. Overcoming potential barriers, such as the digital literacy gap among certain patient demographics and concerns about data security, will be crucial for sustained market expansion.
Interactive Patient Engagement Solutions Industry: A Comprehensive Market Report (2019-2033)
This insightful report provides a comprehensive analysis of the Interactive Patient Engagement Solutions industry, offering invaluable data and forecasts for stakeholders from 2019 to 2033. With a focus on market trends, leading players, and future opportunities, this report is essential for strategic decision-making. The study encompasses a detailed examination of market segmentation, encompassing hardware, software, and services delivered via web-based, cloud-based, and on-premise models. Key applications analyzed include social management, fitness and health management, home healthcare management, and financial management solutions targeting providers, payers, patients, and other end-users. The report uses 2025 as the base and estimated year, with a forecast period spanning 2025-2033 and historical data covering 2019-2024. The market is estimated to be worth xx Million in 2025 and projected to reach xx Million by 2033.
Interactive Patient Engagement Solutions Industry Market Composition & Trends
This section delves into the competitive landscape of the Interactive Patient Engagement Solutions market, evaluating market concentration, innovation drivers, regulatory frameworks, substitute products, end-user demographics, and merger & acquisition (M&A) activity. The report analyzes the market share distribution among key players, including Athenahealth Inc, MEDHOST, McKesson Corporation, Medecision Inc, GetWellNetwork Inc, Orion Health Ltd, Cerner Corporation, Welvu, Lincor Solutions, Yourcareuniverse Inc, Allscripts Healthcare Solutions Inc, and IBM. The analysis incorporates data on M&A deal values, providing a clear picture of market dynamics. The report also examines the influence of regulatory changes on market growth and competition, highlighting the emergence of substitute products and their impact on market share. Detailed analysis of end-user segments (providers, payers, patients, and others) with their respective engagement patterns and preferences is included.
- Market Concentration: The market exhibits a [Describe market concentration: e.g., moderately concentrated/highly fragmented] structure with the top 5 players holding approximately xx% of the market share in 2025.
- Innovation Catalysts: Increasing adoption of telehealth and remote patient monitoring is driving innovation.
- Regulatory Landscape: HIPAA compliance and data privacy regulations significantly impact market dynamics.
- M&A Activity: [Describe M&A activity, including number of deals and total deal value in Millions]. For example, "Over the period 2019-2024, the industry witnessed approximately xx M&A deals, with a total value exceeding xx Million."
Interactive Patient Engagement Solutions Industry Industry Evolution
This section provides a detailed analysis of the Interactive Patient Engagement Solutions industry's evolution from 2019 to 2033. It traces market growth trajectories, technological advancements, and shifts in consumer demands. Specific data points, such as compound annual growth rates (CAGR) and adoption rates for various technologies (e.g., telehealth platforms, remote patient monitoring devices), are provided to illustrate market trends. The impact of technological advancements, such as artificial intelligence (AI) and machine learning (ML), on improving patient engagement and outcomes is discussed. The changing preferences of end-users, driven by factors like increased digital literacy and demand for personalized healthcare, are also explored. The influence of factors like rising healthcare costs and the increasing prevalence of chronic diseases on the adoption of patient engagement solutions is analyzed.
Leading Regions, Countries, or Segments in Interactive Patient Engagement Solutions Industry
This section identifies the leading regions, countries, or segments within the Interactive Patient Engagement Solutions market. It uses a multi-faceted approach, examining market dominance across different components (hardware, software, services), delivery modes (web-based, cloud-based, on-premise), applications (social management, fitness and health management, etc.), and end-users (providers, payers, patients, etc.). The analysis highlights key growth drivers such as investment trends, regulatory support, and technological advancements specific to each segment.
- Dominant Region/Country: [Identify the dominant region and country and explain why.] For example, "North America is currently the dominant region due to high healthcare expenditure and early adoption of advanced technologies".
- Leading Segment (Component): [Identify the leading component – e.g., software, and provide justification]. For example, "Software solutions dominate due to their scalability, flexibility, and integration capabilities"
- Leading Segment (Delivery Mode): [Identify leading delivery mode – e.g., cloud-based, and explain reasons.] For example, "Cloud-based solutions are experiencing rapid growth owing to cost-effectiveness and accessibility."
- Leading Segment (Application): [Identify leading application – e.g., Chronic disease management and explain reasons]. For example, "Chronic disease management applications are gaining traction due to the increasing prevalence of chronic illnesses."
- Leading Segment (End User): [Identify leading end user – e.g., Providers, and explain reasons]. For example, "Providers are the key end-users, driving market demand due to the need for efficient patient management."
Interactive Patient Engagement Solutions Industry Product Innovations
Recent product innovations in the Interactive Patient Engagement Solutions market demonstrate a strong focus on enhancing patient experience and improving healthcare outcomes. New solutions feature advanced analytics capabilities that provide actionable insights into patient behavior and health trends. The integration of AI and machine learning algorithms enables personalized interventions and proactive care management. This is coupled with improved user interfaces and intuitive designs to improve accessibility and engagement. Many companies are focusing on developing solutions that seamlessly integrate with existing Electronic Health Record (EHR) systems, optimizing workflow efficiency. These innovations are significantly enhancing the value proposition of these solutions, improving patient satisfaction and promoting better health outcomes.
Propelling Factors for Interactive Patient Engagement Solutions Industry Growth
Several factors are driving the growth of the Interactive Patient Engagement Solutions industry. Technological advancements such as the development of AI-powered diagnostic tools and the proliferation of wearable health sensors are enhancing the capabilities of these solutions, leading to higher adoption rates. The increasing prevalence of chronic diseases necessitates proactive patient management, contributing significantly to market expansion. Government initiatives and regulatory frameworks promoting telehealth and remote patient monitoring are also creating favorable conditions for growth. Furthermore, the rising healthcare costs are compelling providers and payers to embrace cost-effective solutions, such as remote patient monitoring, which can potentially reduce hospital readmissions and improve overall healthcare efficiency.
Obstacles in the Interactive Patient Engagement Solutions Industry Market
Despite significant growth potential, the Interactive Patient Engagement Solutions market faces certain challenges. Data security and privacy concerns remain a major obstacle, requiring robust security measures and strict compliance with regulations like HIPAA. Interoperability issues between different healthcare systems can hinder seamless data exchange and limit the effectiveness of patient engagement solutions. The high cost of implementation and maintenance can pose a barrier to adoption, especially for smaller healthcare providers. Competition among various vendors also creates pricing pressures and necessitates continuous innovation to remain competitive. Finally, the ever-evolving regulatory landscape requires constant adaptation and compliance, adding to the complexity of operating in this market.
Future Opportunities in Interactive Patient Engagement Solutions Industry
The Interactive Patient Engagement Solutions market presents numerous promising opportunities. The expansion of telehealth and remote patient monitoring services, especially in underserved areas, offers considerable growth potential. Integration of virtual reality (VR) and augmented reality (AR) technologies is expected to create new possibilities for patient education and rehabilitation. The development of personalized medicine approaches, driven by advancements in genomics and AI, will further augment the demand for sophisticated patient engagement solutions. Finally, the increasing focus on preventive care and wellness initiatives will drive adoption of solutions focusing on health management and lifestyle interventions.
Major Players in the Interactive Patient Engagement Solutions Industry Ecosystem
- Athenahealth Inc
- MEDHOST
- Mckesson Corporation
- Medecision Inc
- GetWellNetwork Inc
- Orion Health Ltd
- Cerner Corporation
- Welvu
- Lincor Solutions
- Yourcareuniverse Inc
- Allscripts Healthcare Solutions Inc
- IBM
Key Developments in Interactive Patient Engagement Solutions Industry Industry
- March 2022: DeliverHealth launched its partner program, aiming to expand its reach and improve healthcare outcomes.
- March 2022: Epic launched "Cheers," a CRM technology designed to enhance patient connection and address challenges posed by the COVID-19 pandemic.
Strategic Interactive Patient Engagement Solutions Industry Market Forecast
The Interactive Patient Engagement Solutions market is poised for robust growth driven by technological advancements, increasing demand for personalized healthcare, and the expanding adoption of telehealth. The convergence of AI, big data analytics, and wearable technology will lead to more sophisticated and effective patient engagement solutions. Continued investment in R&D and strategic partnerships will shape market evolution. The market is expected to experience significant expansion across all segments, propelled by the increasing need for proactive, patient-centric healthcare delivery. This growth will be further fueled by supportive regulatory frameworks and evolving consumer preferences for convenient and accessible healthcare solutions.
Interactive Patient Engagement Solutions Industry Segmentation
-
1. Component
- 1.1. Hardware
- 1.2. Software
- 1.3. Service
-
2. Delivery Mode
- 2.1. Web-based and Cloud-based
- 2.2. On-Premise
-
3. Application
- 3.1. Social Management
- 3.2. Fitness and Health Management
- 3.3. Home Healthcare Management
- 3.4. Financial Management
-
4. End User
- 4.1. Provider
- 4.2. Payer
- 4.3. Patient
- 4.4. Other End Users
Interactive Patient Engagement Solutions Industry Segmentation By Geography
-
1. North America
- 1.1. United States
- 1.2. Canada
- 1.3. Mexico
-
2. Europe
- 2.1. Germany
- 2.2. United Kingdom
- 2.3. France
- 2.4. Italy
- 2.5. Spain
- 2.6. Rest of Europe
-
3. Asia Pacific
- 3.1. China
- 3.2. Japan
- 3.3. India
- 3.4. Australia
- 3.5. South Korea
- 3.6. Rest of Asia Pacific
-
4. Middle East and Africa
- 4.1. GCC
- 4.2. South Africa
- 4.3. Rest of Middle East and Africa
-
5. South America
- 5.1. Brazil
- 5.2. Argentina
- 5.3. Rest of South America
Interactive Patient Engagement Solutions Industry REPORT HIGHLIGHTS
| Aspects | Details |
|---|---|
| Study Period | 2019-2033 |
| Base Year | 2024 |
| Estimated Year | 2025 |
| Forecast Period | 2025-2033 |
| Historical Period | 2019-2024 |
| Growth Rate | CAGR of 14.38% from 2019-2033 |
| Segmentation |
|
Table of Contents
- 1. Introduction
- 1.1. Research Scope
- 1.2. Market Segmentation
- 1.3. Research Methodology
- 1.4. Definitions and Assumptions
- 2. Executive Summary
- 2.1. Introduction
- 3. Market Dynamics
- 3.1. Introduction
- 3.2. Market Drivers
- 3.2.1. Rising Trend of Mobile Health Applications; Growing Popularity of Patient Engagement Solutions Among the Aging Population; Rising Investments and Technological advancements
- 3.3. Market Restrains
- 3.3.1. Protection of Patient Information; Lack of Skilled IT Professionals in the Healthcare Industry
- 3.4. Market Trends
- 3.4.1. Web-based and Cloud-based Services Segment is Expected to Witness Growth Over the Forecast Period
- 4. Market Factor Analysis
- 4.1. Porters Five Forces
- 4.2. Supply/Value Chain
- 4.3. PESTEL analysis
- 4.4. Market Entropy
- 4.5. Patent/Trademark Analysis
- 5. Global Interactive Patient Engagement Solutions Industry Analysis, Insights and Forecast, 2019-2031
- 5.1. Market Analysis, Insights and Forecast - by Component
- 5.1.1. Hardware
- 5.1.2. Software
- 5.1.3. Service
- 5.2. Market Analysis, Insights and Forecast - by Delivery Mode
- 5.2.1. Web-based and Cloud-based
- 5.2.2. On-Premise
- 5.3. Market Analysis, Insights and Forecast - by Application
- 5.3.1. Social Management
- 5.3.2. Fitness and Health Management
- 5.3.3. Home Healthcare Management
- 5.3.4. Financial Management
- 5.4. Market Analysis, Insights and Forecast - by End User
- 5.4.1. Provider
- 5.4.2. Payer
- 5.4.3. Patient
- 5.4.4. Other End Users
- 5.5. Market Analysis, Insights and Forecast - by Region
- 5.5.1. North America
- 5.5.2. Europe
- 5.5.3. Asia Pacific
- 5.5.4. Middle East and Africa
- 5.5.5. South America
- 5.1. Market Analysis, Insights and Forecast - by Component
- 6. North America Interactive Patient Engagement Solutions Industry Analysis, Insights and Forecast, 2019-2031
- 6.1. Market Analysis, Insights and Forecast - by Component
- 6.1.1. Hardware
- 6.1.2. Software
- 6.1.3. Service
- 6.2. Market Analysis, Insights and Forecast - by Delivery Mode
- 6.2.1. Web-based and Cloud-based
- 6.2.2. On-Premise
- 6.3. Market Analysis, Insights and Forecast - by Application
- 6.3.1. Social Management
- 6.3.2. Fitness and Health Management
- 6.3.3. Home Healthcare Management
- 6.3.4. Financial Management
- 6.4. Market Analysis, Insights and Forecast - by End User
- 6.4.1. Provider
- 6.4.2. Payer
- 6.4.3. Patient
- 6.4.4. Other End Users
- 6.1. Market Analysis, Insights and Forecast - by Component
- 7. Europe Interactive Patient Engagement Solutions Industry Analysis, Insights and Forecast, 2019-2031
- 7.1. Market Analysis, Insights and Forecast - by Component
- 7.1.1. Hardware
- 7.1.2. Software
- 7.1.3. Service
- 7.2. Market Analysis, Insights and Forecast - by Delivery Mode
- 7.2.1. Web-based and Cloud-based
- 7.2.2. On-Premise
- 7.3. Market Analysis, Insights and Forecast - by Application
- 7.3.1. Social Management
- 7.3.2. Fitness and Health Management
- 7.3.3. Home Healthcare Management
- 7.3.4. Financial Management
- 7.4. Market Analysis, Insights and Forecast - by End User
- 7.4.1. Provider
- 7.4.2. Payer
- 7.4.3. Patient
- 7.4.4. Other End Users
- 7.1. Market Analysis, Insights and Forecast - by Component
- 8. Asia Pacific Interactive Patient Engagement Solutions Industry Analysis, Insights and Forecast, 2019-2031
- 8.1. Market Analysis, Insights and Forecast - by Component
- 8.1.1. Hardware
- 8.1.2. Software
- 8.1.3. Service
- 8.2. Market Analysis, Insights and Forecast - by Delivery Mode
- 8.2.1. Web-based and Cloud-based
- 8.2.2. On-Premise
- 8.3. Market Analysis, Insights and Forecast - by Application
- 8.3.1. Social Management
- 8.3.2. Fitness and Health Management
- 8.3.3. Home Healthcare Management
- 8.3.4. Financial Management
- 8.4. Market Analysis, Insights and Forecast - by End User
- 8.4.1. Provider
- 8.4.2. Payer
- 8.4.3. Patient
- 8.4.4. Other End Users
- 8.1. Market Analysis, Insights and Forecast - by Component
- 9. Middle East and Africa Interactive Patient Engagement Solutions Industry Analysis, Insights and Forecast, 2019-2031
- 9.1. Market Analysis, Insights and Forecast - by Component
- 9.1.1. Hardware
- 9.1.2. Software
- 9.1.3. Service
- 9.2. Market Analysis, Insights and Forecast - by Delivery Mode
- 9.2.1. Web-based and Cloud-based
- 9.2.2. On-Premise
- 9.3. Market Analysis, Insights and Forecast - by Application
- 9.3.1. Social Management
- 9.3.2. Fitness and Health Management
- 9.3.3. Home Healthcare Management
- 9.3.4. Financial Management
- 9.4. Market Analysis, Insights and Forecast - by End User
- 9.4.1. Provider
- 9.4.2. Payer
- 9.4.3. Patient
- 9.4.4. Other End Users
- 9.1. Market Analysis, Insights and Forecast - by Component
- 10. South America Interactive Patient Engagement Solutions Industry Analysis, Insights and Forecast, 2019-2031
- 10.1. Market Analysis, Insights and Forecast - by Component
- 10.1.1. Hardware
- 10.1.2. Software
- 10.1.3. Service
- 10.2. Market Analysis, Insights and Forecast - by Delivery Mode
- 10.2.1. Web-based and Cloud-based
- 10.2.2. On-Premise
- 10.3. Market Analysis, Insights and Forecast - by Application
- 10.3.1. Social Management
- 10.3.2. Fitness and Health Management
- 10.3.3. Home Healthcare Management
- 10.3.4. Financial Management
- 10.4. Market Analysis, Insights and Forecast - by End User
- 10.4.1. Provider
- 10.4.2. Payer
- 10.4.3. Patient
- 10.4.4. Other End Users
- 10.1. Market Analysis, Insights and Forecast - by Component
- 11. North America Interactive Patient Engagement Solutions Industry Analysis, Insights and Forecast, 2019-2031
- 11.1. Market Analysis, Insights and Forecast - By Country/Sub-region
- 11.1.1 United States
- 11.1.2 Canada
- 11.1.3 Mexico
- 12. Europe Interactive Patient Engagement Solutions Industry Analysis, Insights and Forecast, 2019-2031
- 12.1. Market Analysis, Insights and Forecast - By Country/Sub-region
- 12.1.1 Germany
- 12.1.2 United Kingdom
- 12.1.3 France
- 12.1.4 Italy
- 12.1.5 Spain
- 12.1.6 Rest of Europe
- 13. Asia Pacific Interactive Patient Engagement Solutions Industry Analysis, Insights and Forecast, 2019-2031
- 13.1. Market Analysis, Insights and Forecast - By Country/Sub-region
- 13.1.1 China
- 13.1.2 Japan
- 13.1.3 India
- 13.1.4 Australia
- 13.1.5 South Korea
- 13.1.6 Rest of Asia Pacific
- 14. Middle East and Africa Interactive Patient Engagement Solutions Industry Analysis, Insights and Forecast, 2019-2031
- 14.1. Market Analysis, Insights and Forecast - By Country/Sub-region
- 14.1.1 GCC
- 14.1.2 South Africa
- 14.1.3 Rest of Middle East and Africa
- 15. South America Interactive Patient Engagement Solutions Industry Analysis, Insights and Forecast, 2019-2031
- 15.1. Market Analysis, Insights and Forecast - By Country/Sub-region
- 15.1.1 Brazil
- 15.1.2 Argentina
- 15.1.3 Rest of South America
- 16. Competitive Analysis
- 16.1. Global Market Share Analysis 2024
- 16.2. Company Profiles
- 16.2.1 Athenahealth Inc
- 16.2.1.1. Overview
- 16.2.1.2. Products
- 16.2.1.3. SWOT Analysis
- 16.2.1.4. Recent Developments
- 16.2.1.5. Financials (Based on Availability)
- 16.2.2 MEDHOST
- 16.2.2.1. Overview
- 16.2.2.2. Products
- 16.2.2.3. SWOT Analysis
- 16.2.2.4. Recent Developments
- 16.2.2.5. Financials (Based on Availability)
- 16.2.3 Mckesson Corporation
- 16.2.3.1. Overview
- 16.2.3.2. Products
- 16.2.3.3. SWOT Analysis
- 16.2.3.4. Recent Developments
- 16.2.3.5. Financials (Based on Availability)
- 16.2.4 Medecision Inc
- 16.2.4.1. Overview
- 16.2.4.2. Products
- 16.2.4.3. SWOT Analysis
- 16.2.4.4. Recent Developments
- 16.2.4.5. Financials (Based on Availability)
- 16.2.5 GetWellNetwork Inc
- 16.2.5.1. Overview
- 16.2.5.2. Products
- 16.2.5.3. SWOT Analysis
- 16.2.5.4. Recent Developments
- 16.2.5.5. Financials (Based on Availability)
- 16.2.6 Orion Health Ltd
- 16.2.6.1. Overview
- 16.2.6.2. Products
- 16.2.6.3. SWOT Analysis
- 16.2.6.4. Recent Developments
- 16.2.6.5. Financials (Based on Availability)
- 16.2.7 Cerner Corporation
- 16.2.7.1. Overview
- 16.2.7.2. Products
- 16.2.7.3. SWOT Analysis
- 16.2.7.4. Recent Developments
- 16.2.7.5. Financials (Based on Availability)
- 16.2.8 Welvu
- 16.2.8.1. Overview
- 16.2.8.2. Products
- 16.2.8.3. SWOT Analysis
- 16.2.8.4. Recent Developments
- 16.2.8.5. Financials (Based on Availability)
- 16.2.9 Lincor Solutions
- 16.2.9.1. Overview
- 16.2.9.2. Products
- 16.2.9.3. SWOT Analysis
- 16.2.9.4. Recent Developments
- 16.2.9.5. Financials (Based on Availability)
- 16.2.10 Yourcareuniverse Inc
- 16.2.10.1. Overview
- 16.2.10.2. Products
- 16.2.10.3. SWOT Analysis
- 16.2.10.4. Recent Developments
- 16.2.10.5. Financials (Based on Availability)
- 16.2.11 Allscripts Healthcare Solutions Inc
- 16.2.11.1. Overview
- 16.2.11.2. Products
- 16.2.11.3. SWOT Analysis
- 16.2.11.4. Recent Developments
- 16.2.11.5. Financials (Based on Availability)
- 16.2.12 IBM
- 16.2.12.1. Overview
- 16.2.12.2. Products
- 16.2.12.3. SWOT Analysis
- 16.2.12.4. Recent Developments
- 16.2.12.5. Financials (Based on Availability)
- 16.2.1 Athenahealth Inc
List of Figures
- Figure 1: Global Interactive Patient Engagement Solutions Industry Revenue Breakdown (Million, %) by Region 2024 & 2032
- Figure 2: Global Interactive Patient Engagement Solutions Industry Volume Breakdown (K Unit, %) by Region 2024 & 2032
- Figure 3: North America Interactive Patient Engagement Solutions Industry Revenue (Million), by Country 2024 & 2032
- Figure 4: North America Interactive Patient Engagement Solutions Industry Volume (K Unit), by Country 2024 & 2032
- Figure 5: North America Interactive Patient Engagement Solutions Industry Revenue Share (%), by Country 2024 & 2032
- Figure 6: North America Interactive Patient Engagement Solutions Industry Volume Share (%), by Country 2024 & 2032
- Figure 7: Europe Interactive Patient Engagement Solutions Industry Revenue (Million), by Country 2024 & 2032
- Figure 8: Europe Interactive Patient Engagement Solutions Industry Volume (K Unit), by Country 2024 & 2032
- Figure 9: Europe Interactive Patient Engagement Solutions Industry Revenue Share (%), by Country 2024 & 2032
- Figure 10: Europe Interactive Patient Engagement Solutions Industry Volume Share (%), by Country 2024 & 2032
- Figure 11: Asia Pacific Interactive Patient Engagement Solutions Industry Revenue (Million), by Country 2024 & 2032
- Figure 12: Asia Pacific Interactive Patient Engagement Solutions Industry Volume (K Unit), by Country 2024 & 2032
- Figure 13: Asia Pacific Interactive Patient Engagement Solutions Industry Revenue Share (%), by Country 2024 & 2032
- Figure 14: Asia Pacific Interactive Patient Engagement Solutions Industry Volume Share (%), by Country 2024 & 2032
- Figure 15: Middle East and Africa Interactive Patient Engagement Solutions Industry Revenue (Million), by Country 2024 & 2032
- Figure 16: Middle East and Africa Interactive Patient Engagement Solutions Industry Volume (K Unit), by Country 2024 & 2032
- Figure 17: Middle East and Africa Interactive Patient Engagement Solutions Industry Revenue Share (%), by Country 2024 & 2032
- Figure 18: Middle East and Africa Interactive Patient Engagement Solutions Industry Volume Share (%), by Country 2024 & 2032
- Figure 19: South America Interactive Patient Engagement Solutions Industry Revenue (Million), by Country 2024 & 2032
- Figure 20: South America Interactive Patient Engagement Solutions Industry Volume (K Unit), by Country 2024 & 2032
- Figure 21: South America Interactive Patient Engagement Solutions Industry Revenue Share (%), by Country 2024 & 2032
- Figure 22: South America Interactive Patient Engagement Solutions Industry Volume Share (%), by Country 2024 & 2032
- Figure 23: North America Interactive Patient Engagement Solutions Industry Revenue (Million), by Component 2024 & 2032
- Figure 24: North America Interactive Patient Engagement Solutions Industry Volume (K Unit), by Component 2024 & 2032
- Figure 25: North America Interactive Patient Engagement Solutions Industry Revenue Share (%), by Component 2024 & 2032
- Figure 26: North America Interactive Patient Engagement Solutions Industry Volume Share (%), by Component 2024 & 2032
- Figure 27: North America Interactive Patient Engagement Solutions Industry Revenue (Million), by Delivery Mode 2024 & 2032
- Figure 28: North America Interactive Patient Engagement Solutions Industry Volume (K Unit), by Delivery Mode 2024 & 2032
- Figure 29: North America Interactive Patient Engagement Solutions Industry Revenue Share (%), by Delivery Mode 2024 & 2032
- Figure 30: North America Interactive Patient Engagement Solutions Industry Volume Share (%), by Delivery Mode 2024 & 2032
- Figure 31: North America Interactive Patient Engagement Solutions Industry Revenue (Million), by Application 2024 & 2032
- Figure 32: North America Interactive Patient Engagement Solutions Industry Volume (K Unit), by Application 2024 & 2032
- Figure 33: North America Interactive Patient Engagement Solutions Industry Revenue Share (%), by Application 2024 & 2032
- Figure 34: North America Interactive Patient Engagement Solutions Industry Volume Share (%), by Application 2024 & 2032
- Figure 35: North America Interactive Patient Engagement Solutions Industry Revenue (Million), by End User 2024 & 2032
- Figure 36: North America Interactive Patient Engagement Solutions Industry Volume (K Unit), by End User 2024 & 2032
- Figure 37: North America Interactive Patient Engagement Solutions Industry Revenue Share (%), by End User 2024 & 2032
- Figure 38: North America Interactive Patient Engagement Solutions Industry Volume Share (%), by End User 2024 & 2032
- Figure 39: North America Interactive Patient Engagement Solutions Industry Revenue (Million), by Country 2024 & 2032
- Figure 40: North America Interactive Patient Engagement Solutions Industry Volume (K Unit), by Country 2024 & 2032
- Figure 41: North America Interactive Patient Engagement Solutions Industry Revenue Share (%), by Country 2024 & 2032
- Figure 42: North America Interactive Patient Engagement Solutions Industry Volume Share (%), by Country 2024 & 2032
- Figure 43: Europe Interactive Patient Engagement Solutions Industry Revenue (Million), by Component 2024 & 2032
- Figure 44: Europe Interactive Patient Engagement Solutions Industry Volume (K Unit), by Component 2024 & 2032
- Figure 45: Europe Interactive Patient Engagement Solutions Industry Revenue Share (%), by Component 2024 & 2032
- Figure 46: Europe Interactive Patient Engagement Solutions Industry Volume Share (%), by Component 2024 & 2032
- Figure 47: Europe Interactive Patient Engagement Solutions Industry Revenue (Million), by Delivery Mode 2024 & 2032
- Figure 48: Europe Interactive Patient Engagement Solutions Industry Volume (K Unit), by Delivery Mode 2024 & 2032
- Figure 49: Europe Interactive Patient Engagement Solutions Industry Revenue Share (%), by Delivery Mode 2024 & 2032
- Figure 50: Europe Interactive Patient Engagement Solutions Industry Volume Share (%), by Delivery Mode 2024 & 2032
- Figure 51: Europe Interactive Patient Engagement Solutions Industry Revenue (Million), by Application 2024 & 2032
- Figure 52: Europe Interactive Patient Engagement Solutions Industry Volume (K Unit), by Application 2024 & 2032
- Figure 53: Europe Interactive Patient Engagement Solutions Industry Revenue Share (%), by Application 2024 & 2032
- Figure 54: Europe Interactive Patient Engagement Solutions Industry Volume Share (%), by Application 2024 & 2032
- Figure 55: Europe Interactive Patient Engagement Solutions Industry Revenue (Million), by End User 2024 & 2032
- Figure 56: Europe Interactive Patient Engagement Solutions Industry Volume (K Unit), by End User 2024 & 2032
- Figure 57: Europe Interactive Patient Engagement Solutions Industry Revenue Share (%), by End User 2024 & 2032
- Figure 58: Europe Interactive Patient Engagement Solutions Industry Volume Share (%), by End User 2024 & 2032
- Figure 59: Europe Interactive Patient Engagement Solutions Industry Revenue (Million), by Country 2024 & 2032
- Figure 60: Europe Interactive Patient Engagement Solutions Industry Volume (K Unit), by Country 2024 & 2032
- Figure 61: Europe Interactive Patient Engagement Solutions Industry Revenue Share (%), by Country 2024 & 2032
- Figure 62: Europe Interactive Patient Engagement Solutions Industry Volume Share (%), by Country 2024 & 2032
- Figure 63: Asia Pacific Interactive Patient Engagement Solutions Industry Revenue (Million), by Component 2024 & 2032
- Figure 64: Asia Pacific Interactive Patient Engagement Solutions Industry Volume (K Unit), by Component 2024 & 2032
- Figure 65: Asia Pacific Interactive Patient Engagement Solutions Industry Revenue Share (%), by Component 2024 & 2032
- Figure 66: Asia Pacific Interactive Patient Engagement Solutions Industry Volume Share (%), by Component 2024 & 2032
- Figure 67: Asia Pacific Interactive Patient Engagement Solutions Industry Revenue (Million), by Delivery Mode 2024 & 2032
- Figure 68: Asia Pacific Interactive Patient Engagement Solutions Industry Volume (K Unit), by Delivery Mode 2024 & 2032
- Figure 69: Asia Pacific Interactive Patient Engagement Solutions Industry Revenue Share (%), by Delivery Mode 2024 & 2032
- Figure 70: Asia Pacific Interactive Patient Engagement Solutions Industry Volume Share (%), by Delivery Mode 2024 & 2032
- Figure 71: Asia Pacific Interactive Patient Engagement Solutions Industry Revenue (Million), by Application 2024 & 2032
- Figure 72: Asia Pacific Interactive Patient Engagement Solutions Industry Volume (K Unit), by Application 2024 & 2032
- Figure 73: Asia Pacific Interactive Patient Engagement Solutions Industry Revenue Share (%), by Application 2024 & 2032
- Figure 74: Asia Pacific Interactive Patient Engagement Solutions Industry Volume Share (%), by Application 2024 & 2032
- Figure 75: Asia Pacific Interactive Patient Engagement Solutions Industry Revenue (Million), by End User 2024 & 2032
- Figure 76: Asia Pacific Interactive Patient Engagement Solutions Industry Volume (K Unit), by End User 2024 & 2032
- Figure 77: Asia Pacific Interactive Patient Engagement Solutions Industry Revenue Share (%), by End User 2024 & 2032
- Figure 78: Asia Pacific Interactive Patient Engagement Solutions Industry Volume Share (%), by End User 2024 & 2032
- Figure 79: Asia Pacific Interactive Patient Engagement Solutions Industry Revenue (Million), by Country 2024 & 2032
- Figure 80: Asia Pacific Interactive Patient Engagement Solutions Industry Volume (K Unit), by Country 2024 & 2032
- Figure 81: Asia Pacific Interactive Patient Engagement Solutions Industry Revenue Share (%), by Country 2024 & 2032
- Figure 82: Asia Pacific Interactive Patient Engagement Solutions Industry Volume Share (%), by Country 2024 & 2032
- Figure 83: Middle East and Africa Interactive Patient Engagement Solutions Industry Revenue (Million), by Component 2024 & 2032
- Figure 84: Middle East and Africa Interactive Patient Engagement Solutions Industry Volume (K Unit), by Component 2024 & 2032
- Figure 85: Middle East and Africa Interactive Patient Engagement Solutions Industry Revenue Share (%), by Component 2024 & 2032
- Figure 86: Middle East and Africa Interactive Patient Engagement Solutions Industry Volume Share (%), by Component 2024 & 2032
- Figure 87: Middle East and Africa Interactive Patient Engagement Solutions Industry Revenue (Million), by Delivery Mode 2024 & 2032
- Figure 88: Middle East and Africa Interactive Patient Engagement Solutions Industry Volume (K Unit), by Delivery Mode 2024 & 2032
- Figure 89: Middle East and Africa Interactive Patient Engagement Solutions Industry Revenue Share (%), by Delivery Mode 2024 & 2032
- Figure 90: Middle East and Africa Interactive Patient Engagement Solutions Industry Volume Share (%), by Delivery Mode 2024 & 2032
- Figure 91: Middle East and Africa Interactive Patient Engagement Solutions Industry Revenue (Million), by Application 2024 & 2032
- Figure 92: Middle East and Africa Interactive Patient Engagement Solutions Industry Volume (K Unit), by Application 2024 & 2032
- Figure 93: Middle East and Africa Interactive Patient Engagement Solutions Industry Revenue Share (%), by Application 2024 & 2032
- Figure 94: Middle East and Africa Interactive Patient Engagement Solutions Industry Volume Share (%), by Application 2024 & 2032
- Figure 95: Middle East and Africa Interactive Patient Engagement Solutions Industry Revenue (Million), by End User 2024 & 2032
- Figure 96: Middle East and Africa Interactive Patient Engagement Solutions Industry Volume (K Unit), by End User 2024 & 2032
- Figure 97: Middle East and Africa Interactive Patient Engagement Solutions Industry Revenue Share (%), by End User 2024 & 2032
- Figure 98: Middle East and Africa Interactive Patient Engagement Solutions Industry Volume Share (%), by End User 2024 & 2032
- Figure 99: Middle East and Africa Interactive Patient Engagement Solutions Industry Revenue (Million), by Country 2024 & 2032
- Figure 100: Middle East and Africa Interactive Patient Engagement Solutions Industry Volume (K Unit), by Country 2024 & 2032
- Figure 101: Middle East and Africa Interactive Patient Engagement Solutions Industry Revenue Share (%), by Country 2024 & 2032
- Figure 102: Middle East and Africa Interactive Patient Engagement Solutions Industry Volume Share (%), by Country 2024 & 2032
- Figure 103: South America Interactive Patient Engagement Solutions Industry Revenue (Million), by Component 2024 & 2032
- Figure 104: South America Interactive Patient Engagement Solutions Industry Volume (K Unit), by Component 2024 & 2032
- Figure 105: South America Interactive Patient Engagement Solutions Industry Revenue Share (%), by Component 2024 & 2032
- Figure 106: South America Interactive Patient Engagement Solutions Industry Volume Share (%), by Component 2024 & 2032
- Figure 107: South America Interactive Patient Engagement Solutions Industry Revenue (Million), by Delivery Mode 2024 & 2032
- Figure 108: South America Interactive Patient Engagement Solutions Industry Volume (K Unit), by Delivery Mode 2024 & 2032
- Figure 109: South America Interactive Patient Engagement Solutions Industry Revenue Share (%), by Delivery Mode 2024 & 2032
- Figure 110: South America Interactive Patient Engagement Solutions Industry Volume Share (%), by Delivery Mode 2024 & 2032
- Figure 111: South America Interactive Patient Engagement Solutions Industry Revenue (Million), by Application 2024 & 2032
- Figure 112: South America Interactive Patient Engagement Solutions Industry Volume (K Unit), by Application 2024 & 2032
- Figure 113: South America Interactive Patient Engagement Solutions Industry Revenue Share (%), by Application 2024 & 2032
- Figure 114: South America Interactive Patient Engagement Solutions Industry Volume Share (%), by Application 2024 & 2032
- Figure 115: South America Interactive Patient Engagement Solutions Industry Revenue (Million), by End User 2024 & 2032
- Figure 116: South America Interactive Patient Engagement Solutions Industry Volume (K Unit), by End User 2024 & 2032
- Figure 117: South America Interactive Patient Engagement Solutions Industry Revenue Share (%), by End User 2024 & 2032
- Figure 118: South America Interactive Patient Engagement Solutions Industry Volume Share (%), by End User 2024 & 2032
- Figure 119: South America Interactive Patient Engagement Solutions Industry Revenue (Million), by Country 2024 & 2032
- Figure 120: South America Interactive Patient Engagement Solutions Industry Volume (K Unit), by Country 2024 & 2032
- Figure 121: South America Interactive Patient Engagement Solutions Industry Revenue Share (%), by Country 2024 & 2032
- Figure 122: South America Interactive Patient Engagement Solutions Industry Volume Share (%), by Country 2024 & 2032
List of Tables
- Table 1: Global Interactive Patient Engagement Solutions Industry Revenue Million Forecast, by Region 2019 & 2032
- Table 2: Global Interactive Patient Engagement Solutions Industry Volume K Unit Forecast, by Region 2019 & 2032
- Table 3: Global Interactive Patient Engagement Solutions Industry Revenue Million Forecast, by Component 2019 & 2032
- Table 4: Global Interactive Patient Engagement Solutions Industry Volume K Unit Forecast, by Component 2019 & 2032
- Table 5: Global Interactive Patient Engagement Solutions Industry Revenue Million Forecast, by Delivery Mode 2019 & 2032
- Table 6: Global Interactive Patient Engagement Solutions Industry Volume K Unit Forecast, by Delivery Mode 2019 & 2032
- Table 7: Global Interactive Patient Engagement Solutions Industry Revenue Million Forecast, by Application 2019 & 2032
- Table 8: Global Interactive Patient Engagement Solutions Industry Volume K Unit Forecast, by Application 2019 & 2032
- Table 9: Global Interactive Patient Engagement Solutions Industry Revenue Million Forecast, by End User 2019 & 2032
- Table 10: Global Interactive Patient Engagement Solutions Industry Volume K Unit Forecast, by End User 2019 & 2032
- Table 11: Global Interactive Patient Engagement Solutions Industry Revenue Million Forecast, by Region 2019 & 2032
- Table 12: Global Interactive Patient Engagement Solutions Industry Volume K Unit Forecast, by Region 2019 & 2032
- Table 13: Global Interactive Patient Engagement Solutions Industry Revenue Million Forecast, by Country 2019 & 2032
- Table 14: Global Interactive Patient Engagement Solutions Industry Volume K Unit Forecast, by Country 2019 & 2032
- Table 15: United States Interactive Patient Engagement Solutions Industry Revenue (Million) Forecast, by Application 2019 & 2032
- Table 16: United States Interactive Patient Engagement Solutions Industry Volume (K Unit) Forecast, by Application 2019 & 2032
- Table 17: Canada Interactive Patient Engagement Solutions Industry Revenue (Million) Forecast, by Application 2019 & 2032
- Table 18: Canada Interactive Patient Engagement Solutions Industry Volume (K Unit) Forecast, by Application 2019 & 2032
- Table 19: Mexico Interactive Patient Engagement Solutions Industry Revenue (Million) Forecast, by Application 2019 & 2032
- Table 20: Mexico Interactive Patient Engagement Solutions Industry Volume (K Unit) Forecast, by Application 2019 & 2032
- Table 21: Global Interactive Patient Engagement Solutions Industry Revenue Million Forecast, by Country 2019 & 2032
- Table 22: Global Interactive Patient Engagement Solutions Industry Volume K Unit Forecast, by Country 2019 & 2032
- Table 23: Germany Interactive Patient Engagement Solutions Industry Revenue (Million) Forecast, by Application 2019 & 2032
- Table 24: Germany Interactive Patient Engagement Solutions Industry Volume (K Unit) Forecast, by Application 2019 & 2032
- Table 25: United Kingdom Interactive Patient Engagement Solutions Industry Revenue (Million) Forecast, by Application 2019 & 2032
- Table 26: United Kingdom Interactive Patient Engagement Solutions Industry Volume (K Unit) Forecast, by Application 2019 & 2032
- Table 27: France Interactive Patient Engagement Solutions Industry Revenue (Million) Forecast, by Application 2019 & 2032
- Table 28: France Interactive Patient Engagement Solutions Industry Volume (K Unit) Forecast, by Application 2019 & 2032
- Table 29: Italy Interactive Patient Engagement Solutions Industry Revenue (Million) Forecast, by Application 2019 & 2032
- Table 30: Italy Interactive Patient Engagement Solutions Industry Volume (K Unit) Forecast, by Application 2019 & 2032
- Table 31: Spain Interactive Patient Engagement Solutions Industry Revenue (Million) Forecast, by Application 2019 & 2032
- Table 32: Spain Interactive Patient Engagement Solutions Industry Volume (K Unit) Forecast, by Application 2019 & 2032
- Table 33: Rest of Europe Interactive Patient Engagement Solutions Industry Revenue (Million) Forecast, by Application 2019 & 2032
- Table 34: Rest of Europe Interactive Patient Engagement Solutions Industry Volume (K Unit) Forecast, by Application 2019 & 2032
- Table 35: Global Interactive Patient Engagement Solutions Industry Revenue Million Forecast, by Country 2019 & 2032
- Table 36: Global Interactive Patient Engagement Solutions Industry Volume K Unit Forecast, by Country 2019 & 2032
- Table 37: China Interactive Patient Engagement Solutions Industry Revenue (Million) Forecast, by Application 2019 & 2032
- Table 38: China Interactive Patient Engagement Solutions Industry Volume (K Unit) Forecast, by Application 2019 & 2032
- Table 39: Japan Interactive Patient Engagement Solutions Industry Revenue (Million) Forecast, by Application 2019 & 2032
- Table 40: Japan Interactive Patient Engagement Solutions Industry Volume (K Unit) Forecast, by Application 2019 & 2032
- Table 41: India Interactive Patient Engagement Solutions Industry Revenue (Million) Forecast, by Application 2019 & 2032
- Table 42: India Interactive Patient Engagement Solutions Industry Volume (K Unit) Forecast, by Application 2019 & 2032
- Table 43: Australia Interactive Patient Engagement Solutions Industry Revenue (Million) Forecast, by Application 2019 & 2032
- Table 44: Australia Interactive Patient Engagement Solutions Industry Volume (K Unit) Forecast, by Application 2019 & 2032
- Table 45: South Korea Interactive Patient Engagement Solutions Industry Revenue (Million) Forecast, by Application 2019 & 2032
- Table 46: South Korea Interactive Patient Engagement Solutions Industry Volume (K Unit) Forecast, by Application 2019 & 2032
- Table 47: Rest of Asia Pacific Interactive Patient Engagement Solutions Industry Revenue (Million) Forecast, by Application 2019 & 2032
- Table 48: Rest of Asia Pacific Interactive Patient Engagement Solutions Industry Volume (K Unit) Forecast, by Application 2019 & 2032
- Table 49: Global Interactive Patient Engagement Solutions Industry Revenue Million Forecast, by Country 2019 & 2032
- Table 50: Global Interactive Patient Engagement Solutions Industry Volume K Unit Forecast, by Country 2019 & 2032
- Table 51: GCC Interactive Patient Engagement Solutions Industry Revenue (Million) Forecast, by Application 2019 & 2032
- Table 52: GCC Interactive Patient Engagement Solutions Industry Volume (K Unit) Forecast, by Application 2019 & 2032
- Table 53: South Africa Interactive Patient Engagement Solutions Industry Revenue (Million) Forecast, by Application 2019 & 2032
- Table 54: South Africa Interactive Patient Engagement Solutions Industry Volume (K Unit) Forecast, by Application 2019 & 2032
- Table 55: Rest of Middle East and Africa Interactive Patient Engagement Solutions Industry Revenue (Million) Forecast, by Application 2019 & 2032
- Table 56: Rest of Middle East and Africa Interactive Patient Engagement Solutions Industry Volume (K Unit) Forecast, by Application 2019 & 2032
- Table 57: Global Interactive Patient Engagement Solutions Industry Revenue Million Forecast, by Country 2019 & 2032
- Table 58: Global Interactive Patient Engagement Solutions Industry Volume K Unit Forecast, by Country 2019 & 2032
- Table 59: Brazil Interactive Patient Engagement Solutions Industry Revenue (Million) Forecast, by Application 2019 & 2032
- Table 60: Brazil Interactive Patient Engagement Solutions Industry Volume (K Unit) Forecast, by Application 2019 & 2032
- Table 61: Argentina Interactive Patient Engagement Solutions Industry Revenue (Million) Forecast, by Application 2019 & 2032
- Table 62: Argentina Interactive Patient Engagement Solutions Industry Volume (K Unit) Forecast, by Application 2019 & 2032
- Table 63: Rest of South America Interactive Patient Engagement Solutions Industry Revenue (Million) Forecast, by Application 2019 & 2032
- Table 64: Rest of South America Interactive Patient Engagement Solutions Industry Volume (K Unit) Forecast, by Application 2019 & 2032
- Table 65: Global Interactive Patient Engagement Solutions Industry Revenue Million Forecast, by Component 2019 & 2032
- Table 66: Global Interactive Patient Engagement Solutions Industry Volume K Unit Forecast, by Component 2019 & 2032
- Table 67: Global Interactive Patient Engagement Solutions Industry Revenue Million Forecast, by Delivery Mode 2019 & 2032
- Table 68: Global Interactive Patient Engagement Solutions Industry Volume K Unit Forecast, by Delivery Mode 2019 & 2032
- Table 69: Global Interactive Patient Engagement Solutions Industry Revenue Million Forecast, by Application 2019 & 2032
- Table 70: Global Interactive Patient Engagement Solutions Industry Volume K Unit Forecast, by Application 2019 & 2032
- Table 71: Global Interactive Patient Engagement Solutions Industry Revenue Million Forecast, by End User 2019 & 2032
- Table 72: Global Interactive Patient Engagement Solutions Industry Volume K Unit Forecast, by End User 2019 & 2032
- Table 73: Global Interactive Patient Engagement Solutions Industry Revenue Million Forecast, by Country 2019 & 2032
- Table 74: Global Interactive Patient Engagement Solutions Industry Volume K Unit Forecast, by Country 2019 & 2032
- Table 75: United States Interactive Patient Engagement Solutions Industry Revenue (Million) Forecast, by Application 2019 & 2032
- Table 76: United States Interactive Patient Engagement Solutions Industry Volume (K Unit) Forecast, by Application 2019 & 2032
- Table 77: Canada Interactive Patient Engagement Solutions Industry Revenue (Million) Forecast, by Application 2019 & 2032
- Table 78: Canada Interactive Patient Engagement Solutions Industry Volume (K Unit) Forecast, by Application 2019 & 2032
- Table 79: Mexico Interactive Patient Engagement Solutions Industry Revenue (Million) Forecast, by Application 2019 & 2032
- Table 80: Mexico Interactive Patient Engagement Solutions Industry Volume (K Unit) Forecast, by Application 2019 & 2032
- Table 81: Global Interactive Patient Engagement Solutions Industry Revenue Million Forecast, by Component 2019 & 2032
- Table 82: Global Interactive Patient Engagement Solutions Industry Volume K Unit Forecast, by Component 2019 & 2032
- Table 83: Global Interactive Patient Engagement Solutions Industry Revenue Million Forecast, by Delivery Mode 2019 & 2032
- Table 84: Global Interactive Patient Engagement Solutions Industry Volume K Unit Forecast, by Delivery Mode 2019 & 2032
- Table 85: Global Interactive Patient Engagement Solutions Industry Revenue Million Forecast, by Application 2019 & 2032
- Table 86: Global Interactive Patient Engagement Solutions Industry Volume K Unit Forecast, by Application 2019 & 2032
- Table 87: Global Interactive Patient Engagement Solutions Industry Revenue Million Forecast, by End User 2019 & 2032
- Table 88: Global Interactive Patient Engagement Solutions Industry Volume K Unit Forecast, by End User 2019 & 2032
- Table 89: Global Interactive Patient Engagement Solutions Industry Revenue Million Forecast, by Country 2019 & 2032
- Table 90: Global Interactive Patient Engagement Solutions Industry Volume K Unit Forecast, by Country 2019 & 2032
- Table 91: Germany Interactive Patient Engagement Solutions Industry Revenue (Million) Forecast, by Application 2019 & 2032
- Table 92: Germany Interactive Patient Engagement Solutions Industry Volume (K Unit) Forecast, by Application 2019 & 2032
- Table 93: United Kingdom Interactive Patient Engagement Solutions Industry Revenue (Million) Forecast, by Application 2019 & 2032
- Table 94: United Kingdom Interactive Patient Engagement Solutions Industry Volume (K Unit) Forecast, by Application 2019 & 2032
- Table 95: France Interactive Patient Engagement Solutions Industry Revenue (Million) Forecast, by Application 2019 & 2032
- Table 96: France Interactive Patient Engagement Solutions Industry Volume (K Unit) Forecast, by Application 2019 & 2032
- Table 97: Italy Interactive Patient Engagement Solutions Industry Revenue (Million) Forecast, by Application 2019 & 2032
- Table 98: Italy Interactive Patient Engagement Solutions Industry Volume (K Unit) Forecast, by Application 2019 & 2032
- Table 99: Spain Interactive Patient Engagement Solutions Industry Revenue (Million) Forecast, by Application 2019 & 2032
- Table 100: Spain Interactive Patient Engagement Solutions Industry Volume (K Unit) Forecast, by Application 2019 & 2032
- Table 101: Rest of Europe Interactive Patient Engagement Solutions Industry Revenue (Million) Forecast, by Application 2019 & 2032
- Table 102: Rest of Europe Interactive Patient Engagement Solutions Industry Volume (K Unit) Forecast, by Application 2019 & 2032
- Table 103: Global Interactive Patient Engagement Solutions Industry Revenue Million Forecast, by Component 2019 & 2032
- Table 104: Global Interactive Patient Engagement Solutions Industry Volume K Unit Forecast, by Component 2019 & 2032
- Table 105: Global Interactive Patient Engagement Solutions Industry Revenue Million Forecast, by Delivery Mode 2019 & 2032
- Table 106: Global Interactive Patient Engagement Solutions Industry Volume K Unit Forecast, by Delivery Mode 2019 & 2032
- Table 107: Global Interactive Patient Engagement Solutions Industry Revenue Million Forecast, by Application 2019 & 2032
- Table 108: Global Interactive Patient Engagement Solutions Industry Volume K Unit Forecast, by Application 2019 & 2032
- Table 109: Global Interactive Patient Engagement Solutions Industry Revenue Million Forecast, by End User 2019 & 2032
- Table 110: Global Interactive Patient Engagement Solutions Industry Volume K Unit Forecast, by End User 2019 & 2032
- Table 111: Global Interactive Patient Engagement Solutions Industry Revenue Million Forecast, by Country 2019 & 2032
- Table 112: Global Interactive Patient Engagement Solutions Industry Volume K Unit Forecast, by Country 2019 & 2032
- Table 113: China Interactive Patient Engagement Solutions Industry Revenue (Million) Forecast, by Application 2019 & 2032
- Table 114: China Interactive Patient Engagement Solutions Industry Volume (K Unit) Forecast, by Application 2019 & 2032
- Table 115: Japan Interactive Patient Engagement Solutions Industry Revenue (Million) Forecast, by Application 2019 & 2032
- Table 116: Japan Interactive Patient Engagement Solutions Industry Volume (K Unit) Forecast, by Application 2019 & 2032
- Table 117: India Interactive Patient Engagement Solutions Industry Revenue (Million) Forecast, by Application 2019 & 2032
- Table 118: India Interactive Patient Engagement Solutions Industry Volume (K Unit) Forecast, by Application 2019 & 2032
- Table 119: Australia Interactive Patient Engagement Solutions Industry Revenue (Million) Forecast, by Application 2019 & 2032
- Table 120: Australia Interactive Patient Engagement Solutions Industry Volume (K Unit) Forecast, by Application 2019 & 2032
- Table 121: South Korea Interactive Patient Engagement Solutions Industry Revenue (Million) Forecast, by Application 2019 & 2032
- Table 122: South Korea Interactive Patient Engagement Solutions Industry Volume (K Unit) Forecast, by Application 2019 & 2032
- Table 123: Rest of Asia Pacific Interactive Patient Engagement Solutions Industry Revenue (Million) Forecast, by Application 2019 & 2032
- Table 124: Rest of Asia Pacific Interactive Patient Engagement Solutions Industry Volume (K Unit) Forecast, by Application 2019 & 2032
- Table 125: Global Interactive Patient Engagement Solutions Industry Revenue Million Forecast, by Component 2019 & 2032
- Table 126: Global Interactive Patient Engagement Solutions Industry Volume K Unit Forecast, by Component 2019 & 2032
- Table 127: Global Interactive Patient Engagement Solutions Industry Revenue Million Forecast, by Delivery Mode 2019 & 2032
- Table 128: Global Interactive Patient Engagement Solutions Industry Volume K Unit Forecast, by Delivery Mode 2019 & 2032
- Table 129: Global Interactive Patient Engagement Solutions Industry Revenue Million Forecast, by Application 2019 & 2032
- Table 130: Global Interactive Patient Engagement Solutions Industry Volume K Unit Forecast, by Application 2019 & 2032
- Table 131: Global Interactive Patient Engagement Solutions Industry Revenue Million Forecast, by End User 2019 & 2032
- Table 132: Global Interactive Patient Engagement Solutions Industry Volume K Unit Forecast, by End User 2019 & 2032
- Table 133: Global Interactive Patient Engagement Solutions Industry Revenue Million Forecast, by Country 2019 & 2032
- Table 134: Global Interactive Patient Engagement Solutions Industry Volume K Unit Forecast, by Country 2019 & 2032
- Table 135: GCC Interactive Patient Engagement Solutions Industry Revenue (Million) Forecast, by Application 2019 & 2032
- Table 136: GCC Interactive Patient Engagement Solutions Industry Volume (K Unit) Forecast, by Application 2019 & 2032
- Table 137: South Africa Interactive Patient Engagement Solutions Industry Revenue (Million) Forecast, by Application 2019 & 2032
- Table 138: South Africa Interactive Patient Engagement Solutions Industry Volume (K Unit) Forecast, by Application 2019 & 2032
- Table 139: Rest of Middle East and Africa Interactive Patient Engagement Solutions Industry Revenue (Million) Forecast, by Application 2019 & 2032
- Table 140: Rest of Middle East and Africa Interactive Patient Engagement Solutions Industry Volume (K Unit) Forecast, by Application 2019 & 2032
- Table 141: Global Interactive Patient Engagement Solutions Industry Revenue Million Forecast, by Component 2019 & 2032
- Table 142: Global Interactive Patient Engagement Solutions Industry Volume K Unit Forecast, by Component 2019 & 2032
- Table 143: Global Interactive Patient Engagement Solutions Industry Revenue Million Forecast, by Delivery Mode 2019 & 2032
- Table 144: Global Interactive Patient Engagement Solutions Industry Volume K Unit Forecast, by Delivery Mode 2019 & 2032
- Table 145: Global Interactive Patient Engagement Solutions Industry Revenue Million Forecast, by Application 2019 & 2032
- Table 146: Global Interactive Patient Engagement Solutions Industry Volume K Unit Forecast, by Application 2019 & 2032
- Table 147: Global Interactive Patient Engagement Solutions Industry Revenue Million Forecast, by End User 2019 & 2032
- Table 148: Global Interactive Patient Engagement Solutions Industry Volume K Unit Forecast, by End User 2019 & 2032
- Table 149: Global Interactive Patient Engagement Solutions Industry Revenue Million Forecast, by Country 2019 & 2032
- Table 150: Global Interactive Patient Engagement Solutions Industry Volume K Unit Forecast, by Country 2019 & 2032
- Table 151: Brazil Interactive Patient Engagement Solutions Industry Revenue (Million) Forecast, by Application 2019 & 2032
- Table 152: Brazil Interactive Patient Engagement Solutions Industry Volume (K Unit) Forecast, by Application 2019 & 2032
- Table 153: Argentina Interactive Patient Engagement Solutions Industry Revenue (Million) Forecast, by Application 2019 & 2032
- Table 154: Argentina Interactive Patient Engagement Solutions Industry Volume (K Unit) Forecast, by Application 2019 & 2032
- Table 155: Rest of South America Interactive Patient Engagement Solutions Industry Revenue (Million) Forecast, by Application 2019 & 2032
- Table 156: Rest of South America Interactive Patient Engagement Solutions Industry Volume (K Unit) Forecast, by Application 2019 & 2032
Frequently Asked Questions
1. What is the projected Compound Annual Growth Rate (CAGR) of the Interactive Patient Engagement Solutions Industry?
The projected CAGR is approximately 14.38%.
2. Which companies are prominent players in the Interactive Patient Engagement Solutions Industry?
Key companies in the market include Athenahealth Inc, MEDHOST, Mckesson Corporation, Medecision Inc, GetWellNetwork Inc, Orion Health Ltd, Cerner Corporation, Welvu, Lincor Solutions, Yourcareuniverse Inc , Allscripts Healthcare Solutions Inc, IBM.
3. What are the main segments of the Interactive Patient Engagement Solutions Industry?
The market segments include Component, Delivery Mode, Application, End User.
4. Can you provide details about the market size?
The market size is estimated to be USD 24.00 Million as of 2022.
5. What are some drivers contributing to market growth?
Rising Trend of Mobile Health Applications; Growing Popularity of Patient Engagement Solutions Among the Aging Population; Rising Investments and Technological advancements.
6. What are the notable trends driving market growth?
Web-based and Cloud-based Services Segment is Expected to Witness Growth Over the Forecast Period.
7. Are there any restraints impacting market growth?
Protection of Patient Information; Lack of Skilled IT Professionals in the Healthcare Industry.
8. Can you provide examples of recent developments in the market?
In March 2022, DeliverHealth launched its partner program. DeliverHealth program supports strategic partners within the eco-system, growing sales domestically and internationally while enabling healthcare organizations to simplify the daily complexities of healthcare, improve patient outcomes and reduce overall costs.
9. What pricing options are available for accessing the report?
Pricing options include single-user, multi-user, and enterprise licenses priced at USD 4750, USD 5250, and USD 8750 respectively.
10. Is the market size provided in terms of value or volume?
The market size is provided in terms of value, measured in Million and volume, measured in K Unit.
11. Are there any specific market keywords associated with the report?
Yes, the market keyword associated with the report is "Interactive Patient Engagement Solutions Industry," which aids in identifying and referencing the specific market segment covered.
12. How do I determine which pricing option suits my needs best?
The pricing options vary based on user requirements and access needs. Individual users may opt for single-user licenses, while businesses requiring broader access may choose multi-user or enterprise licenses for cost-effective access to the report.
13. Are there any additional resources or data provided in the Interactive Patient Engagement Solutions Industry report?
While the report offers comprehensive insights, it's advisable to review the specific contents or supplementary materials provided to ascertain if additional resources or data are available.
14. How can I stay updated on further developments or reports in the Interactive Patient Engagement Solutions Industry?
To stay informed about further developments, trends, and reports in the Interactive Patient Engagement Solutions Industry, consider subscribing to industry newsletters, following relevant companies and organizations, or regularly checking reputable industry news sources and publications.
Methodology
Step 1 - Identification of Relevant Samples Size from Population Database


Step 2 - Approaches for Defining Global Market Size (Value, Volume* & Price*)

Note*: In applicable scenarios
Step 3 - Data Sources
Primary Research
- Web Analytics
- Survey Reports
- Research Institute
- Latest Research Reports
- Opinion Leaders
Secondary Research
- Annual Reports
- White Paper
- Latest Press Release
- Industry Association
- Paid Database
- Investor Presentations

Step 4 - Data Triangulation
Involves using different sources of information in order to increase the validity of a study
These sources are likely to be stakeholders in a program - participants, other researchers, program staff, other community members, and so on.
Then we put all data in single framework & apply various statistical tools to find out the dynamic on the market.
During the analysis stage, feedback from the stakeholder groups would be compared to determine areas of agreement as well as areas of divergence
