

Key Insights
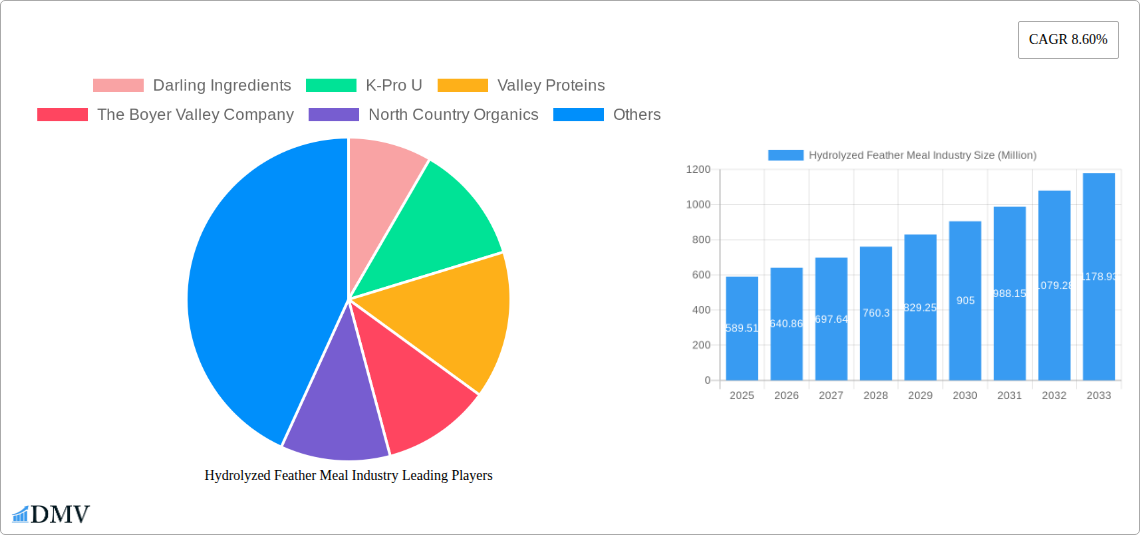
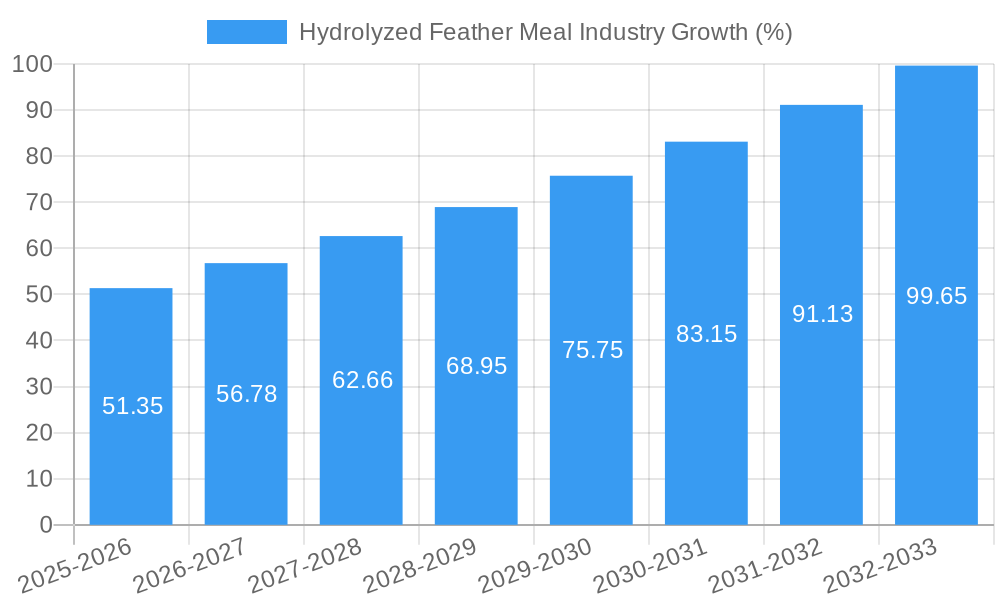
The hydrolyzed feather meal market, valued at $589.51 million in 2025, is projected to experience robust growth, driven by increasing demand from the animal feed industry. This surge is fueled by the rising global population and consequently higher meat consumption, necessitating cost-effective and sustainable protein sources for livestock. Hydrolyzed feather meal offers a valuable alternative to traditional protein sources, providing essential amino acids while mitigating environmental concerns associated with feather waste disposal. The organic segment is anticipated to witness significant growth due to the growing consumer preference for organic and sustainably produced animal products. Application-wise, animal feed will continue to dominate the market, followed by agrochemicals, with "other applications" representing a niche but steadily growing sector potentially including uses in cosmetics or bioplastics. Competition among key players like Darling Ingredients and K-Pro U is expected to remain intense, prompting innovations in production processes and product quality to capture market share. Geographical expansion, particularly in emerging economies with burgeoning livestock industries in Asia-Pacific and South America, presents significant growth opportunities. However, potential regulatory hurdles regarding the use of hydrolyzed feather meal in specific applications and price fluctuations in raw materials could pose challenges to market expansion. The forecast period of 2025-2033 anticipates a consistent CAGR of 8.60%, reflecting the industry's promising outlook.
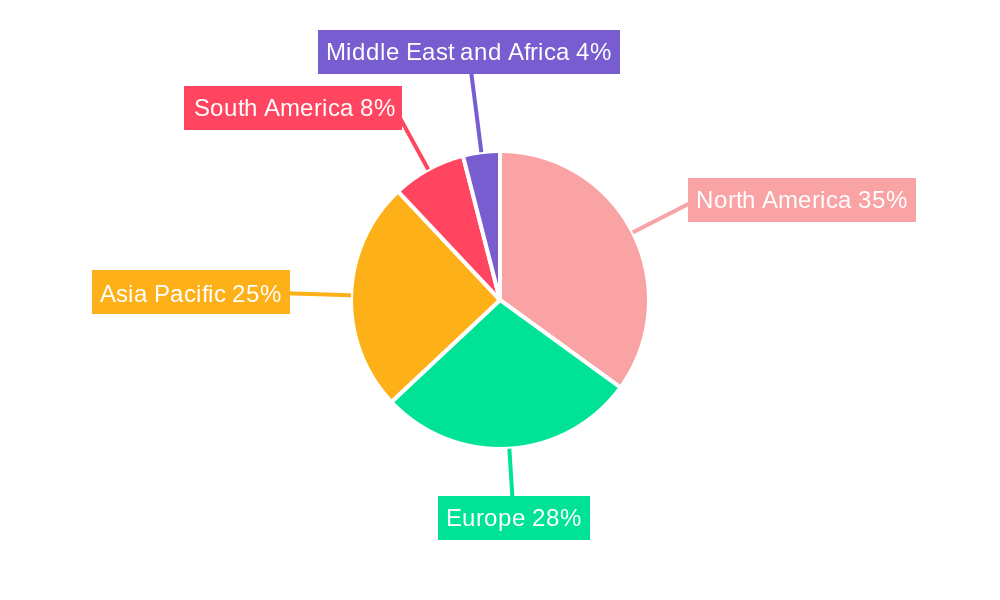
While the conventional segment currently holds the largest market share, the organic segment is poised for substantial growth reflecting the growing consumer demand for environmentally sustainable and ethically sourced products. Regional variations in market dynamics are expected, with North America and Europe maintaining a strong presence due to established markets and stringent regulations. However, Asia-Pacific is projected to witness the most rapid growth, driven by increased livestock production and adoption of cost-effective protein sources. To maintain a competitive edge, companies must focus on developing sustainable and efficient production processes, meeting evolving regulatory requirements, and catering to the increasing consumer demand for transparency and traceability.
Hydrolyzed Feather Meal Industry: A Comprehensive Market Report (2019-2033)
This insightful report provides a detailed analysis of the Hydrolyzed Feather Meal industry, offering a comprehensive overview of market dynamics, growth trajectories, and future opportunities. Covering the period from 2019 to 2033, with a focus on 2025 as the base and estimated year, this report is essential for stakeholders seeking to understand and capitalize on this evolving market. The global Hydrolyzed Feather Meal market is projected to reach xx Million by 2033.
Hydrolyzed Feather Meal Industry Market Composition & Trends
This section delves into the competitive landscape of the Hydrolyzed Feather Meal industry, evaluating market concentration, innovation drivers, regulatory frameworks, substitute products, end-user profiles, and M&A activities. The market is moderately concentrated, with key players holding significant shares. Darling Ingredients, K-Pro U, Valley Proteins, The Boyer Valley Company, North Country Organics, JG Pears, Kleingarn Agrarprodukte, and FASA Group represent prominent participants, though market share distribution varies considerably. Innovation is primarily driven by advancements in hydrolysis technologies, leading to improved product quality and efficiency.
- Market Concentration: Moderately concentrated, with top 5 players holding an estimated xx% market share in 2025.
- Innovation Catalysts: Advancements in hydrolysis technology, focus on sustainable production methods.
- Regulatory Landscape: Varies across regions, impacting production and labeling regulations. Specific regulations are outlined in the full report.
- Substitute Products: Soybean meal, fishmeal, and other protein sources pose competitive threats.
- End-User Profiles: Predominantly animal feed manufacturers, with growing interest from the agrochemical sector.
- M&A Activities: The past five years have witnessed xx Million in M&A activity, primarily focused on expanding production capacity and geographical reach. Specific details of these deals are included in the complete report.
Hydrolyzed Feather Meal Industry Industry Evolution
This section analyzes the historical and projected growth trajectories of the Hydrolyzed Feather Meal industry, exploring technological advancements and evolving consumer demands. From 2019 to 2024, the market experienced a Compound Annual Growth Rate (CAGR) of xx%, driven by increasing demand for sustainable and cost-effective protein sources in animal feed. Technological advancements, such as improved hydrolysis techniques, have enhanced product quality and reduced production costs. Shifting consumer preferences towards sustainably sourced ingredients are further boosting market growth. The forecast period (2025-2033) anticipates a CAGR of xx%, with significant expansion anticipated in emerging markets. The adoption of hydrolyzed feather meal as a sustainable alternative is accelerating, with xx% of animal feed manufacturers incorporating it into their products by 2025.
Leading Regions, Countries, or Segments in Hydrolyzed Feather Meal Industry
This section identifies the dominant regions, countries, and segments within the Hydrolyzed Feather Meal market. While precise market share data for each segment requires further detailed investigation, we are focusing on initial observations and predictions to get a better picture.
- Dominant Region: North America (initial observation)
- Dominant Application: Animal Feed (initial observation)
- Dominant Type: Conventional (initial observation)
Key Drivers:
- Animal Feed: Increasing demand for affordable and sustainable protein sources in animal feed is a primary driver. The growing poultry and livestock industries are significant contributors to this demand.
- Agrochemicals: Emerging applications in agrochemicals are contributing to market growth, although this segment remains relatively small at present.
- Regulatory Support: Government incentives and regulations promoting sustainable agriculture practices in various countries are fostering market expansion. Further detailed investigation is required to accurately quantify this influence across various nations.
Hydrolyzed Feather Meal Industry Product Innovations
Recent product innovations have focused on enhancing the quality and functionality of hydrolyzed feather meal. Improvements in hydrolysis processes have resulted in products with higher protein content and improved digestibility. This has expanded the range of applications, particularly in animal feed formulations where optimized protein profiles are crucial for livestock health and productivity. The development of specialized formulations tailored to specific animal species is another area of innovation, further increasing market penetration.
Propelling Factors for Hydrolyzed Feather Meal Industry Growth
Several factors are driving the growth of the Hydrolyzed Feather Meal industry:
- Technological Advancements: Improved hydrolysis techniques are producing higher-quality products, reducing production costs, and expanding potential applications.
- Economic Factors: Hydrolyzed feather meal offers a cost-effective alternative to traditional protein sources, making it attractive to animal feed manufacturers and other industries.
- Environmental Concerns: The growing awareness of sustainable practices is fueling demand for environmentally friendly protein sources. The use of feather waste reduces landfill burden and promotes circular economy principles.
Obstacles in the Hydrolyzed Feather Meal Industry Market
Despite its growth potential, several challenges hinder the Hydrolyzed Feather Meal market:
- Regulatory hurdles: Varying regulations across different regions create complexities in production, processing, and labeling.
- Supply chain disruptions: Fluctuations in raw material availability can disrupt production and affect market stability.
- Competitive pressures: Competition from other protein sources, particularly soybean meal and fishmeal, presents challenges to market share.
Future Opportunities in Hydrolyzed Feather Meal Industry
The Hydrolyzed Feather Meal industry presents significant opportunities:
- Expansion into new markets: Emerging markets in Asia and Africa present significant growth potential for this sustainable protein source.
- Technological advancements: Further innovation in hydrolysis technologies can enhance product quality and broaden application.
- New applications: Exploration of new applications in areas such as bioplastics and other industrial uses will open further avenues for growth.
Major Players in the Hydrolyzed Feather Meal Industry Ecosystem
- Darling Ingredients
- K-Pro U
- Valley Proteins
- The Boyer Valley Company
- North Country Organics
- JG Pears
- Kleingarn Agrarprodukte
- FASA Group
Key Developments in Hydrolyzed Feather Meal Industry Industry
- September 2021: Indian scientists developed a new hydrodynamic sustainable, affordable technique to turn poultry feathers & animal hair into fertilizer.
- August 2022: The University of Danang - University of Science and Technology successfully produced a bio-organic fertilizer from chicken feathers, aiming to reduce environmental pollution.
Strategic Hydrolyzed Feather Meal Industry Market Forecast
The Hydrolyzed Feather Meal industry is poised for significant growth, driven by increasing demand for sustainable protein sources, technological advancements, and expanding applications. The market is expected to witness robust growth over the forecast period (2025-2033), fueled by continued innovation and expanding adoption across various sectors. The focus on sustainability and cost-effectiveness positions this industry for substantial expansion in the coming years.
Hydrolyzed Feather Meal Industry Segmentation
- 1. Production Analysis
- 2. Consumption Analysis
- 3. Import Market Analysis (Value & Volume)
- 4. Export Market Analysis (Value & Volume)
- 5. Price Trend Analysis
Hydrolyzed Feather Meal Industry Segmentation By Geography
-
1. North America
- 1.1. United States
- 1.2. Canada
- 1.3. Mexico
-
2. South America
- 2.1. Brazil
- 2.2. Argentina
- 2.3. Rest of South America
-
3. Europe
- 3.1. United Kingdom
- 3.2. Germany
- 3.3. France
- 3.4. Italy
- 3.5. Spain
- 3.6. Russia
- 3.7. Benelux
- 3.8. Nordics
- 3.9. Rest of Europe
-
4. Middle East & Africa
- 4.1. Turkey
- 4.2. Israel
- 4.3. GCC
- 4.4. North Africa
- 4.5. South Africa
- 4.6. Rest of Middle East & Africa
-
5. Asia Pacific
- 5.1. China
- 5.2. India
- 5.3. Japan
- 5.4. South Korea
- 5.5. ASEAN
- 5.6. Oceania
- 5.7. Rest of Asia Pacific
Hydrolyzed Feather Meal Industry REPORT HIGHLIGHTS
| Aspects | Details |
|---|---|
| Study Period | 2019-2033 |
| Base Year | 2024 |
| Estimated Year | 2025 |
| Forecast Period | 2025-2033 |
| Historical Period | 2019-2024 |
| Growth Rate | CAGR of 8.60% from 2019-2033 |
| Segmentation |
|
Table of Contents
- 1. Introduction
- 1.1. Research Scope
- 1.2. Market Segmentation
- 1.3. Research Methodology
- 1.4. Definitions and Assumptions
- 2. Executive Summary
- 2.1. Introduction
- 3. Market Dynamics
- 3.1. Introduction
- 3.2. Market Drivers
- 3.2.1. Adoption of Organic and Eco-friendly Farming Practices; Declining Area of Arable Land and Rising Food Security Concerns
- 3.3. Market Restrains
- 3.3.1. High Demand for Conventional and Synthetic Products; Lack of Awareness and Other Factors Limiting the Adoption of Agricultural Inoculants
- 3.4. Market Trends
- 3.4.1. Increasing demand for organic farming accelerating feather meal market
- 4. Market Factor Analysis
- 4.1. Porters Five Forces
- 4.2. Supply/Value Chain
- 4.3. PESTEL analysis
- 4.4. Market Entropy
- 4.5. Patent/Trademark Analysis
- 5. Global Hydrolyzed Feather Meal Industry Analysis, Insights and Forecast, 2019-2031
- 5.1. Market Analysis, Insights and Forecast - by Production Analysis
- 5.2. Market Analysis, Insights and Forecast - by Consumption Analysis
- 5.3. Market Analysis, Insights and Forecast - by Import Market Analysis (Value & Volume)
- 5.4. Market Analysis, Insights and Forecast - by Export Market Analysis (Value & Volume)
- 5.5. Market Analysis, Insights and Forecast - by Price Trend Analysis
- 5.6. Market Analysis, Insights and Forecast - by Region
- 5.6.1. North America
- 5.6.2. South America
- 5.6.3. Europe
- 5.6.4. Middle East & Africa
- 5.6.5. Asia Pacific
- 5.1. Market Analysis, Insights and Forecast - by Production Analysis
- 6. North America Hydrolyzed Feather Meal Industry Analysis, Insights and Forecast, 2019-2031
- 6.1. Market Analysis, Insights and Forecast - by Production Analysis
- 6.2. Market Analysis, Insights and Forecast - by Consumption Analysis
- 6.3. Market Analysis, Insights and Forecast - by Import Market Analysis (Value & Volume)
- 6.4. Market Analysis, Insights and Forecast - by Export Market Analysis (Value & Volume)
- 6.5. Market Analysis, Insights and Forecast - by Price Trend Analysis
- 6.1. Market Analysis, Insights and Forecast - by Production Analysis
- 7. South America Hydrolyzed Feather Meal Industry Analysis, Insights and Forecast, 2019-2031
- 7.1. Market Analysis, Insights and Forecast - by Production Analysis
- 7.2. Market Analysis, Insights and Forecast - by Consumption Analysis
- 7.3. Market Analysis, Insights and Forecast - by Import Market Analysis (Value & Volume)
- 7.4. Market Analysis, Insights and Forecast - by Export Market Analysis (Value & Volume)
- 7.5. Market Analysis, Insights and Forecast - by Price Trend Analysis
- 7.1. Market Analysis, Insights and Forecast - by Production Analysis
- 8. Europe Hydrolyzed Feather Meal Industry Analysis, Insights and Forecast, 2019-2031
- 8.1. Market Analysis, Insights and Forecast - by Production Analysis
- 8.2. Market Analysis, Insights and Forecast - by Consumption Analysis
- 8.3. Market Analysis, Insights and Forecast - by Import Market Analysis (Value & Volume)
- 8.4. Market Analysis, Insights and Forecast - by Export Market Analysis (Value & Volume)
- 8.5. Market Analysis, Insights and Forecast - by Price Trend Analysis
- 8.1. Market Analysis, Insights and Forecast - by Production Analysis
- 9. Middle East & Africa Hydrolyzed Feather Meal Industry Analysis, Insights and Forecast, 2019-2031
- 9.1. Market Analysis, Insights and Forecast - by Production Analysis
- 9.2. Market Analysis, Insights and Forecast - by Consumption Analysis
- 9.3. Market Analysis, Insights and Forecast - by Import Market Analysis (Value & Volume)
- 9.4. Market Analysis, Insights and Forecast - by Export Market Analysis (Value & Volume)
- 9.5. Market Analysis, Insights and Forecast - by Price Trend Analysis
- 9.1. Market Analysis, Insights and Forecast - by Production Analysis
- 10. Asia Pacific Hydrolyzed Feather Meal Industry Analysis, Insights and Forecast, 2019-2031
- 10.1. Market Analysis, Insights and Forecast - by Production Analysis
- 10.2. Market Analysis, Insights and Forecast - by Consumption Analysis
- 10.3. Market Analysis, Insights and Forecast - by Import Market Analysis (Value & Volume)
- 10.4. Market Analysis, Insights and Forecast - by Export Market Analysis (Value & Volume)
- 10.5. Market Analysis, Insights and Forecast - by Price Trend Analysis
- 10.1. Market Analysis, Insights and Forecast - by Production Analysis
- 11. North America Hydrolyzed Feather Meal Industry Analysis, Insights and Forecast, 2019-2031
- 11.1. Market Analysis, Insights and Forecast - By Country/Sub-region
- 11.1.1 United States
- 11.1.2 Canada
- 11.1.3 Mexico
- 11.1.4 Rest of North America
- 12. Europe Hydrolyzed Feather Meal Industry Analysis, Insights and Forecast, 2019-2031
- 12.1. Market Analysis, Insights and Forecast - By Country/Sub-region
- 12.1.1 Germany
- 12.1.2 United Kingdom
- 12.1.3 France
- 12.1.4 Russia
- 12.1.5 Spain
- 12.1.6 Rest of Europe
- 13. Asia Pacific Hydrolyzed Feather Meal Industry Analysis, Insights and Forecast, 2019-2031
- 13.1. Market Analysis, Insights and Forecast - By Country/Sub-region
- 13.1.1 China
- 13.1.2 India
- 13.1.3 Japan
- 13.1.4 Indonesia
- 13.1.5 Rest of Asia Pacific
- 14. South America Hydrolyzed Feather Meal Industry Analysis, Insights and Forecast, 2019-2031
- 14.1. Market Analysis, Insights and Forecast - By Country/Sub-region
- 14.1.1 Brazil
- 14.1.2 Argentina
- 14.1.3 Rest of South America
- 15. Middle East and Africa Hydrolyzed Feather Meal Industry Analysis, Insights and Forecast, 2019-2031
- 15.1. Market Analysis, Insights and Forecast - By Country/Sub-region
- 15.1.1 South Africa
- 15.1.2 Egypt
- 15.1.3 Rest of Middle East and Africa
- 16. Competitive Analysis
- 16.1. Global Market Share Analysis 2024
- 16.2. Company Profiles
- 16.2.1 Darling Ingredients
- 16.2.1.1. Overview
- 16.2.1.2. Products
- 16.2.1.3. SWOT Analysis
- 16.2.1.4. Recent Developments
- 16.2.1.5. Financials (Based on Availability)
- 16.2.2 K-Pro U
- 16.2.2.1. Overview
- 16.2.2.2. Products
- 16.2.2.3. SWOT Analysis
- 16.2.2.4. Recent Developments
- 16.2.2.5. Financials (Based on Availability)
- 16.2.3 Valley Proteins
- 16.2.3.1. Overview
- 16.2.3.2. Products
- 16.2.3.3. SWOT Analysis
- 16.2.3.4. Recent Developments
- 16.2.3.5. Financials (Based on Availability)
- 16.2.4 The Boyer Valley Company
- 16.2.4.1. Overview
- 16.2.4.2. Products
- 16.2.4.3. SWOT Analysis
- 16.2.4.4. Recent Developments
- 16.2.4.5. Financials (Based on Availability)
- 16.2.5 North Country Organics
- 16.2.5.1. Overview
- 16.2.5.2. Products
- 16.2.5.3. SWOT Analysis
- 16.2.5.4. Recent Developments
- 16.2.5.5. Financials (Based on Availability)
- 16.2.6 JG Pears
- 16.2.6.1. Overview
- 16.2.6.2. Products
- 16.2.6.3. SWOT Analysis
- 16.2.6.4. Recent Developments
- 16.2.6.5. Financials (Based on Availability)
- 16.2.7 Kleingarn Agrarprodukte
- 16.2.7.1. Overview
- 16.2.7.2. Products
- 16.2.7.3. SWOT Analysis
- 16.2.7.4. Recent Developments
- 16.2.7.5. Financials (Based on Availability)
- 16.2.8 FASA Group
- 16.2.8.1. Overview
- 16.2.8.2. Products
- 16.2.8.3. SWOT Analysis
- 16.2.8.4. Recent Developments
- 16.2.8.5. Financials (Based on Availability)
- 16.2.1 Darling Ingredients
List of Figures
- Figure 1: Global Hydrolyzed Feather Meal Industry Revenue Breakdown (Million, %) by Region 2024 & 2032
- Figure 2: North America Hydrolyzed Feather Meal Industry Revenue (Million), by Country 2024 & 2032
- Figure 3: North America Hydrolyzed Feather Meal Industry Revenue Share (%), by Country 2024 & 2032
- Figure 4: Europe Hydrolyzed Feather Meal Industry Revenue (Million), by Country 2024 & 2032
- Figure 5: Europe Hydrolyzed Feather Meal Industry Revenue Share (%), by Country 2024 & 2032
- Figure 6: Asia Pacific Hydrolyzed Feather Meal Industry Revenue (Million), by Country 2024 & 2032
- Figure 7: Asia Pacific Hydrolyzed Feather Meal Industry Revenue Share (%), by Country 2024 & 2032
- Figure 8: South America Hydrolyzed Feather Meal Industry Revenue (Million), by Country 2024 & 2032
- Figure 9: South America Hydrolyzed Feather Meal Industry Revenue Share (%), by Country 2024 & 2032
- Figure 10: Middle East and Africa Hydrolyzed Feather Meal Industry Revenue (Million), by Country 2024 & 2032
- Figure 11: Middle East and Africa Hydrolyzed Feather Meal Industry Revenue Share (%), by Country 2024 & 2032
- Figure 12: North America Hydrolyzed Feather Meal Industry Revenue (Million), by Production Analysis 2024 & 2032
- Figure 13: North America Hydrolyzed Feather Meal Industry Revenue Share (%), by Production Analysis 2024 & 2032
- Figure 14: North America Hydrolyzed Feather Meal Industry Revenue (Million), by Consumption Analysis 2024 & 2032
- Figure 15: North America Hydrolyzed Feather Meal Industry Revenue Share (%), by Consumption Analysis 2024 & 2032
- Figure 16: North America Hydrolyzed Feather Meal Industry Revenue (Million), by Import Market Analysis (Value & Volume) 2024 & 2032
- Figure 17: North America Hydrolyzed Feather Meal Industry Revenue Share (%), by Import Market Analysis (Value & Volume) 2024 & 2032
- Figure 18: North America Hydrolyzed Feather Meal Industry Revenue (Million), by Export Market Analysis (Value & Volume) 2024 & 2032
- Figure 19: North America Hydrolyzed Feather Meal Industry Revenue Share (%), by Export Market Analysis (Value & Volume) 2024 & 2032
- Figure 20: North America Hydrolyzed Feather Meal Industry Revenue (Million), by Price Trend Analysis 2024 & 2032
- Figure 21: North America Hydrolyzed Feather Meal Industry Revenue Share (%), by Price Trend Analysis 2024 & 2032
- Figure 22: North America Hydrolyzed Feather Meal Industry Revenue (Million), by Country 2024 & 2032
- Figure 23: North America Hydrolyzed Feather Meal Industry Revenue Share (%), by Country 2024 & 2032
- Figure 24: South America Hydrolyzed Feather Meal Industry Revenue (Million), by Production Analysis 2024 & 2032
- Figure 25: South America Hydrolyzed Feather Meal Industry Revenue Share (%), by Production Analysis 2024 & 2032
- Figure 26: South America Hydrolyzed Feather Meal Industry Revenue (Million), by Consumption Analysis 2024 & 2032
- Figure 27: South America Hydrolyzed Feather Meal Industry Revenue Share (%), by Consumption Analysis 2024 & 2032
- Figure 28: South America Hydrolyzed Feather Meal Industry Revenue (Million), by Import Market Analysis (Value & Volume) 2024 & 2032
- Figure 29: South America Hydrolyzed Feather Meal Industry Revenue Share (%), by Import Market Analysis (Value & Volume) 2024 & 2032
- Figure 30: South America Hydrolyzed Feather Meal Industry Revenue (Million), by Export Market Analysis (Value & Volume) 2024 & 2032
- Figure 31: South America Hydrolyzed Feather Meal Industry Revenue Share (%), by Export Market Analysis (Value & Volume) 2024 & 2032
- Figure 32: South America Hydrolyzed Feather Meal Industry Revenue (Million), by Price Trend Analysis 2024 & 2032
- Figure 33: South America Hydrolyzed Feather Meal Industry Revenue Share (%), by Price Trend Analysis 2024 & 2032
- Figure 34: South America Hydrolyzed Feather Meal Industry Revenue (Million), by Country 2024 & 2032
- Figure 35: South America Hydrolyzed Feather Meal Industry Revenue Share (%), by Country 2024 & 2032
- Figure 36: Europe Hydrolyzed Feather Meal Industry Revenue (Million), by Production Analysis 2024 & 2032
- Figure 37: Europe Hydrolyzed Feather Meal Industry Revenue Share (%), by Production Analysis 2024 & 2032
- Figure 38: Europe Hydrolyzed Feather Meal Industry Revenue (Million), by Consumption Analysis 2024 & 2032
- Figure 39: Europe Hydrolyzed Feather Meal Industry Revenue Share (%), by Consumption Analysis 2024 & 2032
- Figure 40: Europe Hydrolyzed Feather Meal Industry Revenue (Million), by Import Market Analysis (Value & Volume) 2024 & 2032
- Figure 41: Europe Hydrolyzed Feather Meal Industry Revenue Share (%), by Import Market Analysis (Value & Volume) 2024 & 2032
- Figure 42: Europe Hydrolyzed Feather Meal Industry Revenue (Million), by Export Market Analysis (Value & Volume) 2024 & 2032
- Figure 43: Europe Hydrolyzed Feather Meal Industry Revenue Share (%), by Export Market Analysis (Value & Volume) 2024 & 2032
- Figure 44: Europe Hydrolyzed Feather Meal Industry Revenue (Million), by Price Trend Analysis 2024 & 2032
- Figure 45: Europe Hydrolyzed Feather Meal Industry Revenue Share (%), by Price Trend Analysis 2024 & 2032
- Figure 46: Europe Hydrolyzed Feather Meal Industry Revenue (Million), by Country 2024 & 2032
- Figure 47: Europe Hydrolyzed Feather Meal Industry Revenue Share (%), by Country 2024 & 2032
- Figure 48: Middle East & Africa Hydrolyzed Feather Meal Industry Revenue (Million), by Production Analysis 2024 & 2032
- Figure 49: Middle East & Africa Hydrolyzed Feather Meal Industry Revenue Share (%), by Production Analysis 2024 & 2032
- Figure 50: Middle East & Africa Hydrolyzed Feather Meal Industry Revenue (Million), by Consumption Analysis 2024 & 2032
- Figure 51: Middle East & Africa Hydrolyzed Feather Meal Industry Revenue Share (%), by Consumption Analysis 2024 & 2032
- Figure 52: Middle East & Africa Hydrolyzed Feather Meal Industry Revenue (Million), by Import Market Analysis (Value & Volume) 2024 & 2032
- Figure 53: Middle East & Africa Hydrolyzed Feather Meal Industry Revenue Share (%), by Import Market Analysis (Value & Volume) 2024 & 2032
- Figure 54: Middle East & Africa Hydrolyzed Feather Meal Industry Revenue (Million), by Export Market Analysis (Value & Volume) 2024 & 2032
- Figure 55: Middle East & Africa Hydrolyzed Feather Meal Industry Revenue Share (%), by Export Market Analysis (Value & Volume) 2024 & 2032
- Figure 56: Middle East & Africa Hydrolyzed Feather Meal Industry Revenue (Million), by Price Trend Analysis 2024 & 2032
- Figure 57: Middle East & Africa Hydrolyzed Feather Meal Industry Revenue Share (%), by Price Trend Analysis 2024 & 2032
- Figure 58: Middle East & Africa Hydrolyzed Feather Meal Industry Revenue (Million), by Country 2024 & 2032
- Figure 59: Middle East & Africa Hydrolyzed Feather Meal Industry Revenue Share (%), by Country 2024 & 2032
- Figure 60: Asia Pacific Hydrolyzed Feather Meal Industry Revenue (Million), by Production Analysis 2024 & 2032
- Figure 61: Asia Pacific Hydrolyzed Feather Meal Industry Revenue Share (%), by Production Analysis 2024 & 2032
- Figure 62: Asia Pacific Hydrolyzed Feather Meal Industry Revenue (Million), by Consumption Analysis 2024 & 2032
- Figure 63: Asia Pacific Hydrolyzed Feather Meal Industry Revenue Share (%), by Consumption Analysis 2024 & 2032
- Figure 64: Asia Pacific Hydrolyzed Feather Meal Industry Revenue (Million), by Import Market Analysis (Value & Volume) 2024 & 2032
- Figure 65: Asia Pacific Hydrolyzed Feather Meal Industry Revenue Share (%), by Import Market Analysis (Value & Volume) 2024 & 2032
- Figure 66: Asia Pacific Hydrolyzed Feather Meal Industry Revenue (Million), by Export Market Analysis (Value & Volume) 2024 & 2032
- Figure 67: Asia Pacific Hydrolyzed Feather Meal Industry Revenue Share (%), by Export Market Analysis (Value & Volume) 2024 & 2032
- Figure 68: Asia Pacific Hydrolyzed Feather Meal Industry Revenue (Million), by Price Trend Analysis 2024 & 2032
- Figure 69: Asia Pacific Hydrolyzed Feather Meal Industry Revenue Share (%), by Price Trend Analysis 2024 & 2032
- Figure 70: Asia Pacific Hydrolyzed Feather Meal Industry Revenue (Million), by Country 2024 & 2032
- Figure 71: Asia Pacific Hydrolyzed Feather Meal Industry Revenue Share (%), by Country 2024 & 2032
List of Tables
- Table 1: Global Hydrolyzed Feather Meal Industry Revenue Million Forecast, by Region 2019 & 2032
- Table 2: Global Hydrolyzed Feather Meal Industry Revenue Million Forecast, by Production Analysis 2019 & 2032
- Table 3: Global Hydrolyzed Feather Meal Industry Revenue Million Forecast, by Consumption Analysis 2019 & 2032
- Table 4: Global Hydrolyzed Feather Meal Industry Revenue Million Forecast, by Import Market Analysis (Value & Volume) 2019 & 2032
- Table 5: Global Hydrolyzed Feather Meal Industry Revenue Million Forecast, by Export Market Analysis (Value & Volume) 2019 & 2032
- Table 6: Global Hydrolyzed Feather Meal Industry Revenue Million Forecast, by Price Trend Analysis 2019 & 2032
- Table 7: Global Hydrolyzed Feather Meal Industry Revenue Million Forecast, by Region 2019 & 2032
- Table 8: Global Hydrolyzed Feather Meal Industry Revenue Million Forecast, by Country 2019 & 2032
- Table 9: United States Hydrolyzed Feather Meal Industry Revenue (Million) Forecast, by Application 2019 & 2032
- Table 10: Canada Hydrolyzed Feather Meal Industry Revenue (Million) Forecast, by Application 2019 & 2032
- Table 11: Mexico Hydrolyzed Feather Meal Industry Revenue (Million) Forecast, by Application 2019 & 2032
- Table 12: Rest of North America Hydrolyzed Feather Meal Industry Revenue (Million) Forecast, by Application 2019 & 2032
- Table 13: Global Hydrolyzed Feather Meal Industry Revenue Million Forecast, by Country 2019 & 2032
- Table 14: Germany Hydrolyzed Feather Meal Industry Revenue (Million) Forecast, by Application 2019 & 2032
- Table 15: United Kingdom Hydrolyzed Feather Meal Industry Revenue (Million) Forecast, by Application 2019 & 2032
- Table 16: France Hydrolyzed Feather Meal Industry Revenue (Million) Forecast, by Application 2019 & 2032
- Table 17: Russia Hydrolyzed Feather Meal Industry Revenue (Million) Forecast, by Application 2019 & 2032
- Table 18: Spain Hydrolyzed Feather Meal Industry Revenue (Million) Forecast, by Application 2019 & 2032
- Table 19: Rest of Europe Hydrolyzed Feather Meal Industry Revenue (Million) Forecast, by Application 2019 & 2032
- Table 20: Global Hydrolyzed Feather Meal Industry Revenue Million Forecast, by Country 2019 & 2032
- Table 21: China Hydrolyzed Feather Meal Industry Revenue (Million) Forecast, by Application 2019 & 2032
- Table 22: India Hydrolyzed Feather Meal Industry Revenue (Million) Forecast, by Application 2019 & 2032
- Table 23: Japan Hydrolyzed Feather Meal Industry Revenue (Million) Forecast, by Application 2019 & 2032
- Table 24: Indonesia Hydrolyzed Feather Meal Industry Revenue (Million) Forecast, by Application 2019 & 2032
- Table 25: Rest of Asia Pacific Hydrolyzed Feather Meal Industry Revenue (Million) Forecast, by Application 2019 & 2032
- Table 26: Global Hydrolyzed Feather Meal Industry Revenue Million Forecast, by Country 2019 & 2032
- Table 27: Brazil Hydrolyzed Feather Meal Industry Revenue (Million) Forecast, by Application 2019 & 2032
- Table 28: Argentina Hydrolyzed Feather Meal Industry Revenue (Million) Forecast, by Application 2019 & 2032
- Table 29: Rest of South America Hydrolyzed Feather Meal Industry Revenue (Million) Forecast, by Application 2019 & 2032
- Table 30: Global Hydrolyzed Feather Meal Industry Revenue Million Forecast, by Country 2019 & 2032
- Table 31: South Africa Hydrolyzed Feather Meal Industry Revenue (Million) Forecast, by Application 2019 & 2032
- Table 32: Egypt Hydrolyzed Feather Meal Industry Revenue (Million) Forecast, by Application 2019 & 2032
- Table 33: Rest of Middle East and Africa Hydrolyzed Feather Meal Industry Revenue (Million) Forecast, by Application 2019 & 2032
- Table 34: Global Hydrolyzed Feather Meal Industry Revenue Million Forecast, by Production Analysis 2019 & 2032
- Table 35: Global Hydrolyzed Feather Meal Industry Revenue Million Forecast, by Consumption Analysis 2019 & 2032
- Table 36: Global Hydrolyzed Feather Meal Industry Revenue Million Forecast, by Import Market Analysis (Value & Volume) 2019 & 2032
- Table 37: Global Hydrolyzed Feather Meal Industry Revenue Million Forecast, by Export Market Analysis (Value & Volume) 2019 & 2032
- Table 38: Global Hydrolyzed Feather Meal Industry Revenue Million Forecast, by Price Trend Analysis 2019 & 2032
- Table 39: Global Hydrolyzed Feather Meal Industry Revenue Million Forecast, by Country 2019 & 2032
- Table 40: United States Hydrolyzed Feather Meal Industry Revenue (Million) Forecast, by Application 2019 & 2032
- Table 41: Canada Hydrolyzed Feather Meal Industry Revenue (Million) Forecast, by Application 2019 & 2032
- Table 42: Mexico Hydrolyzed Feather Meal Industry Revenue (Million) Forecast, by Application 2019 & 2032
- Table 43: Global Hydrolyzed Feather Meal Industry Revenue Million Forecast, by Production Analysis 2019 & 2032
- Table 44: Global Hydrolyzed Feather Meal Industry Revenue Million Forecast, by Consumption Analysis 2019 & 2032
- Table 45: Global Hydrolyzed Feather Meal Industry Revenue Million Forecast, by Import Market Analysis (Value & Volume) 2019 & 2032
- Table 46: Global Hydrolyzed Feather Meal Industry Revenue Million Forecast, by Export Market Analysis (Value & Volume) 2019 & 2032
- Table 47: Global Hydrolyzed Feather Meal Industry Revenue Million Forecast, by Price Trend Analysis 2019 & 2032
- Table 48: Global Hydrolyzed Feather Meal Industry Revenue Million Forecast, by Country 2019 & 2032
- Table 49: Brazil Hydrolyzed Feather Meal Industry Revenue (Million) Forecast, by Application 2019 & 2032
- Table 50: Argentina Hydrolyzed Feather Meal Industry Revenue (Million) Forecast, by Application 2019 & 2032
- Table 51: Rest of South America Hydrolyzed Feather Meal Industry Revenue (Million) Forecast, by Application 2019 & 2032
- Table 52: Global Hydrolyzed Feather Meal Industry Revenue Million Forecast, by Production Analysis 2019 & 2032
- Table 53: Global Hydrolyzed Feather Meal Industry Revenue Million Forecast, by Consumption Analysis 2019 & 2032
- Table 54: Global Hydrolyzed Feather Meal Industry Revenue Million Forecast, by Import Market Analysis (Value & Volume) 2019 & 2032
- Table 55: Global Hydrolyzed Feather Meal Industry Revenue Million Forecast, by Export Market Analysis (Value & Volume) 2019 & 2032
- Table 56: Global Hydrolyzed Feather Meal Industry Revenue Million Forecast, by Price Trend Analysis 2019 & 2032
- Table 57: Global Hydrolyzed Feather Meal Industry Revenue Million Forecast, by Country 2019 & 2032
- Table 58: United Kingdom Hydrolyzed Feather Meal Industry Revenue (Million) Forecast, by Application 2019 & 2032
- Table 59: Germany Hydrolyzed Feather Meal Industry Revenue (Million) Forecast, by Application 2019 & 2032
- Table 60: France Hydrolyzed Feather Meal Industry Revenue (Million) Forecast, by Application 2019 & 2032
- Table 61: Italy Hydrolyzed Feather Meal Industry Revenue (Million) Forecast, by Application 2019 & 2032
- Table 62: Spain Hydrolyzed Feather Meal Industry Revenue (Million) Forecast, by Application 2019 & 2032
- Table 63: Russia Hydrolyzed Feather Meal Industry Revenue (Million) Forecast, by Application 2019 & 2032
- Table 64: Benelux Hydrolyzed Feather Meal Industry Revenue (Million) Forecast, by Application 2019 & 2032
- Table 65: Nordics Hydrolyzed Feather Meal Industry Revenue (Million) Forecast, by Application 2019 & 2032
- Table 66: Rest of Europe Hydrolyzed Feather Meal Industry Revenue (Million) Forecast, by Application 2019 & 2032
- Table 67: Global Hydrolyzed Feather Meal Industry Revenue Million Forecast, by Production Analysis 2019 & 2032
- Table 68: Global Hydrolyzed Feather Meal Industry Revenue Million Forecast, by Consumption Analysis 2019 & 2032
- Table 69: Global Hydrolyzed Feather Meal Industry Revenue Million Forecast, by Import Market Analysis (Value & Volume) 2019 & 2032
- Table 70: Global Hydrolyzed Feather Meal Industry Revenue Million Forecast, by Export Market Analysis (Value & Volume) 2019 & 2032
- Table 71: Global Hydrolyzed Feather Meal Industry Revenue Million Forecast, by Price Trend Analysis 2019 & 2032
- Table 72: Global Hydrolyzed Feather Meal Industry Revenue Million Forecast, by Country 2019 & 2032
- Table 73: Turkey Hydrolyzed Feather Meal Industry Revenue (Million) Forecast, by Application 2019 & 2032
- Table 74: Israel Hydrolyzed Feather Meal Industry Revenue (Million) Forecast, by Application 2019 & 2032
- Table 75: GCC Hydrolyzed Feather Meal Industry Revenue (Million) Forecast, by Application 2019 & 2032
- Table 76: North Africa Hydrolyzed Feather Meal Industry Revenue (Million) Forecast, by Application 2019 & 2032
- Table 77: South Africa Hydrolyzed Feather Meal Industry Revenue (Million) Forecast, by Application 2019 & 2032
- Table 78: Rest of Middle East & Africa Hydrolyzed Feather Meal Industry Revenue (Million) Forecast, by Application 2019 & 2032
- Table 79: Global Hydrolyzed Feather Meal Industry Revenue Million Forecast, by Production Analysis 2019 & 2032
- Table 80: Global Hydrolyzed Feather Meal Industry Revenue Million Forecast, by Consumption Analysis 2019 & 2032
- Table 81: Global Hydrolyzed Feather Meal Industry Revenue Million Forecast, by Import Market Analysis (Value & Volume) 2019 & 2032
- Table 82: Global Hydrolyzed Feather Meal Industry Revenue Million Forecast, by Export Market Analysis (Value & Volume) 2019 & 2032
- Table 83: Global Hydrolyzed Feather Meal Industry Revenue Million Forecast, by Price Trend Analysis 2019 & 2032
- Table 84: Global Hydrolyzed Feather Meal Industry Revenue Million Forecast, by Country 2019 & 2032
- Table 85: China Hydrolyzed Feather Meal Industry Revenue (Million) Forecast, by Application 2019 & 2032
- Table 86: India Hydrolyzed Feather Meal Industry Revenue (Million) Forecast, by Application 2019 & 2032
- Table 87: Japan Hydrolyzed Feather Meal Industry Revenue (Million) Forecast, by Application 2019 & 2032
- Table 88: South Korea Hydrolyzed Feather Meal Industry Revenue (Million) Forecast, by Application 2019 & 2032
- Table 89: ASEAN Hydrolyzed Feather Meal Industry Revenue (Million) Forecast, by Application 2019 & 2032
- Table 90: Oceania Hydrolyzed Feather Meal Industry Revenue (Million) Forecast, by Application 2019 & 2032
- Table 91: Rest of Asia Pacific Hydrolyzed Feather Meal Industry Revenue (Million) Forecast, by Application 2019 & 2032
Frequently Asked Questions
1. What is the projected Compound Annual Growth Rate (CAGR) of the Hydrolyzed Feather Meal Industry?
The projected CAGR is approximately 8.60%.
2. Which companies are prominent players in the Hydrolyzed Feather Meal Industry?
Key companies in the market include Darling Ingredients, K-Pro U, Valley Proteins, The Boyer Valley Company, North Country Organics, JG Pears, Kleingarn Agrarprodukte, FASA Group.
3. What are the main segments of the Hydrolyzed Feather Meal Industry?
The market segments include Production Analysis, Consumption Analysis, Import Market Analysis (Value & Volume), Export Market Analysis (Value & Volume), Price Trend Analysis.
4. Can you provide details about the market size?
The market size is estimated to be USD 589.51 Million as of 2022.
5. What are some drivers contributing to market growth?
Adoption of Organic and Eco-friendly Farming Practices; Declining Area of Arable Land and Rising Food Security Concerns.
6. What are the notable trends driving market growth?
Increasing demand for organic farming accelerating feather meal market.
7. Are there any restraints impacting market growth?
High Demand for Conventional and Synthetic Products; Lack of Awareness and Other Factors Limiting the Adoption of Agricultural Inoculants.
8. Can you provide examples of recent developments in the market?
August 2022: The University of Danang - University of Science and Technology has successfully made a type of bio-organic fertilizer from chicken feathers with the desire to reduce environmental pollution from by-products such as chicken feathers.
9. What pricing options are available for accessing the report?
Pricing options include single-user, multi-user, and enterprise licenses priced at USD 4750, USD 5250, and USD 8750 respectively.
10. Is the market size provided in terms of value or volume?
The market size is provided in terms of value, measured in Million.
11. Are there any specific market keywords associated with the report?
Yes, the market keyword associated with the report is "Hydrolyzed Feather Meal Industry," which aids in identifying and referencing the specific market segment covered.
12. How do I determine which pricing option suits my needs best?
The pricing options vary based on user requirements and access needs. Individual users may opt for single-user licenses, while businesses requiring broader access may choose multi-user or enterprise licenses for cost-effective access to the report.
13. Are there any additional resources or data provided in the Hydrolyzed Feather Meal Industry report?
While the report offers comprehensive insights, it's advisable to review the specific contents or supplementary materials provided to ascertain if additional resources or data are available.
14. How can I stay updated on further developments or reports in the Hydrolyzed Feather Meal Industry?
To stay informed about further developments, trends, and reports in the Hydrolyzed Feather Meal Industry, consider subscribing to industry newsletters, following relevant companies and organizations, or regularly checking reputable industry news sources and publications.
Methodology
Step 1 - Identification of Relevant Samples Size from Population Database


Step 2 - Approaches for Defining Global Market Size (Value, Volume* & Price*)

Note*: In applicable scenarios
Step 3 - Data Sources
Primary Research
- Web Analytics
- Survey Reports
- Research Institute
- Latest Research Reports
- Opinion Leaders
Secondary Research
- Annual Reports
- White Paper
- Latest Press Release
- Industry Association
- Paid Database
- Investor Presentations

Step 4 - Data Triangulation
Involves using different sources of information in order to increase the validity of a study
These sources are likely to be stakeholders in a program - participants, other researchers, program staff, other community members, and so on.
Then we put all data in single framework & apply various statistical tools to find out the dynamic on the market.
During the analysis stage, feedback from the stakeholder groups would be compared to determine areas of agreement as well as areas of divergence
