

Key Insights
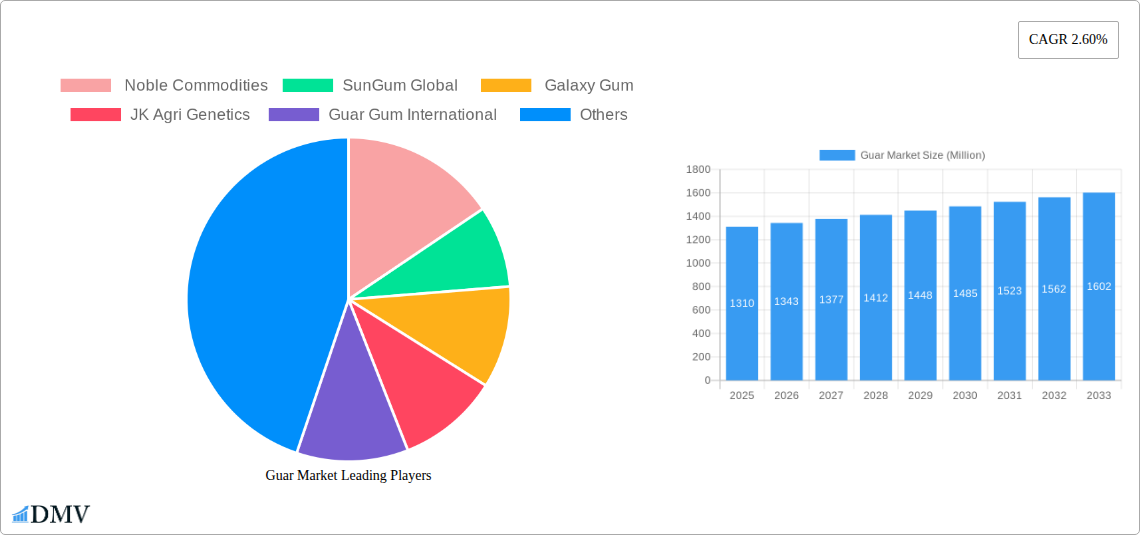
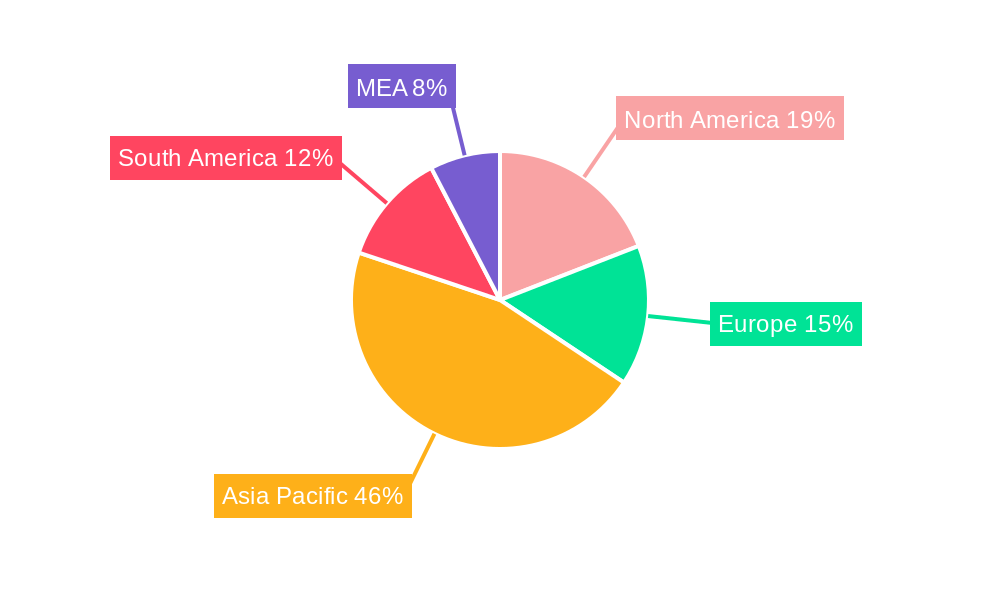
The global guar market, valued at $1.31 billion in 2025, is projected to experience steady growth, driven by increasing demand across diverse sectors. The Compound Annual Growth Rate (CAGR) of 2.60% from 2025 to 2033 indicates a consistent expansion, fueled by several key factors. The food industry's utilization of guar gum as a thickening and stabilizing agent remains a significant driver, alongside its crucial role in the oil and gas sector for fracturing fluids. The pharmaceutical industry also contributes substantially, leveraging guar gum's properties in various formulations. Emerging trends such as the growing popularity of plant-based foods and the increasing demand for sustainable and eco-friendly alternatives are further bolstering market growth. However, price volatility in raw materials and potential supply chain disruptions pose challenges to the market's consistent expansion. Segmentation by type (guar gum and guar meal) and application (food, oil and gas, paper, pharmaceuticals, and others) provides a comprehensive understanding of market dynamics. Leading companies like Noble Commodities, SunGum Global, Galaxy Gum, JK Agri Genetics, and Guar Gum International are actively shaping market competition and innovation. Regional analysis highlights significant contributions from North America, Asia-Pacific, and Europe, with India and China being key players within the Asia-Pacific region.
The forecast period from 2025 to 2033 reveals a promising outlook for the guar market, with consistent growth driven by the aforementioned factors. Further research into specific regional trends and technological advancements within the guar processing and application sectors will be vital for a more nuanced understanding of future market dynamics. The sustained growth in demand from established industries, coupled with the emergence of new applications in areas such as personal care and cosmetics, will play a crucial role in shaping the market's trajectory. While challenges exist, the overall market outlook is positive, reflecting a growing awareness of guar gum's versatility and sustainability as a valuable natural resource.
Guar Market: A Comprehensive Report (2019-2033)
This insightful report provides a deep dive into the Guar Market, offering a comprehensive analysis of market trends, leading players, and future growth projections. Covering the period from 2019 to 2033, with a base year of 2025 and a forecast period of 2025-2033, this report is essential for stakeholders seeking to understand and capitalize on opportunities within this dynamic sector. The report analyzes a market valued at xx Million in 2025, projected to reach xx Million by 2033.
Guar Market Composition & Trends
This section evaluates the competitive landscape, innovation drivers, regulatory environment, substitute products, end-user profiles, and merger & acquisition (M&A) activity within the Guar Market. The market exhibits a moderately concentrated structure, with key players such as Noble Commodities, SunGum Global, Galaxy Gum, JK Agri Genetics, and Guar Gum International holding significant market share. Precise market share distribution for 2025 is estimated at: Noble Commodities (xx%), SunGum Global (xx%), Galaxy Gum (xx%), JK Agri Genetics (xx%), Guar Gum International (xx%), and Others (xx%).
- Market Concentration: Moderate concentration with a few dominant players.
- Innovation Catalysts: Growing demand for sustainable and biodegradable materials fuels innovation in guar gum applications.
- Regulatory Landscape: Stringent regulations, particularly regarding export compliance (as evidenced by the May 2022 DGFT amendment), impact market dynamics.
- Substitute Products: Competition from other hydrocolloids and thickening agents influences market growth.
- End-User Profiles: Diverse end-users spanning food, oil & gas, paper, pharmaceuticals, and other industries drive market demand.
- M&A Activity: The total value of M&A deals in the Guar Market between 2019 and 2024 is estimated at xx Million. Further consolidation is anticipated during the forecast period.
Guar Market Industry Evolution
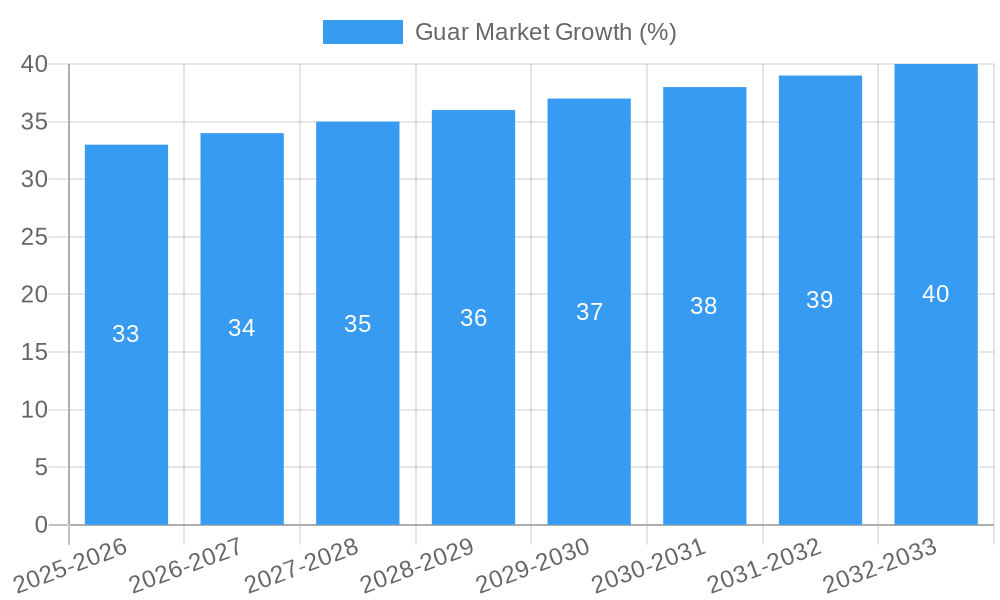
The Guar Market has witnessed significant growth over the historical period (2019-2024), driven primarily by increasing demand from various applications. The market experienced a Compound Annual Growth Rate (CAGR) of xx% during this period. Technological advancements, including improved extraction techniques and the development of novel guar gum derivatives, have further enhanced market expansion. Shifting consumer preferences towards natural and sustainable products have also propelled market growth. The forecast period (2025-2033) anticipates a CAGR of xx%, driven by expanding applications in emerging markets and innovative product development. Adoption of guar gum in specific applications such as food (xx% adoption rate in 2025) and oil & gas (xx% adoption rate in 2025) is expected to further fuel market expansion.
Leading Regions, Countries, or Segments in Guar Market
India currently dominates the global guar market, driven by its extensive guar cultivation and production capacity. Within the market segments, Guar Gum holds the largest market share compared to Guar Meal. The Food industry constitutes the largest application segment for Guar Gum, followed by Oil & Gas, Paper, Pharmaceuticals and Others.
Key Drivers for India's Dominance:
- Abundant guar bean cultivation.
- Established processing infrastructure.
- Favorable government policies (though subject to evolving export regulations).
- Cost-competitiveness.
Segment Analysis:
- Guar Gum: High demand across multiple applications, particularly Food and Oil & Gas.
- Guar Meal: Primarily used as animal feed, with moderate growth potential.
- Food Application: Driven by its thickening and stabilizing properties in various food products.
- Oil & Gas Application: Used as a fracturing fluid in hydraulic fracturing operations.
- Paper Application: Utilized as a binder and sizing agent.
- Pharmaceuticals Application: Used as a binder and tablet disintegrant.
- Others: Includes various niche applications, offering moderate growth potential.
Guar Market Product Innovations
Recent years have witnessed notable product innovations, including the development of modified guar gums with enhanced functionalities. These modifications aim to improve solubility, viscosity, and stability, leading to wider applications in various industries. For instance, the development of a guar gum-chitosan film (October 2021) demonstrates the potential for novel biodegradable packaging solutions. The unique selling propositions (USPs) of these innovative products include improved performance characteristics, reduced environmental impact, and enhanced cost-effectiveness.
Propelling Factors for Guar Market Growth
Several factors contribute to the projected growth of the Guar Market. These include rising demand from various industries, particularly food processing and oil & gas, coupled with technological advancements leading to new applications. Favorable government policies, especially in major guar-producing regions, further support industry growth. Furthermore, the increasing emphasis on sustainable and eco-friendly materials also boosts market demand.
Obstacles in the Guar Market
The Guar Market faces several challenges. These include price volatility due to weather patterns and fluctuating demand. Supply chain disruptions can lead to production shortfalls, impacting market stability. Furthermore, competition from alternative hydrocolloids and stringent regulations, such as the recent amendment on PCP and ETO testing for exports to the EU and UK, add to the obstacles. These challenges can negatively affect market growth by reducing profitability and limiting access to certain markets. Estimated losses due to regulatory changes are approximately xx Million annually.
Future Opportunities in Guar Market
Future opportunities lie in expanding into new markets, particularly in developing economies with growing food and industrial sectors. The development of specialized guar gum derivatives with improved functionalities and the exploration of novel applications in areas like pharmaceuticals and bioplastics will also drive future growth. Further research into sustainable cultivation practices will contribute to the long-term sustainability of the Guar Market.
Major Players in the Guar Market Ecosystem
- Noble Commodities
- SunGum Global
- Galaxy Gum
- JK Agri Genetics
- Guar Gum International
Key Developments in Guar Market Industry
May 2022: The DGFT amended export regulations for guar gum to the EU and UK, mandating PCP and ETO testing and certification. This significantly impacts Indian guar gum exporters, increasing compliance costs and potentially affecting export volumes.
October 2021: Indian scientists developed a biodegradable polymer using guar gum and chitosan, opening new avenues for sustainable packaging and other applications. This innovation could disrupt traditional packaging materials and create new market opportunities.
Strategic Guar Market Forecast
The Guar Market is poised for substantial growth in the coming years. Continued innovation, expanding applications, and the increasing demand for sustainable materials will drive market expansion. Addressing challenges related to supply chain stability and regulatory compliance will be crucial for realizing the full market potential. The projected CAGR of xx% during the forecast period highlights the significant opportunities within this dynamic sector.
Guar Market Segmentation
- 1. Production Analysis
- 2. Consumption Analysis
- 3. Import Market Analysis (Value & Volume)
- 4. Export Market Analysis (Value & Volume)
- 5. Price Trend Analysis
Guar Market Segmentation By Geography
-
1. North America
- 1.1. United States
- 1.2. Canada
-
2. Europe
- 2.1. Germany
- 2.2. France
- 2.3. Russia
- 2.4. Spain
-
3. Asia Pacific
- 3.1. India
- 3.2. China
- 3.3. Japan
- 3.4. Australia
-
4. South America
- 4.1. Brazil
- 4.2. Argentina
-
5. Africa
- 5.1. Malawi
- 5.2. Sudan
Guar Market REPORT HIGHLIGHTS
| Aspects | Details |
|---|---|
| Study Period | 2019-2033 |
| Base Year | 2024 |
| Estimated Year | 2025 |
| Forecast Period | 2025-2033 |
| Historical Period | 2019-2024 |
| Growth Rate | CAGR of 2.60% from 2019-2033 |
| Segmentation |
|
Table of Contents
- 1. Introduction
- 1.1. Research Scope
- 1.2. Market Segmentation
- 1.3. Research Methodology
- 1.4. Definitions and Assumptions
- 2. Executive Summary
- 2.1. Introduction
- 3. Market Dynamics
- 3.1. Introduction
- 3.2. Market Drivers
- 3.2.1. Rising Consumption of Cashew Nuts in the Country; Favorable Government Initiatives
- 3.3. Market Restrains
- 3.3.1. Hazardous Climatic Condition Hinders Cashew Production; Stringent Regulations Related to Food Quality Standards
- 3.4. Market Trends
- 3.4.1. High Demand by End-users
- 4. Market Factor Analysis
- 4.1. Porters Five Forces
- 4.2. Supply/Value Chain
- 4.3. PESTEL analysis
- 4.4. Market Entropy
- 4.5. Patent/Trademark Analysis
- 5. Global Guar Market Analysis, Insights and Forecast, 2019-2031
- 5.1. Market Analysis, Insights and Forecast - by Production Analysis
- 5.2. Market Analysis, Insights and Forecast - by Consumption Analysis
- 5.3. Market Analysis, Insights and Forecast - by Import Market Analysis (Value & Volume)
- 5.4. Market Analysis, Insights and Forecast - by Export Market Analysis (Value & Volume)
- 5.5. Market Analysis, Insights and Forecast - by Price Trend Analysis
- 5.6. Market Analysis, Insights and Forecast - by Region
- 5.6.1. North America
- 5.6.2. Europe
- 5.6.3. Asia Pacific
- 5.6.4. South America
- 5.6.5. Africa
- 5.1. Market Analysis, Insights and Forecast - by Production Analysis
- 6. North America Guar Market Analysis, Insights and Forecast, 2019-2031
- 6.1. Market Analysis, Insights and Forecast - by Production Analysis
- 6.2. Market Analysis, Insights and Forecast - by Consumption Analysis
- 6.3. Market Analysis, Insights and Forecast - by Import Market Analysis (Value & Volume)
- 6.4. Market Analysis, Insights and Forecast - by Export Market Analysis (Value & Volume)
- 6.5. Market Analysis, Insights and Forecast - by Price Trend Analysis
- 6.1. Market Analysis, Insights and Forecast - by Production Analysis
- 7. Europe Guar Market Analysis, Insights and Forecast, 2019-2031
- 7.1. Market Analysis, Insights and Forecast - by Production Analysis
- 7.2. Market Analysis, Insights and Forecast - by Consumption Analysis
- 7.3. Market Analysis, Insights and Forecast - by Import Market Analysis (Value & Volume)
- 7.4. Market Analysis, Insights and Forecast - by Export Market Analysis (Value & Volume)
- 7.5. Market Analysis, Insights and Forecast - by Price Trend Analysis
- 7.1. Market Analysis, Insights and Forecast - by Production Analysis
- 8. Asia Pacific Guar Market Analysis, Insights and Forecast, 2019-2031
- 8.1. Market Analysis, Insights and Forecast - by Production Analysis
- 8.2. Market Analysis, Insights and Forecast - by Consumption Analysis
- 8.3. Market Analysis, Insights and Forecast - by Import Market Analysis (Value & Volume)
- 8.4. Market Analysis, Insights and Forecast - by Export Market Analysis (Value & Volume)
- 8.5. Market Analysis, Insights and Forecast - by Price Trend Analysis
- 8.1. Market Analysis, Insights and Forecast - by Production Analysis
- 9. South America Guar Market Analysis, Insights and Forecast, 2019-2031
- 9.1. Market Analysis, Insights and Forecast - by Production Analysis
- 9.2. Market Analysis, Insights and Forecast - by Consumption Analysis
- 9.3. Market Analysis, Insights and Forecast - by Import Market Analysis (Value & Volume)
- 9.4. Market Analysis, Insights and Forecast - by Export Market Analysis (Value & Volume)
- 9.5. Market Analysis, Insights and Forecast - by Price Trend Analysis
- 9.1. Market Analysis, Insights and Forecast - by Production Analysis
- 10. Africa Guar Market Analysis, Insights and Forecast, 2019-2031
- 10.1. Market Analysis, Insights and Forecast - by Production Analysis
- 10.2. Market Analysis, Insights and Forecast - by Consumption Analysis
- 10.3. Market Analysis, Insights and Forecast - by Import Market Analysis (Value & Volume)
- 10.4. Market Analysis, Insights and Forecast - by Export Market Analysis (Value & Volume)
- 10.5. Market Analysis, Insights and Forecast - by Price Trend Analysis
- 10.1. Market Analysis, Insights and Forecast - by Production Analysis
- 11. South America Guar Market Analysis, Insights and Forecast, 2019-2031
- 11.1. Market Analysis, Insights and Forecast - By Country/Sub-region
- 11.1.1 Brazil
- 11.1.2 Argentina
- 11.1.3 Rest of South America
- 12. North America Guar Market Analysis, Insights and Forecast, 2019-2031
- 12.1. Market Analysis, Insights and Forecast - By Country/Sub-region
- 12.1.1 United States
- 12.1.2 Canada
- 12.1.3 Mexico
- 13. Asia Pacific Guar Market Analysis, Insights and Forecast, 2019-2031
- 13.1. Market Analysis, Insights and Forecast - By Country/Sub-region
- 13.1.1 China
- 13.1.2 Japan
- 13.1.3 India
- 13.1.4 South Korea
- 13.1.5 Taiwan
- 13.1.6 Australia
- 13.1.7 Rest of Asia-Pacific
- 14. Europe Guar Market Analysis, Insights and Forecast, 2019-2031
- 14.1. Market Analysis, Insights and Forecast - By Country/Sub-region
- 14.1.1 Germany
- 14.1.2 France
- 14.1.3 Italy
- 14.1.4 United Kingdom
- 14.1.5 Netherlands
- 14.1.6 Rest of Europe
- 15. MEA Guar Market Analysis, Insights and Forecast, 2019-2031
- 15.1. Market Analysis, Insights and Forecast - By Country/Sub-region
- 15.1.1 Middle East
- 15.1.2 Africa
- 16. Competitive Analysis
- 16.1. Global Market Share Analysis 2024
- 16.2. Company Profiles
- 16.2.1 Noble Commodities
- 16.2.1.1. Overview
- 16.2.1.2. Products
- 16.2.1.3. SWOT Analysis
- 16.2.1.4. Recent Developments
- 16.2.1.5. Financials (Based on Availability)
- 16.2.2 SunGum Global
- 16.2.2.1. Overview
- 16.2.2.2. Products
- 16.2.2.3. SWOT Analysis
- 16.2.2.4. Recent Developments
- 16.2.2.5. Financials (Based on Availability)
- 16.2.3 Galaxy Gum
- 16.2.3.1. Overview
- 16.2.3.2. Products
- 16.2.3.3. SWOT Analysis
- 16.2.3.4. Recent Developments
- 16.2.3.5. Financials (Based on Availability)
- 16.2.4 JK Agri Genetics
- 16.2.4.1. Overview
- 16.2.4.2. Products
- 16.2.4.3. SWOT Analysis
- 16.2.4.4. Recent Developments
- 16.2.4.5. Financials (Based on Availability)
- 16.2.5 Guar Gum International
- 16.2.5.1. Overview
- 16.2.5.2. Products
- 16.2.5.3. SWOT Analysis
- 16.2.5.4. Recent Developments
- 16.2.5.5. Financials (Based on Availability)
- 16.2.1 Noble Commodities
List of Figures
- Figure 1: Global Guar Market Revenue Breakdown (Million, %) by Region 2024 & 2032
- Figure 2: Global Guar Market Volume Breakdown (Kiloton, %) by Region 2024 & 2032
- Figure 3: South America Guar Market Revenue (Million), by Country 2024 & 2032
- Figure 4: South America Guar Market Volume (Kiloton), by Country 2024 & 2032
- Figure 5: South America Guar Market Revenue Share (%), by Country 2024 & 2032
- Figure 6: South America Guar Market Volume Share (%), by Country 2024 & 2032
- Figure 7: North America Guar Market Revenue (Million), by Country 2024 & 2032
- Figure 8: North America Guar Market Volume (Kiloton), by Country 2024 & 2032
- Figure 9: North America Guar Market Revenue Share (%), by Country 2024 & 2032
- Figure 10: North America Guar Market Volume Share (%), by Country 2024 & 2032
- Figure 11: Asia Pacific Guar Market Revenue (Million), by Country 2024 & 2032
- Figure 12: Asia Pacific Guar Market Volume (Kiloton), by Country 2024 & 2032
- Figure 13: Asia Pacific Guar Market Revenue Share (%), by Country 2024 & 2032
- Figure 14: Asia Pacific Guar Market Volume Share (%), by Country 2024 & 2032
- Figure 15: Europe Guar Market Revenue (Million), by Country 2024 & 2032
- Figure 16: Europe Guar Market Volume (Kiloton), by Country 2024 & 2032
- Figure 17: Europe Guar Market Revenue Share (%), by Country 2024 & 2032
- Figure 18: Europe Guar Market Volume Share (%), by Country 2024 & 2032
- Figure 19: MEA Guar Market Revenue (Million), by Country 2024 & 2032
- Figure 20: MEA Guar Market Volume (Kiloton), by Country 2024 & 2032
- Figure 21: MEA Guar Market Revenue Share (%), by Country 2024 & 2032
- Figure 22: MEA Guar Market Volume Share (%), by Country 2024 & 2032
- Figure 23: North America Guar Market Revenue (Million), by Production Analysis 2024 & 2032
- Figure 24: North America Guar Market Volume (Kiloton), by Production Analysis 2024 & 2032
- Figure 25: North America Guar Market Revenue Share (%), by Production Analysis 2024 & 2032
- Figure 26: North America Guar Market Volume Share (%), by Production Analysis 2024 & 2032
- Figure 27: North America Guar Market Revenue (Million), by Consumption Analysis 2024 & 2032
- Figure 28: North America Guar Market Volume (Kiloton), by Consumption Analysis 2024 & 2032
- Figure 29: North America Guar Market Revenue Share (%), by Consumption Analysis 2024 & 2032
- Figure 30: North America Guar Market Volume Share (%), by Consumption Analysis 2024 & 2032
- Figure 31: North America Guar Market Revenue (Million), by Import Market Analysis (Value & Volume) 2024 & 2032
- Figure 32: North America Guar Market Volume (Kiloton), by Import Market Analysis (Value & Volume) 2024 & 2032
- Figure 33: North America Guar Market Revenue Share (%), by Import Market Analysis (Value & Volume) 2024 & 2032
- Figure 34: North America Guar Market Volume Share (%), by Import Market Analysis (Value & Volume) 2024 & 2032
- Figure 35: North America Guar Market Revenue (Million), by Export Market Analysis (Value & Volume) 2024 & 2032
- Figure 36: North America Guar Market Volume (Kiloton), by Export Market Analysis (Value & Volume) 2024 & 2032
- Figure 37: North America Guar Market Revenue Share (%), by Export Market Analysis (Value & Volume) 2024 & 2032
- Figure 38: North America Guar Market Volume Share (%), by Export Market Analysis (Value & Volume) 2024 & 2032
- Figure 39: North America Guar Market Revenue (Million), by Price Trend Analysis 2024 & 2032
- Figure 40: North America Guar Market Volume (Kiloton), by Price Trend Analysis 2024 & 2032
- Figure 41: North America Guar Market Revenue Share (%), by Price Trend Analysis 2024 & 2032
- Figure 42: North America Guar Market Volume Share (%), by Price Trend Analysis 2024 & 2032
- Figure 43: North America Guar Market Revenue (Million), by Country 2024 & 2032
- Figure 44: North America Guar Market Volume (Kiloton), by Country 2024 & 2032
- Figure 45: North America Guar Market Revenue Share (%), by Country 2024 & 2032
- Figure 46: North America Guar Market Volume Share (%), by Country 2024 & 2032
- Figure 47: Europe Guar Market Revenue (Million), by Production Analysis 2024 & 2032
- Figure 48: Europe Guar Market Volume (Kiloton), by Production Analysis 2024 & 2032
- Figure 49: Europe Guar Market Revenue Share (%), by Production Analysis 2024 & 2032
- Figure 50: Europe Guar Market Volume Share (%), by Production Analysis 2024 & 2032
- Figure 51: Europe Guar Market Revenue (Million), by Consumption Analysis 2024 & 2032
- Figure 52: Europe Guar Market Volume (Kiloton), by Consumption Analysis 2024 & 2032
- Figure 53: Europe Guar Market Revenue Share (%), by Consumption Analysis 2024 & 2032
- Figure 54: Europe Guar Market Volume Share (%), by Consumption Analysis 2024 & 2032
- Figure 55: Europe Guar Market Revenue (Million), by Import Market Analysis (Value & Volume) 2024 & 2032
- Figure 56: Europe Guar Market Volume (Kiloton), by Import Market Analysis (Value & Volume) 2024 & 2032
- Figure 57: Europe Guar Market Revenue Share (%), by Import Market Analysis (Value & Volume) 2024 & 2032
- Figure 58: Europe Guar Market Volume Share (%), by Import Market Analysis (Value & Volume) 2024 & 2032
- Figure 59: Europe Guar Market Revenue (Million), by Export Market Analysis (Value & Volume) 2024 & 2032
- Figure 60: Europe Guar Market Volume (Kiloton), by Export Market Analysis (Value & Volume) 2024 & 2032
- Figure 61: Europe Guar Market Revenue Share (%), by Export Market Analysis (Value & Volume) 2024 & 2032
- Figure 62: Europe Guar Market Volume Share (%), by Export Market Analysis (Value & Volume) 2024 & 2032
- Figure 63: Europe Guar Market Revenue (Million), by Price Trend Analysis 2024 & 2032
- Figure 64: Europe Guar Market Volume (Kiloton), by Price Trend Analysis 2024 & 2032
- Figure 65: Europe Guar Market Revenue Share (%), by Price Trend Analysis 2024 & 2032
- Figure 66: Europe Guar Market Volume Share (%), by Price Trend Analysis 2024 & 2032
- Figure 67: Europe Guar Market Revenue (Million), by Country 2024 & 2032
- Figure 68: Europe Guar Market Volume (Kiloton), by Country 2024 & 2032
- Figure 69: Europe Guar Market Revenue Share (%), by Country 2024 & 2032
- Figure 70: Europe Guar Market Volume Share (%), by Country 2024 & 2032
- Figure 71: Asia Pacific Guar Market Revenue (Million), by Production Analysis 2024 & 2032
- Figure 72: Asia Pacific Guar Market Volume (Kiloton), by Production Analysis 2024 & 2032
- Figure 73: Asia Pacific Guar Market Revenue Share (%), by Production Analysis 2024 & 2032
- Figure 74: Asia Pacific Guar Market Volume Share (%), by Production Analysis 2024 & 2032
- Figure 75: Asia Pacific Guar Market Revenue (Million), by Consumption Analysis 2024 & 2032
- Figure 76: Asia Pacific Guar Market Volume (Kiloton), by Consumption Analysis 2024 & 2032
- Figure 77: Asia Pacific Guar Market Revenue Share (%), by Consumption Analysis 2024 & 2032
- Figure 78: Asia Pacific Guar Market Volume Share (%), by Consumption Analysis 2024 & 2032
- Figure 79: Asia Pacific Guar Market Revenue (Million), by Import Market Analysis (Value & Volume) 2024 & 2032
- Figure 80: Asia Pacific Guar Market Volume (Kiloton), by Import Market Analysis (Value & Volume) 2024 & 2032
- Figure 81: Asia Pacific Guar Market Revenue Share (%), by Import Market Analysis (Value & Volume) 2024 & 2032
- Figure 82: Asia Pacific Guar Market Volume Share (%), by Import Market Analysis (Value & Volume) 2024 & 2032
- Figure 83: Asia Pacific Guar Market Revenue (Million), by Export Market Analysis (Value & Volume) 2024 & 2032
- Figure 84: Asia Pacific Guar Market Volume (Kiloton), by Export Market Analysis (Value & Volume) 2024 & 2032
- Figure 85: Asia Pacific Guar Market Revenue Share (%), by Export Market Analysis (Value & Volume) 2024 & 2032
- Figure 86: Asia Pacific Guar Market Volume Share (%), by Export Market Analysis (Value & Volume) 2024 & 2032
- Figure 87: Asia Pacific Guar Market Revenue (Million), by Price Trend Analysis 2024 & 2032
- Figure 88: Asia Pacific Guar Market Volume (Kiloton), by Price Trend Analysis 2024 & 2032
- Figure 89: Asia Pacific Guar Market Revenue Share (%), by Price Trend Analysis 2024 & 2032
- Figure 90: Asia Pacific Guar Market Volume Share (%), by Price Trend Analysis 2024 & 2032
- Figure 91: Asia Pacific Guar Market Revenue (Million), by Country 2024 & 2032
- Figure 92: Asia Pacific Guar Market Volume (Kiloton), by Country 2024 & 2032
- Figure 93: Asia Pacific Guar Market Revenue Share (%), by Country 2024 & 2032
- Figure 94: Asia Pacific Guar Market Volume Share (%), by Country 2024 & 2032
- Figure 95: South America Guar Market Revenue (Million), by Production Analysis 2024 & 2032
- Figure 96: South America Guar Market Volume (Kiloton), by Production Analysis 2024 & 2032
- Figure 97: South America Guar Market Revenue Share (%), by Production Analysis 2024 & 2032
- Figure 98: South America Guar Market Volume Share (%), by Production Analysis 2024 & 2032
- Figure 99: South America Guar Market Revenue (Million), by Consumption Analysis 2024 & 2032
- Figure 100: South America Guar Market Volume (Kiloton), by Consumption Analysis 2024 & 2032
- Figure 101: South America Guar Market Revenue Share (%), by Consumption Analysis 2024 & 2032
- Figure 102: South America Guar Market Volume Share (%), by Consumption Analysis 2024 & 2032
- Figure 103: South America Guar Market Revenue (Million), by Import Market Analysis (Value & Volume) 2024 & 2032
- Figure 104: South America Guar Market Volume (Kiloton), by Import Market Analysis (Value & Volume) 2024 & 2032
- Figure 105: South America Guar Market Revenue Share (%), by Import Market Analysis (Value & Volume) 2024 & 2032
- Figure 106: South America Guar Market Volume Share (%), by Import Market Analysis (Value & Volume) 2024 & 2032
- Figure 107: South America Guar Market Revenue (Million), by Export Market Analysis (Value & Volume) 2024 & 2032
- Figure 108: South America Guar Market Volume (Kiloton), by Export Market Analysis (Value & Volume) 2024 & 2032
- Figure 109: South America Guar Market Revenue Share (%), by Export Market Analysis (Value & Volume) 2024 & 2032
- Figure 110: South America Guar Market Volume Share (%), by Export Market Analysis (Value & Volume) 2024 & 2032
- Figure 111: South America Guar Market Revenue (Million), by Price Trend Analysis 2024 & 2032
- Figure 112: South America Guar Market Volume (Kiloton), by Price Trend Analysis 2024 & 2032
- Figure 113: South America Guar Market Revenue Share (%), by Price Trend Analysis 2024 & 2032
- Figure 114: South America Guar Market Volume Share (%), by Price Trend Analysis 2024 & 2032
- Figure 115: South America Guar Market Revenue (Million), by Country 2024 & 2032
- Figure 116: South America Guar Market Volume (Kiloton), by Country 2024 & 2032
- Figure 117: South America Guar Market Revenue Share (%), by Country 2024 & 2032
- Figure 118: South America Guar Market Volume Share (%), by Country 2024 & 2032
- Figure 119: Africa Guar Market Revenue (Million), by Production Analysis 2024 & 2032
- Figure 120: Africa Guar Market Volume (Kiloton), by Production Analysis 2024 & 2032
- Figure 121: Africa Guar Market Revenue Share (%), by Production Analysis 2024 & 2032
- Figure 122: Africa Guar Market Volume Share (%), by Production Analysis 2024 & 2032
- Figure 123: Africa Guar Market Revenue (Million), by Consumption Analysis 2024 & 2032
- Figure 124: Africa Guar Market Volume (Kiloton), by Consumption Analysis 2024 & 2032
- Figure 125: Africa Guar Market Revenue Share (%), by Consumption Analysis 2024 & 2032
- Figure 126: Africa Guar Market Volume Share (%), by Consumption Analysis 2024 & 2032
- Figure 127: Africa Guar Market Revenue (Million), by Import Market Analysis (Value & Volume) 2024 & 2032
- Figure 128: Africa Guar Market Volume (Kiloton), by Import Market Analysis (Value & Volume) 2024 & 2032
- Figure 129: Africa Guar Market Revenue Share (%), by Import Market Analysis (Value & Volume) 2024 & 2032
- Figure 130: Africa Guar Market Volume Share (%), by Import Market Analysis (Value & Volume) 2024 & 2032
- Figure 131: Africa Guar Market Revenue (Million), by Export Market Analysis (Value & Volume) 2024 & 2032
- Figure 132: Africa Guar Market Volume (Kiloton), by Export Market Analysis (Value & Volume) 2024 & 2032
- Figure 133: Africa Guar Market Revenue Share (%), by Export Market Analysis (Value & Volume) 2024 & 2032
- Figure 134: Africa Guar Market Volume Share (%), by Export Market Analysis (Value & Volume) 2024 & 2032
- Figure 135: Africa Guar Market Revenue (Million), by Price Trend Analysis 2024 & 2032
- Figure 136: Africa Guar Market Volume (Kiloton), by Price Trend Analysis 2024 & 2032
- Figure 137: Africa Guar Market Revenue Share (%), by Price Trend Analysis 2024 & 2032
- Figure 138: Africa Guar Market Volume Share (%), by Price Trend Analysis 2024 & 2032
- Figure 139: Africa Guar Market Revenue (Million), by Country 2024 & 2032
- Figure 140: Africa Guar Market Volume (Kiloton), by Country 2024 & 2032
- Figure 141: Africa Guar Market Revenue Share (%), by Country 2024 & 2032
- Figure 142: Africa Guar Market Volume Share (%), by Country 2024 & 2032
List of Tables
- Table 1: Global Guar Market Revenue Million Forecast, by Region 2019 & 2032
- Table 2: Global Guar Market Volume Kiloton Forecast, by Region 2019 & 2032
- Table 3: Global Guar Market Revenue Million Forecast, by Production Analysis 2019 & 2032
- Table 4: Global Guar Market Volume Kiloton Forecast, by Production Analysis 2019 & 2032
- Table 5: Global Guar Market Revenue Million Forecast, by Consumption Analysis 2019 & 2032
- Table 6: Global Guar Market Volume Kiloton Forecast, by Consumption Analysis 2019 & 2032
- Table 7: Global Guar Market Revenue Million Forecast, by Import Market Analysis (Value & Volume) 2019 & 2032
- Table 8: Global Guar Market Volume Kiloton Forecast, by Import Market Analysis (Value & Volume) 2019 & 2032
- Table 9: Global Guar Market Revenue Million Forecast, by Export Market Analysis (Value & Volume) 2019 & 2032
- Table 10: Global Guar Market Volume Kiloton Forecast, by Export Market Analysis (Value & Volume) 2019 & 2032
- Table 11: Global Guar Market Revenue Million Forecast, by Price Trend Analysis 2019 & 2032
- Table 12: Global Guar Market Volume Kiloton Forecast, by Price Trend Analysis 2019 & 2032
- Table 13: Global Guar Market Revenue Million Forecast, by Region 2019 & 2032
- Table 14: Global Guar Market Volume Kiloton Forecast, by Region 2019 & 2032
- Table 15: Global Guar Market Revenue Million Forecast, by Country 2019 & 2032
- Table 16: Global Guar Market Volume Kiloton Forecast, by Country 2019 & 2032
- Table 17: Brazil Guar Market Revenue (Million) Forecast, by Application 2019 & 2032
- Table 18: Brazil Guar Market Volume (Kiloton) Forecast, by Application 2019 & 2032
- Table 19: Argentina Guar Market Revenue (Million) Forecast, by Application 2019 & 2032
- Table 20: Argentina Guar Market Volume (Kiloton) Forecast, by Application 2019 & 2032
- Table 21: Rest of South America Guar Market Revenue (Million) Forecast, by Application 2019 & 2032
- Table 22: Rest of South America Guar Market Volume (Kiloton) Forecast, by Application 2019 & 2032
- Table 23: Global Guar Market Revenue Million Forecast, by Country 2019 & 2032
- Table 24: Global Guar Market Volume Kiloton Forecast, by Country 2019 & 2032
- Table 25: United States Guar Market Revenue (Million) Forecast, by Application 2019 & 2032
- Table 26: United States Guar Market Volume (Kiloton) Forecast, by Application 2019 & 2032
- Table 27: Canada Guar Market Revenue (Million) Forecast, by Application 2019 & 2032
- Table 28: Canada Guar Market Volume (Kiloton) Forecast, by Application 2019 & 2032
- Table 29: Mexico Guar Market Revenue (Million) Forecast, by Application 2019 & 2032
- Table 30: Mexico Guar Market Volume (Kiloton) Forecast, by Application 2019 & 2032
- Table 31: Global Guar Market Revenue Million Forecast, by Country 2019 & 2032
- Table 32: Global Guar Market Volume Kiloton Forecast, by Country 2019 & 2032
- Table 33: China Guar Market Revenue (Million) Forecast, by Application 2019 & 2032
- Table 34: China Guar Market Volume (Kiloton) Forecast, by Application 2019 & 2032
- Table 35: Japan Guar Market Revenue (Million) Forecast, by Application 2019 & 2032
- Table 36: Japan Guar Market Volume (Kiloton) Forecast, by Application 2019 & 2032
- Table 37: India Guar Market Revenue (Million) Forecast, by Application 2019 & 2032
- Table 38: India Guar Market Volume (Kiloton) Forecast, by Application 2019 & 2032
- Table 39: South Korea Guar Market Revenue (Million) Forecast, by Application 2019 & 2032
- Table 40: South Korea Guar Market Volume (Kiloton) Forecast, by Application 2019 & 2032
- Table 41: Taiwan Guar Market Revenue (Million) Forecast, by Application 2019 & 2032
- Table 42: Taiwan Guar Market Volume (Kiloton) Forecast, by Application 2019 & 2032
- Table 43: Australia Guar Market Revenue (Million) Forecast, by Application 2019 & 2032
- Table 44: Australia Guar Market Volume (Kiloton) Forecast, by Application 2019 & 2032
- Table 45: Rest of Asia-Pacific Guar Market Revenue (Million) Forecast, by Application 2019 & 2032
- Table 46: Rest of Asia-Pacific Guar Market Volume (Kiloton) Forecast, by Application 2019 & 2032
- Table 47: Global Guar Market Revenue Million Forecast, by Country 2019 & 2032
- Table 48: Global Guar Market Volume Kiloton Forecast, by Country 2019 & 2032
- Table 49: Germany Guar Market Revenue (Million) Forecast, by Application 2019 & 2032
- Table 50: Germany Guar Market Volume (Kiloton) Forecast, by Application 2019 & 2032
- Table 51: France Guar Market Revenue (Million) Forecast, by Application 2019 & 2032
- Table 52: France Guar Market Volume (Kiloton) Forecast, by Application 2019 & 2032
- Table 53: Italy Guar Market Revenue (Million) Forecast, by Application 2019 & 2032
- Table 54: Italy Guar Market Volume (Kiloton) Forecast, by Application 2019 & 2032
- Table 55: United Kingdom Guar Market Revenue (Million) Forecast, by Application 2019 & 2032
- Table 56: United Kingdom Guar Market Volume (Kiloton) Forecast, by Application 2019 & 2032
- Table 57: Netherlands Guar Market Revenue (Million) Forecast, by Application 2019 & 2032
- Table 58: Netherlands Guar Market Volume (Kiloton) Forecast, by Application 2019 & 2032
- Table 59: Rest of Europe Guar Market Revenue (Million) Forecast, by Application 2019 & 2032
- Table 60: Rest of Europe Guar Market Volume (Kiloton) Forecast, by Application 2019 & 2032
- Table 61: Global Guar Market Revenue Million Forecast, by Country 2019 & 2032
- Table 62: Global Guar Market Volume Kiloton Forecast, by Country 2019 & 2032
- Table 63: Middle East Guar Market Revenue (Million) Forecast, by Application 2019 & 2032
- Table 64: Middle East Guar Market Volume (Kiloton) Forecast, by Application 2019 & 2032
- Table 65: Africa Guar Market Revenue (Million) Forecast, by Application 2019 & 2032
- Table 66: Africa Guar Market Volume (Kiloton) Forecast, by Application 2019 & 2032
- Table 67: Global Guar Market Revenue Million Forecast, by Production Analysis 2019 & 2032
- Table 68: Global Guar Market Volume Kiloton Forecast, by Production Analysis 2019 & 2032
- Table 69: Global Guar Market Revenue Million Forecast, by Consumption Analysis 2019 & 2032
- Table 70: Global Guar Market Volume Kiloton Forecast, by Consumption Analysis 2019 & 2032
- Table 71: Global Guar Market Revenue Million Forecast, by Import Market Analysis (Value & Volume) 2019 & 2032
- Table 72: Global Guar Market Volume Kiloton Forecast, by Import Market Analysis (Value & Volume) 2019 & 2032
- Table 73: Global Guar Market Revenue Million Forecast, by Export Market Analysis (Value & Volume) 2019 & 2032
- Table 74: Global Guar Market Volume Kiloton Forecast, by Export Market Analysis (Value & Volume) 2019 & 2032
- Table 75: Global Guar Market Revenue Million Forecast, by Price Trend Analysis 2019 & 2032
- Table 76: Global Guar Market Volume Kiloton Forecast, by Price Trend Analysis 2019 & 2032
- Table 77: Global Guar Market Revenue Million Forecast, by Country 2019 & 2032
- Table 78: Global Guar Market Volume Kiloton Forecast, by Country 2019 & 2032
- Table 79: United States Guar Market Revenue (Million) Forecast, by Application 2019 & 2032
- Table 80: United States Guar Market Volume (Kiloton) Forecast, by Application 2019 & 2032
- Table 81: Canada Guar Market Revenue (Million) Forecast, by Application 2019 & 2032
- Table 82: Canada Guar Market Volume (Kiloton) Forecast, by Application 2019 & 2032
- Table 83: Global Guar Market Revenue Million Forecast, by Production Analysis 2019 & 2032
- Table 84: Global Guar Market Volume Kiloton Forecast, by Production Analysis 2019 & 2032
- Table 85: Global Guar Market Revenue Million Forecast, by Consumption Analysis 2019 & 2032
- Table 86: Global Guar Market Volume Kiloton Forecast, by Consumption Analysis 2019 & 2032
- Table 87: Global Guar Market Revenue Million Forecast, by Import Market Analysis (Value & Volume) 2019 & 2032
- Table 88: Global Guar Market Volume Kiloton Forecast, by Import Market Analysis (Value & Volume) 2019 & 2032
- Table 89: Global Guar Market Revenue Million Forecast, by Export Market Analysis (Value & Volume) 2019 & 2032
- Table 90: Global Guar Market Volume Kiloton Forecast, by Export Market Analysis (Value & Volume) 2019 & 2032
- Table 91: Global Guar Market Revenue Million Forecast, by Price Trend Analysis 2019 & 2032
- Table 92: Global Guar Market Volume Kiloton Forecast, by Price Trend Analysis 2019 & 2032
- Table 93: Global Guar Market Revenue Million Forecast, by Country 2019 & 2032
- Table 94: Global Guar Market Volume Kiloton Forecast, by Country 2019 & 2032
- Table 95: Germany Guar Market Revenue (Million) Forecast, by Application 2019 & 2032
- Table 96: Germany Guar Market Volume (Kiloton) Forecast, by Application 2019 & 2032
- Table 97: France Guar Market Revenue (Million) Forecast, by Application 2019 & 2032
- Table 98: France Guar Market Volume (Kiloton) Forecast, by Application 2019 & 2032
- Table 99: Russia Guar Market Revenue (Million) Forecast, by Application 2019 & 2032
- Table 100: Russia Guar Market Volume (Kiloton) Forecast, by Application 2019 & 2032
- Table 101: Spain Guar Market Revenue (Million) Forecast, by Application 2019 & 2032
- Table 102: Spain Guar Market Volume (Kiloton) Forecast, by Application 2019 & 2032
- Table 103: Global Guar Market Revenue Million Forecast, by Production Analysis 2019 & 2032
- Table 104: Global Guar Market Volume Kiloton Forecast, by Production Analysis 2019 & 2032
- Table 105: Global Guar Market Revenue Million Forecast, by Consumption Analysis 2019 & 2032
- Table 106: Global Guar Market Volume Kiloton Forecast, by Consumption Analysis 2019 & 2032
- Table 107: Global Guar Market Revenue Million Forecast, by Import Market Analysis (Value & Volume) 2019 & 2032
- Table 108: Global Guar Market Volume Kiloton Forecast, by Import Market Analysis (Value & Volume) 2019 & 2032
- Table 109: Global Guar Market Revenue Million Forecast, by Export Market Analysis (Value & Volume) 2019 & 2032
- Table 110: Global Guar Market Volume Kiloton Forecast, by Export Market Analysis (Value & Volume) 2019 & 2032
- Table 111: Global Guar Market Revenue Million Forecast, by Price Trend Analysis 2019 & 2032
- Table 112: Global Guar Market Volume Kiloton Forecast, by Price Trend Analysis 2019 & 2032
- Table 113: Global Guar Market Revenue Million Forecast, by Country 2019 & 2032
- Table 114: Global Guar Market Volume Kiloton Forecast, by Country 2019 & 2032
- Table 115: India Guar Market Revenue (Million) Forecast, by Application 2019 & 2032
- Table 116: India Guar Market Volume (Kiloton) Forecast, by Application 2019 & 2032
- Table 117: China Guar Market Revenue (Million) Forecast, by Application 2019 & 2032
- Table 118: China Guar Market Volume (Kiloton) Forecast, by Application 2019 & 2032
- Table 119: Japan Guar Market Revenue (Million) Forecast, by Application 2019 & 2032
- Table 120: Japan Guar Market Volume (Kiloton) Forecast, by Application 2019 & 2032
- Table 121: Australia Guar Market Revenue (Million) Forecast, by Application 2019 & 2032
- Table 122: Australia Guar Market Volume (Kiloton) Forecast, by Application 2019 & 2032
- Table 123: Global Guar Market Revenue Million Forecast, by Production Analysis 2019 & 2032
- Table 124: Global Guar Market Volume Kiloton Forecast, by Production Analysis 2019 & 2032
- Table 125: Global Guar Market Revenue Million Forecast, by Consumption Analysis 2019 & 2032
- Table 126: Global Guar Market Volume Kiloton Forecast, by Consumption Analysis 2019 & 2032
- Table 127: Global Guar Market Revenue Million Forecast, by Import Market Analysis (Value & Volume) 2019 & 2032
- Table 128: Global Guar Market Volume Kiloton Forecast, by Import Market Analysis (Value & Volume) 2019 & 2032
- Table 129: Global Guar Market Revenue Million Forecast, by Export Market Analysis (Value & Volume) 2019 & 2032
- Table 130: Global Guar Market Volume Kiloton Forecast, by Export Market Analysis (Value & Volume) 2019 & 2032
- Table 131: Global Guar Market Revenue Million Forecast, by Price Trend Analysis 2019 & 2032
- Table 132: Global Guar Market Volume Kiloton Forecast, by Price Trend Analysis 2019 & 2032
- Table 133: Global Guar Market Revenue Million Forecast, by Country 2019 & 2032
- Table 134: Global Guar Market Volume Kiloton Forecast, by Country 2019 & 2032
- Table 135: Brazil Guar Market Revenue (Million) Forecast, by Application 2019 & 2032
- Table 136: Brazil Guar Market Volume (Kiloton) Forecast, by Application 2019 & 2032
- Table 137: Argentina Guar Market Revenue (Million) Forecast, by Application 2019 & 2032
- Table 138: Argentina Guar Market Volume (Kiloton) Forecast, by Application 2019 & 2032
- Table 139: Global Guar Market Revenue Million Forecast, by Production Analysis 2019 & 2032
- Table 140: Global Guar Market Volume Kiloton Forecast, by Production Analysis 2019 & 2032
- Table 141: Global Guar Market Revenue Million Forecast, by Consumption Analysis 2019 & 2032
- Table 142: Global Guar Market Volume Kiloton Forecast, by Consumption Analysis 2019 & 2032
- Table 143: Global Guar Market Revenue Million Forecast, by Import Market Analysis (Value & Volume) 2019 & 2032
- Table 144: Global Guar Market Volume Kiloton Forecast, by Import Market Analysis (Value & Volume) 2019 & 2032
- Table 145: Global Guar Market Revenue Million Forecast, by Export Market Analysis (Value & Volume) 2019 & 2032
- Table 146: Global Guar Market Volume Kiloton Forecast, by Export Market Analysis (Value & Volume) 2019 & 2032
- Table 147: Global Guar Market Revenue Million Forecast, by Price Trend Analysis 2019 & 2032
- Table 148: Global Guar Market Volume Kiloton Forecast, by Price Trend Analysis 2019 & 2032
- Table 149: Global Guar Market Revenue Million Forecast, by Country 2019 & 2032
- Table 150: Global Guar Market Volume Kiloton Forecast, by Country 2019 & 2032
- Table 151: Malawi Guar Market Revenue (Million) Forecast, by Application 2019 & 2032
- Table 152: Malawi Guar Market Volume (Kiloton) Forecast, by Application 2019 & 2032
- Table 153: Sudan Guar Market Revenue (Million) Forecast, by Application 2019 & 2032
- Table 154: Sudan Guar Market Volume (Kiloton) Forecast, by Application 2019 & 2032
Frequently Asked Questions
1. What is the projected Compound Annual Growth Rate (CAGR) of the Guar Market?
The projected CAGR is approximately 2.60%.
2. Which companies are prominent players in the Guar Market?
Key companies in the market include Noble Commodities, SunGum Global , Galaxy Gum , JK Agri Genetics , Guar Gum International .
3. What are the main segments of the Guar Market?
The market segments include Production Analysis, Consumption Analysis, Import Market Analysis (Value & Volume), Export Market Analysis (Value & Volume), Price Trend Analysis.
4. Can you provide details about the market size?
The market size is estimated to be USD 1.31 Million as of 2022.
5. What are some drivers contributing to market growth?
Rising Consumption of Cashew Nuts in the Country; Favorable Government Initiatives.
6. What are the notable trends driving market growth?
High Demand by End-users.
7. Are there any restraints impacting market growth?
Hazardous Climatic Condition Hinders Cashew Production; Stringent Regulations Related to Food Quality Standards.
8. Can you provide examples of recent developments in the market?
May 2022: The Directorate General of Foreign Trade (DGFT), on May 9, 2022, issued an amendment to the notification dated September 29, 2017, for the export of guar gum to the European Union and the United Kingdom. The export originating from India should get an official certificate and the original analytical report of testing of pentachlorophenol (PCP) and ethylene oxide (ETO) from Vimta Labs, Hyderabad. In addition to Vimta Labs, Hyderabad, Export Inspection Agency (EIA) Chennai has also been authorized to issue the analytical report of testing of PCP.
9. What pricing options are available for accessing the report?
Pricing options include single-user, multi-user, and enterprise licenses priced at USD 4750, USD 5250, and USD 8750 respectively.
10. Is the market size provided in terms of value or volume?
The market size is provided in terms of value, measured in Million and volume, measured in Kiloton.
11. Are there any specific market keywords associated with the report?
Yes, the market keyword associated with the report is "Guar Market," which aids in identifying and referencing the specific market segment covered.
12. How do I determine which pricing option suits my needs best?
The pricing options vary based on user requirements and access needs. Individual users may opt for single-user licenses, while businesses requiring broader access may choose multi-user or enterprise licenses for cost-effective access to the report.
13. Are there any additional resources or data provided in the Guar Market report?
While the report offers comprehensive insights, it's advisable to review the specific contents or supplementary materials provided to ascertain if additional resources or data are available.
14. How can I stay updated on further developments or reports in the Guar Market?
To stay informed about further developments, trends, and reports in the Guar Market, consider subscribing to industry newsletters, following relevant companies and organizations, or regularly checking reputable industry news sources and publications.
Methodology
Step 1 - Identification of Relevant Samples Size from Population Database


Step 2 - Approaches for Defining Global Market Size (Value, Volume* & Price*)

Note*: In applicable scenarios
Step 3 - Data Sources
Primary Research
- Web Analytics
- Survey Reports
- Research Institute
- Latest Research Reports
- Opinion Leaders
Secondary Research
- Annual Reports
- White Paper
- Latest Press Release
- Industry Association
- Paid Database
- Investor Presentations

Step 4 - Data Triangulation
Involves using different sources of information in order to increase the validity of a study
These sources are likely to be stakeholders in a program - participants, other researchers, program staff, other community members, and so on.
Then we put all data in single framework & apply various statistical tools to find out the dynamic on the market.
During the analysis stage, feedback from the stakeholder groups would be compared to determine areas of agreement as well as areas of divergence
