

Key Insights
The Green IT Services market is experiencing robust growth, projected to reach a substantial size. Driven by increasing environmental concerns, stringent government regulations, and the rising adoption of sustainable business practices across various sectors, this market is poised for significant expansion. The market's Compound Annual Growth Rate (CAGR) of 15.21% from 2019 to 2024 indicates a strong upward trajectory. Key drivers include the growing need for energy-efficient data centers, the increasing demand for carbon footprint reduction strategies, and the expanding adoption of cloud computing with a focus on sustainability. Significant growth is observed in segments like software solutions for energy management and carbon tracking, and services encompassing sustainability consulting, audits, and implementation support. The BFSI (Banking, Financial Services, and Insurance), IT and Telecom, and Government sectors are major adopters, owing to their large carbon footprint and regulatory pressures. While the market faces restraints such as high initial investment costs for implementing green IT solutions and a lack of awareness among certain industries, the long-term benefits, including cost savings and enhanced brand reputation, are outweighing these challenges. North America and Europe currently hold significant market shares, but the Asia-Pacific region is expected to witness rapid growth due to increasing industrialization and government initiatives promoting sustainable technologies. Companies like Accenture, IBM, and Schneider Electric are leading the market through innovative solutions and strategic partnerships, fostering further market development and competition.
The forecast period (2025-2033) anticipates continued expansion, fueled by technological advancements in areas like AI-powered energy optimization and renewable energy integration in IT infrastructure. The market segmentation by type (software and services) and end-user vertical provides valuable insights for targeted strategies. Software solutions are increasingly sophisticated, offering predictive analytics and automated reporting on environmental impact, improving efficiency. Service providers are adapting to offer holistic solutions integrating consultancy, implementation, and ongoing support, ensuring sustained client engagement. The competitive landscape is dynamic, with both established IT giants and specialized green IT firms vying for market share. This competitive environment drives innovation and ensures the availability of diverse and adaptable solutions catering to the specific needs of various industries. Future growth will likely hinge on further technological developments, increased regulatory scrutiny, and heightened corporate social responsibility initiatives globally.
Green IT Services Market: A Comprehensive Report (2019-2033)
This insightful report provides a detailed analysis of the Green IT Services Market, offering a comprehensive overview of its current state, future trajectory, and key players. With a study period spanning 2019-2033, a base year of 2025, and a forecast period of 2025-2033, this report is an essential resource for stakeholders seeking to understand and capitalize on opportunities within this rapidly evolving market, projected to reach xx Million by 2033.
Green IT Services Market Composition & Trends
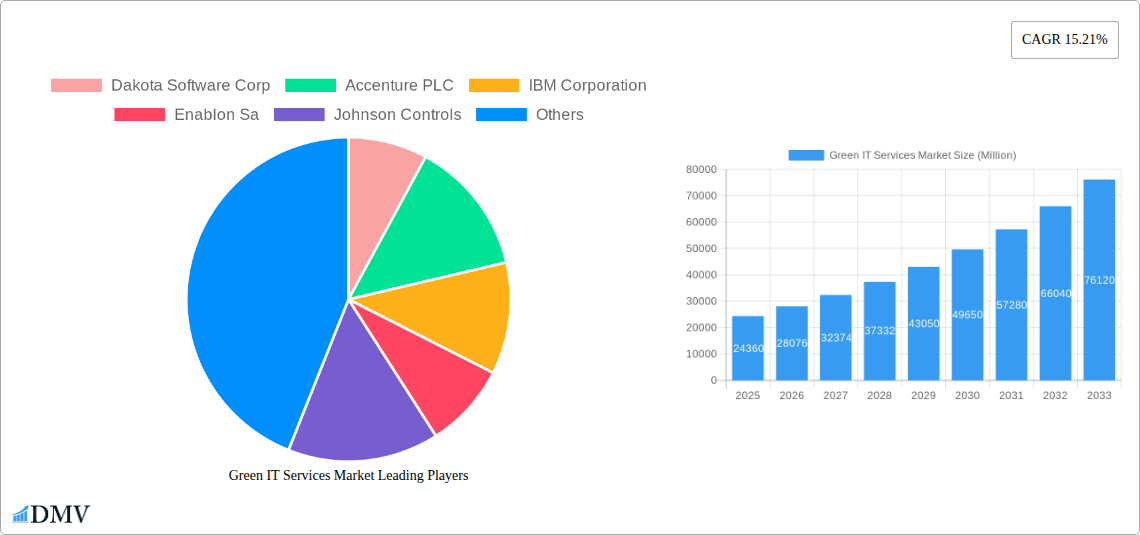
This section delves into the competitive landscape of the Green IT Services Market, examining market concentration, innovation drivers, regulatory frameworks, substitute products, end-user profiles, and mergers & acquisitions (M&A) activities. The analysis reveals a dynamic market with a considerable number of players, characterized by varying levels of market share. While precise market share distribution for each company requires in-depth proprietary data, we can suggest the market is moderately concentrated with some major players and a significant number of smaller players contributing to the overall market size. We estimate that the top 5 players account for approximately 40% of the market share. The report further illustrates how M&A activity is shaping the market's structure, with significant deals exceeding xx Million driving consolidation and innovation.
- Market Concentration: Moderately concentrated, with top 5 players holding ~40% market share (estimated).
- Innovation Catalysts: Stringent environmental regulations, rising energy costs, and growing corporate sustainability initiatives.
- Regulatory Landscape: Varying regional regulations driving adoption of green IT solutions.
- Substitute Products: Limited direct substitutes, but traditional IT services represent indirect competition.
- End-User Profiles: Government, BFSI, IT & Telecom, Industrial, Healthcare, and Other sectors exhibiting varying adoption rates.
- M&A Activity: Significant deals valued at xx Million observed, leading to market consolidation.
Green IT Services Market Industry Evolution
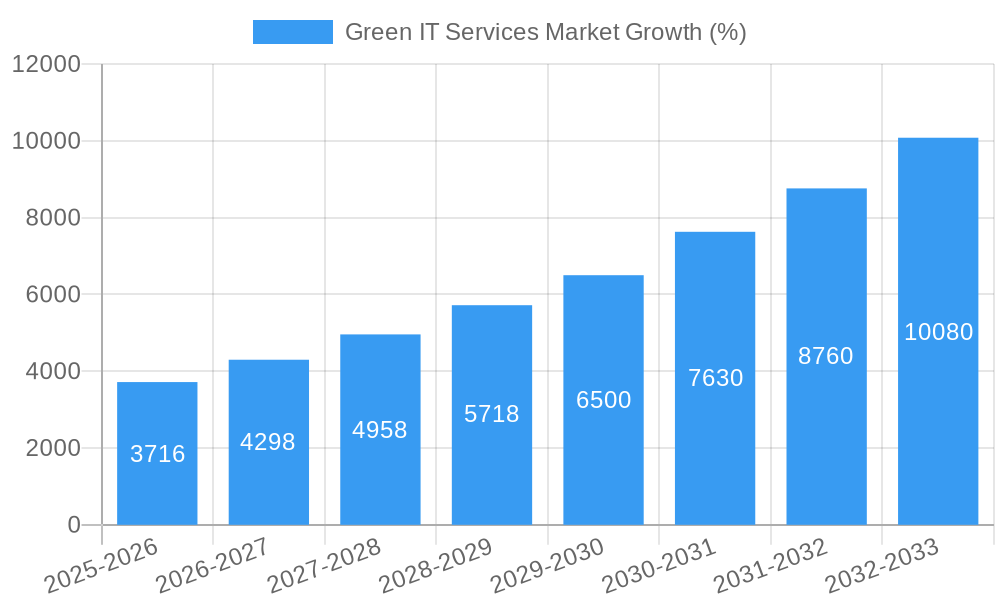
This section analyzes the historical and projected growth trajectories of the Green IT Services Market (2019-2033). The market has witnessed substantial growth driven by technological advancements in areas like cloud computing, data center optimization, and AI-powered energy management. This growth is further fueled by increasing awareness of environmental concerns and the escalating demand for sustainable business practices across various industries. We project a Compound Annual Growth Rate (CAGR) of xx% during the forecast period (2025-2033), significantly influenced by the rising adoption of Software as a Service (SaaS) solutions, enhanced energy efficiency in data centers, and government initiatives promoting green technology. The report includes detailed analysis of past performance and future predictions, supported by verifiable data points and comprehensive market sizing.
Leading Regions, Countries, or Segments in Green IT Services Market
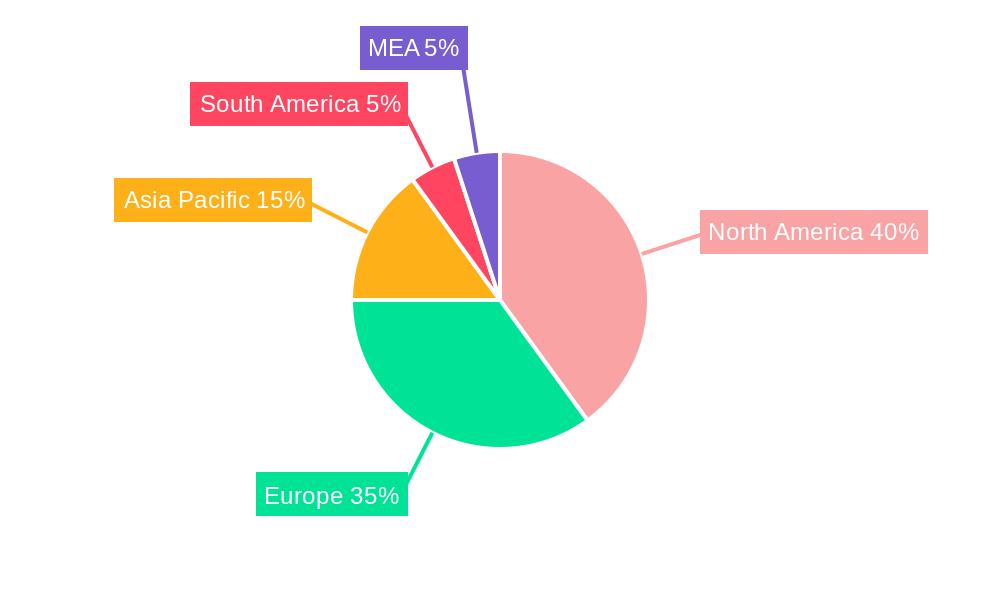
North America currently holds the leading position in the Green IT Services market, driven by substantial investments in green technologies, stringent environmental regulations, and a high concentration of major technology companies. Europe follows closely, with strong government support for sustainable initiatives and a growing awareness among businesses.
- Key Drivers (North America): High level of technology adoption, strong regulatory framework, substantial venture capital investment.
- Key Drivers (Europe): Supportive government policies, high awareness of environmental sustainability, strong focus on reducing carbon footprint.
- Segment Analysis: The Software segment currently dominates the market, due to its scalability and cost-effectiveness, followed by the Services segment offering implementation and consulting services. Within end-user verticals, the Government and BFSI sectors are leading adopters, due to their stringent regulatory environments and high-volume data processing needs.
The report further details the factors influencing the dominance of specific regions and segments, including economic indicators, regulatory landscape, and technology adoption rates.
Green IT Services Market Product Innovations
Recent years have witnessed significant advancements in green IT services, leading to the introduction of innovative solutions. These include AI-powered energy management systems for optimizing data center efficiency, cloud-based platforms promoting resource sharing and reducing carbon footprints, and software solutions enabling carbon accounting and emissions reduction tracking. These innovations boast enhanced performance metrics, improved energy efficiency, and reduced operational costs, driving their adoption across various sectors. Unique selling propositions frequently emphasize cost savings, regulatory compliance, and improved sustainability reporting capabilities.
Propelling Factors for Green IT Services Market Growth
The Green IT Services market is experiencing robust growth driven by a confluence of factors. Technological advancements, such as the development of more energy-efficient hardware and software, are a significant driver. Furthermore, stringent environmental regulations and increasing corporate social responsibility (CSR) initiatives are pushing businesses to adopt greener IT practices. The economic benefits of reduced energy consumption and improved operational efficiency also contribute significantly to market expansion.
Obstacles in the Green IT Services Market
Despite its potential, the Green IT Services market faces challenges. High initial investment costs associated with implementing green technologies can be a barrier to entry for smaller businesses. Regulatory inconsistencies across different regions create complexity for companies seeking global expansion. Supply chain disruptions and competition from established IT service providers also present ongoing hurdles.
Future Opportunities in Green IT Services Market
Emerging opportunities exist in the Green IT Services market, particularly in untapped markets such as developing economies with rapidly growing IT sectors. Advancements in technologies like blockchain for carbon credit verification and IoT-based energy management present significant potential. Growing consumer demand for sustainable products and services creates further opportunities for innovative companies.
Major Players in the Green IT Services Market Ecosystem
- Dakota Software Corp
- Accenture PLC
- IBM Corporation
- Enablon Sa
- Johnson Controls
- Schneider Electric SE
- Accuvio Sustainability Software
- Enviance Inc
- SAP SE *List Not Exhaustive
Key Developments in Green IT Services Market Industry
- February 2022: Super Micro Computer, Inc. (SMCI) unveiled a new short-depth multi-node system optimized for 5G, IoT, and Edge applications, enhancing high-density computing in small form factors.
- April 2022: Huawei proposed the "Green and Low Carbon" concept for its Huawei CloudFabric 3.0, emphasizing lossless networks for improved computing efficiency.
Strategic Green IT Services Market Forecast
The Green IT Services market is poised for continued growth, driven by escalating demand for sustainable solutions, technological advancements, and supportive government policies. The market's future potential is substantial, with opportunities across various sectors and geographies. Continued innovation in energy-efficient technologies and the expansion of green IT adoption will significantly contribute to this growth trajectory.
Green IT Services Market Segmentation
-
1. Type
- 1.1. Software
- 1.2. Services
-
2. End-user Vertical
- 2.1. Government
- 2.2. BFSI
- 2.3. IT and Telecom
- 2.4. Industrial
- 2.5. Healthcare
- 2.6. Other End-user Verticals
Green IT Services Market Segmentation By Geography
- 1. North America
- 2. Europe
- 3. Asia Pacific
- 4. Latin America
- 5. Middle East
Green IT Services Market REPORT HIGHLIGHTS
| Aspects | Details |
|---|---|
| Study Period | 2019-2033 |
| Base Year | 2024 |
| Estimated Year | 2025 |
| Forecast Period | 2025-2033 |
| Historical Period | 2019-2024 |
| Growth Rate | CAGR of 15.21% from 2019-2033 |
| Segmentation |
|
Table of Contents
- 1. Introduction
- 1.1. Research Scope
- 1.2. Market Segmentation
- 1.3. Research Methodology
- 1.4. Definitions and Assumptions
- 2. Executive Summary
- 2.1. Introduction
- 3. Market Dynamics
- 3.1. Introduction
- 3.2. Market Drivers
- 3.2.1. Increasing Environmental Concerns and Growing Focus on Reducing Carbon Footprints; Strengthening Government Regulations
- 3.3. Market Restrains
- 3.3.1. Managing Variable Energy and Resource Demands
- 3.4. Market Trends
- 3.4.1. Application in IT and Telecom to Drive the Green IT Service Market
- 4. Market Factor Analysis
- 4.1. Porters Five Forces
- 4.2. Supply/Value Chain
- 4.3. PESTEL analysis
- 4.4. Market Entropy
- 4.5. Patent/Trademark Analysis
- 5. Global Green IT Services Market Analysis, Insights and Forecast, 2019-2031
- 5.1. Market Analysis, Insights and Forecast - by Type
- 5.1.1. Software
- 5.1.2. Services
- 5.2. Market Analysis, Insights and Forecast - by End-user Vertical
- 5.2.1. Government
- 5.2.2. BFSI
- 5.2.3. IT and Telecom
- 5.2.4. Industrial
- 5.2.5. Healthcare
- 5.2.6. Other End-user Verticals
- 5.3. Market Analysis, Insights and Forecast - by Region
- 5.3.1. North America
- 5.3.2. Europe
- 5.3.3. Asia Pacific
- 5.3.4. Latin America
- 5.3.5. Middle East
- 5.1. Market Analysis, Insights and Forecast - by Type
- 6. North America Green IT Services Market Analysis, Insights and Forecast, 2019-2031
- 6.1. Market Analysis, Insights and Forecast - by Type
- 6.1.1. Software
- 6.1.2. Services
- 6.2. Market Analysis, Insights and Forecast - by End-user Vertical
- 6.2.1. Government
- 6.2.2. BFSI
- 6.2.3. IT and Telecom
- 6.2.4. Industrial
- 6.2.5. Healthcare
- 6.2.6. Other End-user Verticals
- 6.1. Market Analysis, Insights and Forecast - by Type
- 7. Europe Green IT Services Market Analysis, Insights and Forecast, 2019-2031
- 7.1. Market Analysis, Insights and Forecast - by Type
- 7.1.1. Software
- 7.1.2. Services
- 7.2. Market Analysis, Insights and Forecast - by End-user Vertical
- 7.2.1. Government
- 7.2.2. BFSI
- 7.2.3. IT and Telecom
- 7.2.4. Industrial
- 7.2.5. Healthcare
- 7.2.6. Other End-user Verticals
- 7.1. Market Analysis, Insights and Forecast - by Type
- 8. Asia Pacific Green IT Services Market Analysis, Insights and Forecast, 2019-2031
- 8.1. Market Analysis, Insights and Forecast - by Type
- 8.1.1. Software
- 8.1.2. Services
- 8.2. Market Analysis, Insights and Forecast - by End-user Vertical
- 8.2.1. Government
- 8.2.2. BFSI
- 8.2.3. IT and Telecom
- 8.2.4. Industrial
- 8.2.5. Healthcare
- 8.2.6. Other End-user Verticals
- 8.1. Market Analysis, Insights and Forecast - by Type
- 9. Latin America Green IT Services Market Analysis, Insights and Forecast, 2019-2031
- 9.1. Market Analysis, Insights and Forecast - by Type
- 9.1.1. Software
- 9.1.2. Services
- 9.2. Market Analysis, Insights and Forecast - by End-user Vertical
- 9.2.1. Government
- 9.2.2. BFSI
- 9.2.3. IT and Telecom
- 9.2.4. Industrial
- 9.2.5. Healthcare
- 9.2.6. Other End-user Verticals
- 9.1. Market Analysis, Insights and Forecast - by Type
- 10. Middle East Green IT Services Market Analysis, Insights and Forecast, 2019-2031
- 10.1. Market Analysis, Insights and Forecast - by Type
- 10.1.1. Software
- 10.1.2. Services
- 10.2. Market Analysis, Insights and Forecast - by End-user Vertical
- 10.2.1. Government
- 10.2.2. BFSI
- 10.2.3. IT and Telecom
- 10.2.4. Industrial
- 10.2.5. Healthcare
- 10.2.6. Other End-user Verticals
- 10.1. Market Analysis, Insights and Forecast - by Type
- 11. North America Green IT Services Market Analysis, Insights and Forecast, 2019-2031
- 11.1. Market Analysis, Insights and Forecast - By Country/Sub-region
- 11.1.1 United States
- 11.1.2 Canada
- 11.1.3 Mexico
- 12. Europe Green IT Services Market Analysis, Insights and Forecast, 2019-2031
- 12.1. Market Analysis, Insights and Forecast - By Country/Sub-region
- 12.1.1 Germany
- 12.1.2 United Kingdom
- 12.1.3 France
- 12.1.4 Spain
- 12.1.5 Italy
- 12.1.6 Spain
- 12.1.7 Belgium
- 12.1.8 Netherland
- 12.1.9 Nordics
- 12.1.10 Rest of Europe
- 13. Asia Pacific Green IT Services Market Analysis, Insights and Forecast, 2019-2031
- 13.1. Market Analysis, Insights and Forecast - By Country/Sub-region
- 13.1.1 China
- 13.1.2 Japan
- 13.1.3 India
- 13.1.4 South Korea
- 13.1.5 Southeast Asia
- 13.1.6 Australia
- 13.1.7 Indonesia
- 13.1.8 Phillipes
- 13.1.9 Singapore
- 13.1.10 Thailandc
- 13.1.11 Rest of Asia Pacific
- 14. South America Green IT Services Market Analysis, Insights and Forecast, 2019-2031
- 14.1. Market Analysis, Insights and Forecast - By Country/Sub-region
- 14.1.1 Brazil
- 14.1.2 Argentina
- 14.1.3 Peru
- 14.1.4 Chile
- 14.1.5 Colombia
- 14.1.6 Ecuador
- 14.1.7 Venezuela
- 14.1.8 Rest of South America
- 15. North America Green IT Services Market Analysis, Insights and Forecast, 2019-2031
- 15.1. Market Analysis, Insights and Forecast - By Country/Sub-region
- 15.1.1 United States
- 15.1.2 Canada
- 15.1.3 Mexico
- 16. MEA Green IT Services Market Analysis, Insights and Forecast, 2019-2031
- 16.1. Market Analysis, Insights and Forecast - By Country/Sub-region
- 16.1.1 United Arab Emirates
- 16.1.2 Saudi Arabia
- 16.1.3 South Africa
- 16.1.4 Rest of Middle East and Africa
- 17. Competitive Analysis
- 17.1. Global Market Share Analysis 2024
- 17.2. Company Profiles
- 17.2.1 Dakota Software Corp
- 17.2.1.1. Overview
- 17.2.1.2. Products
- 17.2.1.3. SWOT Analysis
- 17.2.1.4. Recent Developments
- 17.2.1.5. Financials (Based on Availability)
- 17.2.2 Accenture PLC
- 17.2.2.1. Overview
- 17.2.2.2. Products
- 17.2.2.3. SWOT Analysis
- 17.2.2.4. Recent Developments
- 17.2.2.5. Financials (Based on Availability)
- 17.2.3 IBM Corporation
- 17.2.3.1. Overview
- 17.2.3.2. Products
- 17.2.3.3. SWOT Analysis
- 17.2.3.4. Recent Developments
- 17.2.3.5. Financials (Based on Availability)
- 17.2.4 Enablon Sa
- 17.2.4.1. Overview
- 17.2.4.2. Products
- 17.2.4.3. SWOT Analysis
- 17.2.4.4. Recent Developments
- 17.2.4.5. Financials (Based on Availability)
- 17.2.5 Johnson Controls
- 17.2.5.1. Overview
- 17.2.5.2. Products
- 17.2.5.3. SWOT Analysis
- 17.2.5.4. Recent Developments
- 17.2.5.5. Financials (Based on Availability)
- 17.2.6 Schneider Electric SE
- 17.2.6.1. Overview
- 17.2.6.2. Products
- 17.2.6.3. SWOT Analysis
- 17.2.6.4. Recent Developments
- 17.2.6.5. Financials (Based on Availability)
- 17.2.7 Accuvio Sustainability Software
- 17.2.7.1. Overview
- 17.2.7.2. Products
- 17.2.7.3. SWOT Analysis
- 17.2.7.4. Recent Developments
- 17.2.7.5. Financials (Based on Availability)
- 17.2.8 Enviance Inc *List Not Exhaustive
- 17.2.8.1. Overview
- 17.2.8.2. Products
- 17.2.8.3. SWOT Analysis
- 17.2.8.4. Recent Developments
- 17.2.8.5. Financials (Based on Availability)
- 17.2.9 SAP SE
- 17.2.9.1. Overview
- 17.2.9.2. Products
- 17.2.9.3. SWOT Analysis
- 17.2.9.4. Recent Developments
- 17.2.9.5. Financials (Based on Availability)
- 17.2.1 Dakota Software Corp
List of Figures
- Figure 1: Global Green IT Services Market Revenue Breakdown (Million, %) by Region 2024 & 2032
- Figure 2: North America Green IT Services Market Revenue (Million), by Country 2024 & 2032
- Figure 3: North America Green IT Services Market Revenue Share (%), by Country 2024 & 2032
- Figure 4: Europe Green IT Services Market Revenue (Million), by Country 2024 & 2032
- Figure 5: Europe Green IT Services Market Revenue Share (%), by Country 2024 & 2032
- Figure 6: Asia Pacific Green IT Services Market Revenue (Million), by Country 2024 & 2032
- Figure 7: Asia Pacific Green IT Services Market Revenue Share (%), by Country 2024 & 2032
- Figure 8: South America Green IT Services Market Revenue (Million), by Country 2024 & 2032
- Figure 9: South America Green IT Services Market Revenue Share (%), by Country 2024 & 2032
- Figure 10: North America Green IT Services Market Revenue (Million), by Country 2024 & 2032
- Figure 11: North America Green IT Services Market Revenue Share (%), by Country 2024 & 2032
- Figure 12: MEA Green IT Services Market Revenue (Million), by Country 2024 & 2032
- Figure 13: MEA Green IT Services Market Revenue Share (%), by Country 2024 & 2032
- Figure 14: North America Green IT Services Market Revenue (Million), by Type 2024 & 2032
- Figure 15: North America Green IT Services Market Revenue Share (%), by Type 2024 & 2032
- Figure 16: North America Green IT Services Market Revenue (Million), by End-user Vertical 2024 & 2032
- Figure 17: North America Green IT Services Market Revenue Share (%), by End-user Vertical 2024 & 2032
- Figure 18: North America Green IT Services Market Revenue (Million), by Country 2024 & 2032
- Figure 19: North America Green IT Services Market Revenue Share (%), by Country 2024 & 2032
- Figure 20: Europe Green IT Services Market Revenue (Million), by Type 2024 & 2032
- Figure 21: Europe Green IT Services Market Revenue Share (%), by Type 2024 & 2032
- Figure 22: Europe Green IT Services Market Revenue (Million), by End-user Vertical 2024 & 2032
- Figure 23: Europe Green IT Services Market Revenue Share (%), by End-user Vertical 2024 & 2032
- Figure 24: Europe Green IT Services Market Revenue (Million), by Country 2024 & 2032
- Figure 25: Europe Green IT Services Market Revenue Share (%), by Country 2024 & 2032
- Figure 26: Asia Pacific Green IT Services Market Revenue (Million), by Type 2024 & 2032
- Figure 27: Asia Pacific Green IT Services Market Revenue Share (%), by Type 2024 & 2032
- Figure 28: Asia Pacific Green IT Services Market Revenue (Million), by End-user Vertical 2024 & 2032
- Figure 29: Asia Pacific Green IT Services Market Revenue Share (%), by End-user Vertical 2024 & 2032
- Figure 30: Asia Pacific Green IT Services Market Revenue (Million), by Country 2024 & 2032
- Figure 31: Asia Pacific Green IT Services Market Revenue Share (%), by Country 2024 & 2032
- Figure 32: Latin America Green IT Services Market Revenue (Million), by Type 2024 & 2032
- Figure 33: Latin America Green IT Services Market Revenue Share (%), by Type 2024 & 2032
- Figure 34: Latin America Green IT Services Market Revenue (Million), by End-user Vertical 2024 & 2032
- Figure 35: Latin America Green IT Services Market Revenue Share (%), by End-user Vertical 2024 & 2032
- Figure 36: Latin America Green IT Services Market Revenue (Million), by Country 2024 & 2032
- Figure 37: Latin America Green IT Services Market Revenue Share (%), by Country 2024 & 2032
- Figure 38: Middle East Green IT Services Market Revenue (Million), by Type 2024 & 2032
- Figure 39: Middle East Green IT Services Market Revenue Share (%), by Type 2024 & 2032
- Figure 40: Middle East Green IT Services Market Revenue (Million), by End-user Vertical 2024 & 2032
- Figure 41: Middle East Green IT Services Market Revenue Share (%), by End-user Vertical 2024 & 2032
- Figure 42: Middle East Green IT Services Market Revenue (Million), by Country 2024 & 2032
- Figure 43: Middle East Green IT Services Market Revenue Share (%), by Country 2024 & 2032
List of Tables
- Table 1: Global Green IT Services Market Revenue Million Forecast, by Region 2019 & 2032
- Table 2: Global Green IT Services Market Revenue Million Forecast, by Type 2019 & 2032
- Table 3: Global Green IT Services Market Revenue Million Forecast, by End-user Vertical 2019 & 2032
- Table 4: Global Green IT Services Market Revenue Million Forecast, by Region 2019 & 2032
- Table 5: Global Green IT Services Market Revenue Million Forecast, by Country 2019 & 2032
- Table 6: United States Green IT Services Market Revenue (Million) Forecast, by Application 2019 & 2032
- Table 7: Canada Green IT Services Market Revenue (Million) Forecast, by Application 2019 & 2032
- Table 8: Mexico Green IT Services Market Revenue (Million) Forecast, by Application 2019 & 2032
- Table 9: Global Green IT Services Market Revenue Million Forecast, by Country 2019 & 2032
- Table 10: Germany Green IT Services Market Revenue (Million) Forecast, by Application 2019 & 2032
- Table 11: United Kingdom Green IT Services Market Revenue (Million) Forecast, by Application 2019 & 2032
- Table 12: France Green IT Services Market Revenue (Million) Forecast, by Application 2019 & 2032
- Table 13: Spain Green IT Services Market Revenue (Million) Forecast, by Application 2019 & 2032
- Table 14: Italy Green IT Services Market Revenue (Million) Forecast, by Application 2019 & 2032
- Table 15: Spain Green IT Services Market Revenue (Million) Forecast, by Application 2019 & 2032
- Table 16: Belgium Green IT Services Market Revenue (Million) Forecast, by Application 2019 & 2032
- Table 17: Netherland Green IT Services Market Revenue (Million) Forecast, by Application 2019 & 2032
- Table 18: Nordics Green IT Services Market Revenue (Million) Forecast, by Application 2019 & 2032
- Table 19: Rest of Europe Green IT Services Market Revenue (Million) Forecast, by Application 2019 & 2032
- Table 20: Global Green IT Services Market Revenue Million Forecast, by Country 2019 & 2032
- Table 21: China Green IT Services Market Revenue (Million) Forecast, by Application 2019 & 2032
- Table 22: Japan Green IT Services Market Revenue (Million) Forecast, by Application 2019 & 2032
- Table 23: India Green IT Services Market Revenue (Million) Forecast, by Application 2019 & 2032
- Table 24: South Korea Green IT Services Market Revenue (Million) Forecast, by Application 2019 & 2032
- Table 25: Southeast Asia Green IT Services Market Revenue (Million) Forecast, by Application 2019 & 2032
- Table 26: Australia Green IT Services Market Revenue (Million) Forecast, by Application 2019 & 2032
- Table 27: Indonesia Green IT Services Market Revenue (Million) Forecast, by Application 2019 & 2032
- Table 28: Phillipes Green IT Services Market Revenue (Million) Forecast, by Application 2019 & 2032
- Table 29: Singapore Green IT Services Market Revenue (Million) Forecast, by Application 2019 & 2032
- Table 30: Thailandc Green IT Services Market Revenue (Million) Forecast, by Application 2019 & 2032
- Table 31: Rest of Asia Pacific Green IT Services Market Revenue (Million) Forecast, by Application 2019 & 2032
- Table 32: Global Green IT Services Market Revenue Million Forecast, by Country 2019 & 2032
- Table 33: Brazil Green IT Services Market Revenue (Million) Forecast, by Application 2019 & 2032
- Table 34: Argentina Green IT Services Market Revenue (Million) Forecast, by Application 2019 & 2032
- Table 35: Peru Green IT Services Market Revenue (Million) Forecast, by Application 2019 & 2032
- Table 36: Chile Green IT Services Market Revenue (Million) Forecast, by Application 2019 & 2032
- Table 37: Colombia Green IT Services Market Revenue (Million) Forecast, by Application 2019 & 2032
- Table 38: Ecuador Green IT Services Market Revenue (Million) Forecast, by Application 2019 & 2032
- Table 39: Venezuela Green IT Services Market Revenue (Million) Forecast, by Application 2019 & 2032
- Table 40: Rest of South America Green IT Services Market Revenue (Million) Forecast, by Application 2019 & 2032
- Table 41: Global Green IT Services Market Revenue Million Forecast, by Country 2019 & 2032
- Table 42: United States Green IT Services Market Revenue (Million) Forecast, by Application 2019 & 2032
- Table 43: Canada Green IT Services Market Revenue (Million) Forecast, by Application 2019 & 2032
- Table 44: Mexico Green IT Services Market Revenue (Million) Forecast, by Application 2019 & 2032
- Table 45: Global Green IT Services Market Revenue Million Forecast, by Country 2019 & 2032
- Table 46: United Arab Emirates Green IT Services Market Revenue (Million) Forecast, by Application 2019 & 2032
- Table 47: Saudi Arabia Green IT Services Market Revenue (Million) Forecast, by Application 2019 & 2032
- Table 48: South Africa Green IT Services Market Revenue (Million) Forecast, by Application 2019 & 2032
- Table 49: Rest of Middle East and Africa Green IT Services Market Revenue (Million) Forecast, by Application 2019 & 2032
- Table 50: Global Green IT Services Market Revenue Million Forecast, by Type 2019 & 2032
- Table 51: Global Green IT Services Market Revenue Million Forecast, by End-user Vertical 2019 & 2032
- Table 52: Global Green IT Services Market Revenue Million Forecast, by Country 2019 & 2032
- Table 53: Global Green IT Services Market Revenue Million Forecast, by Type 2019 & 2032
- Table 54: Global Green IT Services Market Revenue Million Forecast, by End-user Vertical 2019 & 2032
- Table 55: Global Green IT Services Market Revenue Million Forecast, by Country 2019 & 2032
- Table 56: Global Green IT Services Market Revenue Million Forecast, by Type 2019 & 2032
- Table 57: Global Green IT Services Market Revenue Million Forecast, by End-user Vertical 2019 & 2032
- Table 58: Global Green IT Services Market Revenue Million Forecast, by Country 2019 & 2032
- Table 59: Global Green IT Services Market Revenue Million Forecast, by Type 2019 & 2032
- Table 60: Global Green IT Services Market Revenue Million Forecast, by End-user Vertical 2019 & 2032
- Table 61: Global Green IT Services Market Revenue Million Forecast, by Country 2019 & 2032
- Table 62: Global Green IT Services Market Revenue Million Forecast, by Type 2019 & 2032
- Table 63: Global Green IT Services Market Revenue Million Forecast, by End-user Vertical 2019 & 2032
- Table 64: Global Green IT Services Market Revenue Million Forecast, by Country 2019 & 2032
Frequently Asked Questions
1. What is the projected Compound Annual Growth Rate (CAGR) of the Green IT Services Market?
The projected CAGR is approximately 15.21%.
2. Which companies are prominent players in the Green IT Services Market?
Key companies in the market include Dakota Software Corp, Accenture PLC, IBM Corporation, Enablon Sa, Johnson Controls, Schneider Electric SE, Accuvio Sustainability Software, Enviance Inc *List Not Exhaustive, SAP SE.
3. What are the main segments of the Green IT Services Market?
The market segments include Type, End-user Vertical.
4. Can you provide details about the market size?
The market size is estimated to be USD 24.36 Million as of 2022.
5. What are some drivers contributing to market growth?
Increasing Environmental Concerns and Growing Focus on Reducing Carbon Footprints; Strengthening Government Regulations.
6. What are the notable trends driving market growth?
Application in IT and Telecom to Drive the Green IT Service Market.
7. Are there any restraints impacting market growth?
Managing Variable Energy and Resource Demands.
8. Can you provide examples of recent developments in the market?
April 2022 - Huawei proposed the "Green and Low Carbon" concept at the Huawei Global Analyst Summit (HAS) 2022 for its Huawei CloudFabric 3.0 Hyper-Converged Data Center Network (DCN) Solution in order to use lossless networks to improve computing efficiency and reduce computing footprint and embrace green computing.
9. What pricing options are available for accessing the report?
Pricing options include single-user, multi-user, and enterprise licenses priced at USD 4750, USD 5250, and USD 8750 respectively.
10. Is the market size provided in terms of value or volume?
The market size is provided in terms of value, measured in Million.
11. Are there any specific market keywords associated with the report?
Yes, the market keyword associated with the report is "Green IT Services Market," which aids in identifying and referencing the specific market segment covered.
12. How do I determine which pricing option suits my needs best?
The pricing options vary based on user requirements and access needs. Individual users may opt for single-user licenses, while businesses requiring broader access may choose multi-user or enterprise licenses for cost-effective access to the report.
13. Are there any additional resources or data provided in the Green IT Services Market report?
While the report offers comprehensive insights, it's advisable to review the specific contents or supplementary materials provided to ascertain if additional resources or data are available.
14. How can I stay updated on further developments or reports in the Green IT Services Market?
To stay informed about further developments, trends, and reports in the Green IT Services Market, consider subscribing to industry newsletters, following relevant companies and organizations, or regularly checking reputable industry news sources and publications.
Methodology
Step 1 - Identification of Relevant Samples Size from Population Database


Step 2 - Approaches for Defining Global Market Size (Value, Volume* & Price*)

Note*: In applicable scenarios
Step 3 - Data Sources
Primary Research
- Web Analytics
- Survey Reports
- Research Institute
- Latest Research Reports
- Opinion Leaders
Secondary Research
- Annual Reports
- White Paper
- Latest Press Release
- Industry Association
- Paid Database
- Investor Presentations

Step 4 - Data Triangulation
Involves using different sources of information in order to increase the validity of a study
These sources are likely to be stakeholders in a program - participants, other researchers, program staff, other community members, and so on.
Then we put all data in single framework & apply various statistical tools to find out the dynamic on the market.
During the analysis stage, feedback from the stakeholder groups would be compared to determine areas of agreement as well as areas of divergence
