


Key Insights
The Global Gene Expression Market is projected for significant expansion, reaching an estimated market size of $15.89 billion by 2025, driven by a compelling CAGR of 4.87%. This robust growth is attributed to advancements in genomic technologies, the increasing incidence of chronic diseases, and the rising demand for personalized medicine. Gene expression profiling is instrumental in identifying novel therapeutic targets, understanding drug mechanisms, and accelerating drug discovery. In diagnostics, it enables early disease detection, prognosis, and treatment response monitoring, fostering precision healthcare. The market is segmented into consumables and instruments, both crucial for comprehensive gene expression analysis.
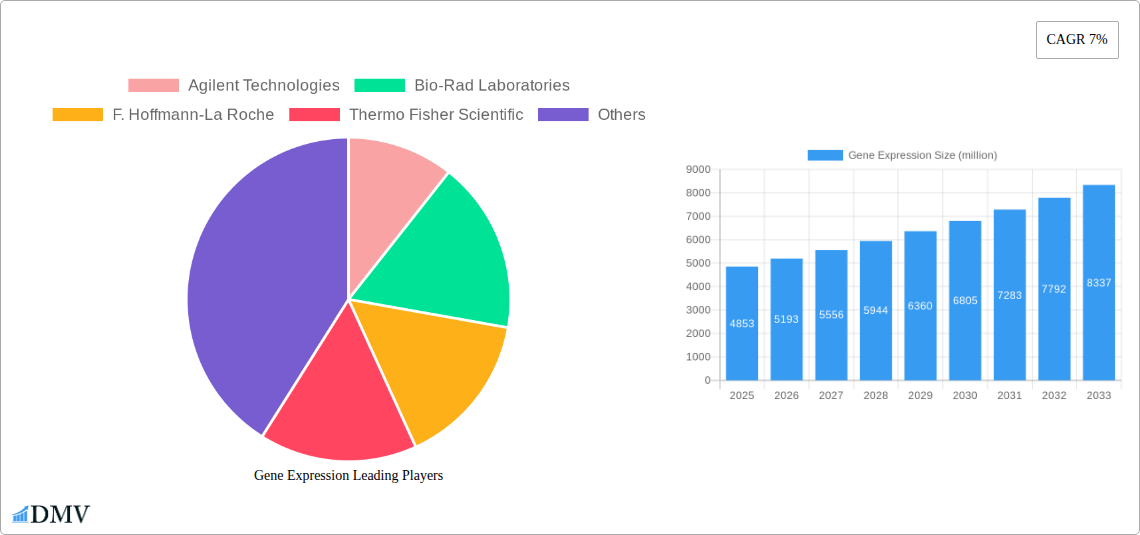
Gene Expression Market Size (In Billion)

Key trends shaping the Gene Expression Market include the widespread adoption of Next-Generation Sequencing (NGS) for enhanced throughput and accuracy, and the integration of Artificial Intelligence (AI) and Machine Learning (ML) for complex data interpretation and accelerated discoveries. The growing importance of liquid biopsies for non-invasive diagnostics also presents a substantial opportunity. While high costs and the need for specialized bioinformatics expertise are potential restraints, ongoing technological innovation and accessible cloud-based platforms are expected to ensure sustained market growth and a positive outlook for gene expression technologies.
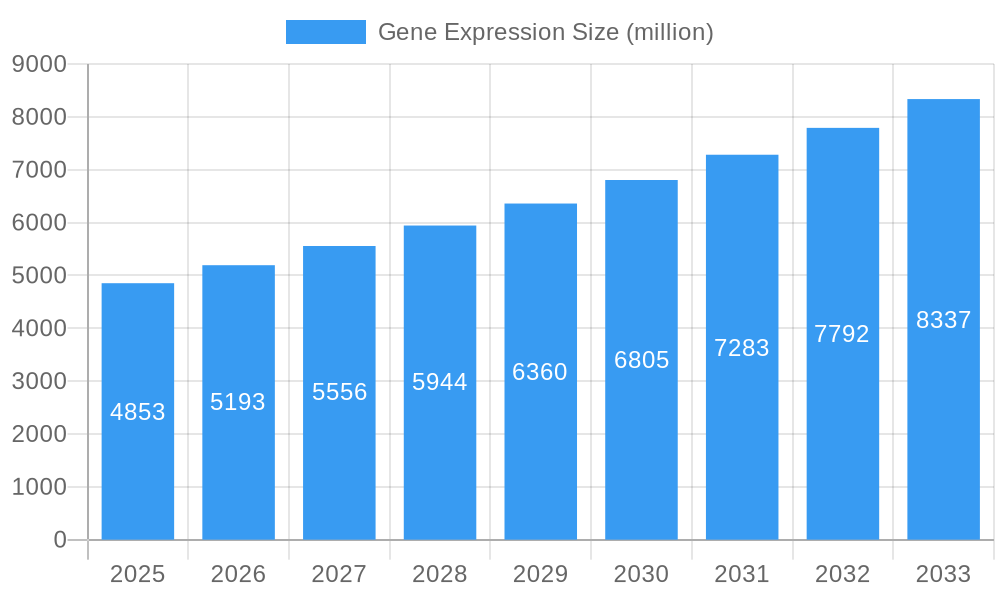
Gene Expression Company Market Share
This report provides an in-depth, data-driven analysis of the Global Gene Expression Market from 2025 to 2033. It covers market segmentation, industry evolution, regional dominance, product innovations, growth drivers, and challenges. Essential for stakeholders in drug discovery, diagnostics, genomics, biotechnology, and life sciences, this report offers insights into market trends, technological advancements, and strategic imperatives. It highlights key players such as Agilent Technologies, Bio-Rad Laboratories, F. Hoffmann-La Roche, and Thermo Fisher Scientific, and analyzes their contributions to the consumables and instruments segments. With comprehensive forecasts for the 2025-2033 period, this report equips stakeholders to anticipate market shifts, identify opportunities, and navigate the competitive landscape effectively.
Report Title: Global Gene Expression Market Analysis & Forecast: Driving Innovation in Drug Discovery, Diagnostics, and Precision Medicine (2025-2033)
Report Overview:
Explore the dynamic Global Gene Expression Market with this comprehensive, data-driven analysis. Covering the forecast period of 2025-2033, with a base year of 2025, this report details market composition, industry evolution, leading regional players, product innovations, growth drivers, and key challenges. Stakeholders in drug discovery, diagnostics, genomics, biotechnology, and life sciences will find this an indispensable resource. We examine market trends, technological advancements, and strategic imperatives shaping gene expression analysis. Identify key players, including Agilent Technologies, Bio-Rad Laboratories, F. Hoffmann-La Roche, and Thermo Fisher Scientific, and understand their impact on the consumables and instruments segments. This report empowers you to anticipate market dynamics, uncover lucrative opportunities, and confidently navigate the competitive landscape.
Gene Expression Market Composition & Trends
The Gene Expression market exhibits a moderately concentrated structure, driven by significant innovation catalysts and a complex regulatory landscape. Key players like Agilent Technologies and Thermo Fisher Scientific command substantial market share, estimated to be over 30% combined, due to their extensive portfolios in both consumables and advanced instrumentation. The market's innovation is propelled by ongoing advancements in sequencing technologies, CRISPR-based gene editing applications, and the increasing demand for personalized medicine in drug discovery. Regulatory frameworks, particularly those governing diagnostic applications, play a crucial role in shaping market access and product development timelines. Substitute products, such as microarrays and earlier PCR-based methods, are gradually being overshadowed by the superior throughput and sensitivity of next-generation sequencing (NGS) and single-cell RNA sequencing. End-user profiles range from academic research institutions and pharmaceutical companies focused on drug discovery to clinical diagnostic laboratories and contract research organizations (CROs). Mergers and acquisitions (M&A) activity remains robust, with recent deals valued in the hundreds of millions, signaling consolidation and strategic expansion. For instance, a notable acquisition in 2023 involved a leading genomics company acquiring a specialized gene synthesis firm for approximately 500 million, further consolidating market expertise and technological capabilities.
- Market Share Distribution: Leading players hold over 30% of the market.
- Innovation Catalysts: NGS, single-cell sequencing, CRISPR applications, personalized medicine.
- Regulatory Landscape: Stringent regulations in diagnostics, accelerating adoption in research.
- Substitute Products: Microarrays, traditional PCR are declining in favor of advanced sequencing.
- End-User Profiles: Academia, Pharma (Drug Discovery), Clinical Diagnostics, CROs.
- M&A Activity: Significant consolidation with deal values in the hundreds of millions, including a ~500 million acquisition in 2023.
Gene Expression Industry Evolution
The gene expression industry has undergone a remarkable transformation, evolving from niche research applications to a cornerstone of modern biotechnology and healthcare. The historical period from 2019 to 2024 witnessed a compounded annual growth rate (CAGR) of approximately 12%, driven by increasing investments in genomics research and a growing understanding of the role of gene expression in disease pathogenesis. Technological advancements have been the primary engine of this evolution. The transition from microarray-based gene expression profiling to high-throughput next-generation sequencing (NGS) has dramatically increased data accuracy, sensitivity, and analytical capacity, enabling researchers to study gene expression at unprecedented resolutions. This shift has been further amplified by the advent of single-cell RNA sequencing (scRNA-seq), allowing for the dissection of cellular heterogeneity and the identification of rare cell populations, crucial for both fundamental research and targeted therapeutic development.
Consumer demand, or rather, end-user demand in this context, has mirrored these technological leaps. The pharmaceutical industry's pursuit of novel drug targets and biomarkers for precision medicine has fueled the adoption of gene expression analysis in drug discovery pipelines. Similarly, the diagnostics sector has increasingly integrated gene expression profiling for disease detection, prognosis, and treatment response prediction, particularly in oncology. The increasing accessibility and decreasing cost of sequencing technologies have democratized gene expression analysis, making it viable for a broader range of research applications and clinical settings. Furthermore, the integration of bioinformatics and advanced computational tools has become indispensable for managing and interpreting the vast datasets generated, fostering a symbiotic relationship between wet-lab experimentation and data science.
The period leading up to the base year of 2025 has seen a sustained upward trajectory, with an estimated CAGR of 13.5% for the historical period. This growth is a direct consequence of enhanced understanding of complex biological systems and the direct translation of genomic insights into tangible therapeutic and diagnostic solutions. The industry is moving beyond simply identifying differentially expressed genes to understanding the intricate regulatory networks and pathways that govern cellular function. This deeper mechanistic understanding is critical for developing more effective and personalized interventions. The market's evolution is characterized by a continuous cycle of innovation, adoption, and refinement, setting the stage for even more significant breakthroughs in the forecast period. The foundational work laid in the historical period has solidified gene expression analysis as a critical discipline, with an estimated market size reaching approximately 9,000 million by the end of 2024.
Leading Regions, Countries, or Segments in Gene Expression
North America currently dominates the global gene expression market, driven by substantial investments in life sciences research and development, a robust pharmaceutical and biotechnology industry, and a supportive regulatory environment for innovation. The United States, in particular, is a powerhouse, contributing an estimated 60% of the regional market value. This dominance is fueled by extensive government funding for genomics research, leading academic institutions, and a high concentration of major pharmaceutical and biotech companies actively engaged in drug discovery and diagnostics. The rapid adoption of advanced gene expression technologies, such as NGS and single-cell analysis, in both academic and clinical settings further solidifies North America's leading position.
In terms of Application segments, Drug Discovery represents the largest and fastest-growing area. Pharmaceutical and biotechnology companies are increasingly leveraging gene expression profiling to identify novel drug targets, validate therapeutic candidates, understand drug mechanisms of action, and develop personalized medicine strategies. The estimated market share for Drug Discovery applications is approximately 45%, with an expected CAGR of 14% during the forecast period. This is closely followed by Diagnostics, which accounts for an estimated 35% of the market. The rising incidence of chronic diseases, the demand for early disease detection, and the development of companion diagnostics are key drivers in this segment.
Analyzing by Type, Instruments represent a significant portion of the market, estimated at 40% of the total value. This segment includes advanced sequencers, qPCR machines, microarrays, and single-cell analysis platforms. However, the Consumables segment, which encompasses reagents, kits, and assays necessary for gene expression analysis, is projected to grow at a slightly faster CAGR of 13.5% during the forecast period, reaching an estimated 60% of the overall market value by 2033. This growth is attributed to the increasing utilization of existing instruments and the recurring need for these essential components in high-throughput applications. The total market size for instruments is projected to be around 3,600 million in 2025.
Key drivers for North America's leadership include:
- High R&D Expenditure: Significant government and private sector investment in genomics and biotechnology research, estimated to be over 15,000 million annually.
- Strong Regulatory Support: Streamlined approval processes for novel diagnostic tests and therapeutic applications.
- Advanced Healthcare Infrastructure: Widespread adoption of advanced diagnostic tools and personalized medicine approaches.
- Presence of Key Players: Home to major companies like Thermo Fisher Scientific and Agilent Technologies, fostering innovation and market growth.
- Growing Demand for Precision Medicine: Increasing focus on tailoring treatments based on an individual's genetic makeup.
Gene Expression Product Innovations
Recent product innovations in gene expression are revolutionizing analytical capabilities and accessibility. Advancements in single-cell RNA sequencing (scRNA-seq) technologies, exemplified by platforms offering improved throughput and reduced cell dissociation bias, allow for the identification of rare cell populations and the elucidation of complex cellular interactions, crucial for understanding developmental biology and disease. Novel library preparation kits are emerging that significantly reduce sample input requirements and amplify target transcripts with higher fidelity, enabling analysis from extremely limited biological samples. Furthermore, the development of integrated, benchtop sequencers with simplified workflows and enhanced bioinformatics pipelines is democratizing NGS capabilities, making them accessible to a wider range of laboratories beyond specialized genomics centers. These innovations contribute to higher assay sensitivity, improved data reproducibility, and faster turnaround times for critical research and diagnostic applications, with an estimated total market value for innovative instruments exceeding 3,600 million.
Propelling Factors for Gene Expression Growth
The gene expression market is propelled by a confluence of powerful factors. Technological advancements, particularly in next-generation sequencing (NGS) and single-cell analysis, have dramatically enhanced precision, throughput, and affordability, making complex genomic insights accessible. The escalating demand for personalized medicine in oncology and other therapeutic areas fuels the need for gene expression profiling to identify biomarkers and tailor treatments. Robust government and private sector investments in life sciences research, estimated to be over 15,000 million annually, provide essential funding for innovation and adoption. Furthermore, a growing awareness of the genetic underpinnings of diseases is driving the development and clinical implementation of gene expression-based diagnostics.
Obstacles in the Gene Expression Market
Despite robust growth, the gene expression market faces several obstacles. The high cost of advanced instrumentation and sequencing services remains a significant barrier, particularly for smaller research institutions and emerging markets, with initial instrument investments reaching up to 1 million. Complex data analysis and interpretation require specialized bioinformatics expertise and computational infrastructure, which are not universally available. Stringent regulatory approval processes for diagnostic applications can lead to lengthy development timelines and market entry challenges, impacting adoption rates. Supply chain disruptions for critical reagents and consumables, exacerbated by global events, can also impede research and production, potentially impacting market stability.
Future Opportunities in Gene Expression
Emerging opportunities in the gene expression market are vast and ripe for exploitation. The expansion of gene expression analysis into new therapeutic areas beyond oncology, such as neurodegenerative diseases and infectious diseases, presents significant growth potential. Advancements in spatial transcriptomics, which enable the study of gene expression within its cellular context, are opening new avenues for understanding tissue architecture and disease mechanisms. The increasing integration of AI and machine learning for analyzing vast gene expression datasets promises to accelerate drug discovery and diagnostic breakthroughs. Furthermore, the growing adoption of direct-to-consumer genetic testing and the burgeoning field of liquid biopsies for non-invasive diagnostics are creating new market frontiers.
Major Players in the Gene Expression Ecosystem
- Agilent Technologies
- Bio-Rad Laboratories
- F. Hoffmann-La Roche
- Thermo Fisher Scientific
Key Developments in Gene Expression Industry
- 2023 February: Launch of a new high-throughput single-cell RNA sequencing platform by Thermo Fisher Scientific, significantly increasing cell capture efficiency and reducing experimental bias.
- 2023 May: Agilent Technologies announces an expanded partnership with a leading genomics research institute to accelerate cancer research using gene expression profiling.
- 2023 August: Bio-Rad Laboratories releases an updated suite of qPCR reagents optimized for low-input sample analysis, enhancing sensitivity in diagnostics.
- 2024 January: F. Hoffmann-La Roche receives regulatory approval for a novel gene expression-based diagnostic test for early-stage Alzheimer's detection.
- 2024 March: A major bioinformatics company unveils an AI-powered platform for predictive gene expression analysis in drug discovery, reducing candidate screening time by an estimated 30%.
- 2024 June: Thermo Fisher Scientific acquires a company specializing in spatial transcriptomics technology, aiming to integrate advanced spatial analysis into its sequencing portfolio.
Strategic Gene Expression Market Forecast
The strategic gene expression market forecast is exceptionally promising, driven by sustained technological innovation and expanding applications. The continued evolution of sequencing and single-cell analysis technologies, coupled with breakthroughs in AI-driven data interpretation, will unlock unprecedented insights into biological processes and disease mechanisms. The increasing demand for personalized medicine and targeted therapies across various medical fields will solidify gene expression profiling's role as a critical diagnostic and prognostic tool. Investments in research and development, alongside supportive regulatory pathways, will foster the adoption of gene expression technologies in both clinical and industrial settings, ensuring robust market growth and innovation throughout the forecast period, with an estimated market value expected to reach over 18,000 million by 2033.
Gene Expression Segmentation
-
1. Application
- 1.1. Drug Discovery
- 1.2. Diagnostics
-
2. Type
- 2.1. Consumables
- 2.2. Instruments
Gene Expression Segmentation By Geography
-
1. North America
- 1.1. United States
- 1.2. Canada
- 1.3. Mexico
-
2. South America
- 2.1. Brazil
- 2.2. Argentina
- 2.3. Rest of South America
-
3. Europe
- 3.1. United Kingdom
- 3.2. Germany
- 3.3. France
- 3.4. Italy
- 3.5. Spain
- 3.6. Russia
- 3.7. Benelux
- 3.8. Nordics
- 3.9. Rest of Europe
-
4. Middle East & Africa
- 4.1. Turkey
- 4.2. Israel
- 4.3. GCC
- 4.4. North Africa
- 4.5. South Africa
- 4.6. Rest of Middle East & Africa
-
5. Asia Pacific
- 5.1. China
- 5.2. India
- 5.3. Japan
- 5.4. South Korea
- 5.5. ASEAN
- 5.6. Oceania
- 5.7. Rest of Asia Pacific
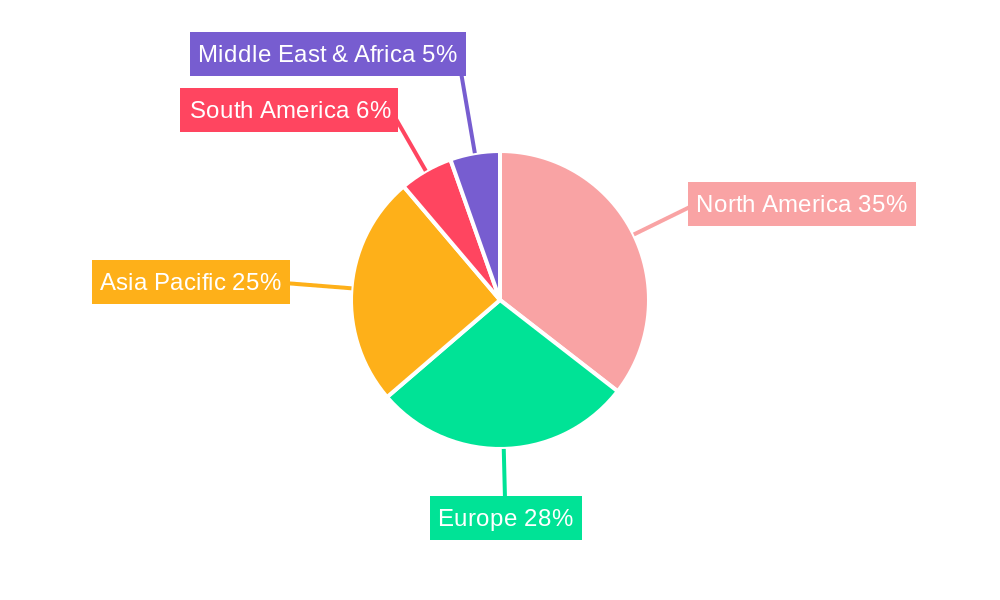
Gene Expression Regional Market Share
Geographic Coverage of Gene Expression
Gene Expression REPORT HIGHLIGHTS
| Aspects | Details |
|---|---|
| Study Period | 2020-2034 |
| Base Year | 2025 |
| Estimated Year | 2026 |
| Forecast Period | 2026-2034 |
| Historical Period | 2020-2025 |
| Growth Rate | CAGR of 4.87% from 2020-2034 |
| Segmentation |
|
Table of Contents
- 1. Introduction
- 1.1. Research Scope
- 1.2. Market Segmentation
- 1.3. Research Objective
- 1.4. Definitions and Assumptions
- 2. Executive Summary
- 2.1. Market Snapshot
- 3. Market Dynamics
- 3.1. Market Drivers
- 3.2. Market Restrains
- 3.3. Market Trends
- 3.4. Market Opportunities
- 4. Market Factor Analysis
- 4.1. Porters Five Forces
- 4.1.1. Bargaining Power of Suppliers
- 4.1.2. Bargaining Power of Buyers
- 4.1.3. Threat of New Entrants
- 4.1.4. Threat of Substitutes
- 4.1.5. Competitive Rivalry
- 4.2. PESTEL analysis
- 4.3. BCG Analysis
- 4.3.1. Stars (High Growth, High Market Share)
- 4.3.2. Cash Cows (Low Growth, High Market Share)
- 4.3.3. Question Mark (High Growth, Low Market Share)
- 4.3.4. Dogs (Low Growth, Low Market Share)
- 4.4. Ansoff Matrix Analysis
- 4.5. Supply Chain Analysis
- 4.6. Regulatory Landscape
- 4.7. Current Market Potential and Opportunity Assessment (TAM–SAM–SOM Framework)
- 4.8. DMV Analyst Note
- 4.1. Porters Five Forces
- 5. Market Analysis, Insights and Forecast 2021-2033
- 5.1. Market Analysis, Insights and Forecast - by Application
- 5.1.1. Drug Discovery
- 5.1.2. Diagnostics
- 5.2. Market Analysis, Insights and Forecast - by Type
- 5.2.1. Consumables
- 5.2.2. Instruments
- 5.3. Market Analysis, Insights and Forecast - by Region
- 5.3.1. North America
- 5.3.2. South America
- 5.3.3. Europe
- 5.3.4. Middle East & Africa
- 5.3.5. Asia Pacific
- 5.1. Market Analysis, Insights and Forecast - by Application
- 6. Global Gene Expression Analysis, Insights and Forecast, 2021-2033
- 6.1. Market Analysis, Insights and Forecast - by Application
- 6.1.1. Drug Discovery
- 6.1.2. Diagnostics
- 6.2. Market Analysis, Insights and Forecast - by Type
- 6.2.1. Consumables
- 6.2.2. Instruments
- 6.1. Market Analysis, Insights and Forecast - by Application
- 7. North America Gene Expression Analysis, Insights and Forecast, 2020-2032
- 7.1. Market Analysis, Insights and Forecast - by Application
- 7.1.1. Drug Discovery
- 7.1.2. Diagnostics
- 7.2. Market Analysis, Insights and Forecast - by Type
- 7.2.1. Consumables
- 7.2.2. Instruments
- 7.1. Market Analysis, Insights and Forecast - by Application
- 8. South America Gene Expression Analysis, Insights and Forecast, 2020-2032
- 8.1. Market Analysis, Insights and Forecast - by Application
- 8.1.1. Drug Discovery
- 8.1.2. Diagnostics
- 8.2. Market Analysis, Insights and Forecast - by Type
- 8.2.1. Consumables
- 8.2.2. Instruments
- 8.1. Market Analysis, Insights and Forecast - by Application
- 9. Europe Gene Expression Analysis, Insights and Forecast, 2020-2032
- 9.1. Market Analysis, Insights and Forecast - by Application
- 9.1.1. Drug Discovery
- 9.1.2. Diagnostics
- 9.2. Market Analysis, Insights and Forecast - by Type
- 9.2.1. Consumables
- 9.2.2. Instruments
- 9.1. Market Analysis, Insights and Forecast - by Application
- 10. Middle East & Africa Gene Expression Analysis, Insights and Forecast, 2020-2032
- 10.1. Market Analysis, Insights and Forecast - by Application
- 10.1.1. Drug Discovery
- 10.1.2. Diagnostics
- 10.2. Market Analysis, Insights and Forecast - by Type
- 10.2.1. Consumables
- 10.2.2. Instruments
- 10.1. Market Analysis, Insights and Forecast - by Application
- 11. Asia Pacific Gene Expression Analysis, Insights and Forecast, 2020-2032
- 11.1. Market Analysis, Insights and Forecast - by Application
- 11.1.1. Drug Discovery
- 11.1.2. Diagnostics
- 11.2. Market Analysis, Insights and Forecast - by Type
- 11.2.1. Consumables
- 11.2.2. Instruments
- 11.1. Market Analysis, Insights and Forecast - by Application
- 12. Competitive Analysis
- 12.1. Company Profiles
- 12.1.1 Agilent Technologies
- 12.1.1.1. Company Overview
- 12.1.1.2. Products
- 12.1.1.3. Company Financials
- 12.1.1.4. SWOT Analysis
- 12.1.2 Bio-Rad Laboratories
- 12.1.2.1. Company Overview
- 12.1.2.2. Products
- 12.1.2.3. Company Financials
- 12.1.2.4. SWOT Analysis
- 12.1.3 F. Hoffmann-La Roche
- 12.1.3.1. Company Overview
- 12.1.3.2. Products
- 12.1.3.3. Company Financials
- 12.1.3.4. SWOT Analysis
- 12.1.4 Thermo Fisher Scientific
- 12.1.4.1. Company Overview
- 12.1.4.2. Products
- 12.1.4.3. Company Financials
- 12.1.4.4. SWOT Analysis
- 12.1.1 Agilent Technologies
- 12.2. Market Entropy
- 12.2.1 Company's Key Areas Served
- 12.2.2 Recent Developments
- 12.3. Company Market Share Analysis 2025
- 12.3.1 Top 5 Companies Market Share Analysis
- 12.3.2 Top 3 Companies Market Share Analysis
- 12.4. List of Potential Customers
- 13. Research Methodology
List of Figures
- Figure 1: Global Gene Expression Revenue Breakdown (billion, %) by Region 2025 & 2033
- Figure 2: North America Gene Expression Revenue (billion), by Application 2025 & 2033
- Figure 3: North America Gene Expression Revenue Share (%), by Application 2025 & 2033
- Figure 4: North America Gene Expression Revenue (billion), by Type 2025 & 2033
- Figure 5: North America Gene Expression Revenue Share (%), by Type 2025 & 2033
- Figure 6: North America Gene Expression Revenue (billion), by Country 2025 & 2033
- Figure 7: North America Gene Expression Revenue Share (%), by Country 2025 & 2033
- Figure 8: South America Gene Expression Revenue (billion), by Application 2025 & 2033
- Figure 9: South America Gene Expression Revenue Share (%), by Application 2025 & 2033
- Figure 10: South America Gene Expression Revenue (billion), by Type 2025 & 2033
- Figure 11: South America Gene Expression Revenue Share (%), by Type 2025 & 2033
- Figure 12: South America Gene Expression Revenue (billion), by Country 2025 & 2033
- Figure 13: South America Gene Expression Revenue Share (%), by Country 2025 & 2033
- Figure 14: Europe Gene Expression Revenue (billion), by Application 2025 & 2033
- Figure 15: Europe Gene Expression Revenue Share (%), by Application 2025 & 2033
- Figure 16: Europe Gene Expression Revenue (billion), by Type 2025 & 2033
- Figure 17: Europe Gene Expression Revenue Share (%), by Type 2025 & 2033
- Figure 18: Europe Gene Expression Revenue (billion), by Country 2025 & 2033
- Figure 19: Europe Gene Expression Revenue Share (%), by Country 2025 & 2033
- Figure 20: Middle East & Africa Gene Expression Revenue (billion), by Application 2025 & 2033
- Figure 21: Middle East & Africa Gene Expression Revenue Share (%), by Application 2025 & 2033
- Figure 22: Middle East & Africa Gene Expression Revenue (billion), by Type 2025 & 2033
- Figure 23: Middle East & Africa Gene Expression Revenue Share (%), by Type 2025 & 2033
- Figure 24: Middle East & Africa Gene Expression Revenue (billion), by Country 2025 & 2033
- Figure 25: Middle East & Africa Gene Expression Revenue Share (%), by Country 2025 & 2033
- Figure 26: Asia Pacific Gene Expression Revenue (billion), by Application 2025 & 2033
- Figure 27: Asia Pacific Gene Expression Revenue Share (%), by Application 2025 & 2033
- Figure 28: Asia Pacific Gene Expression Revenue (billion), by Type 2025 & 2033
- Figure 29: Asia Pacific Gene Expression Revenue Share (%), by Type 2025 & 2033
- Figure 30: Asia Pacific Gene Expression Revenue (billion), by Country 2025 & 2033
- Figure 31: Asia Pacific Gene Expression Revenue Share (%), by Country 2025 & 2033
List of Tables
- Table 1: Global Gene Expression Revenue billion Forecast, by Application 2020 & 2033
- Table 2: Global Gene Expression Revenue billion Forecast, by Type 2020 & 2033
- Table 3: Global Gene Expression Revenue billion Forecast, by Region 2020 & 2033
- Table 4: Global Gene Expression Revenue billion Forecast, by Application 2020 & 2033
- Table 5: Global Gene Expression Revenue billion Forecast, by Type 2020 & 2033
- Table 6: Global Gene Expression Revenue billion Forecast, by Country 2020 & 2033
- Table 7: United States Gene Expression Revenue (billion) Forecast, by Application 2020 & 2033
- Table 8: Canada Gene Expression Revenue (billion) Forecast, by Application 2020 & 2033
- Table 9: Mexico Gene Expression Revenue (billion) Forecast, by Application 2020 & 2033
- Table 10: Global Gene Expression Revenue billion Forecast, by Application 2020 & 2033
- Table 11: Global Gene Expression Revenue billion Forecast, by Type 2020 & 2033
- Table 12: Global Gene Expression Revenue billion Forecast, by Country 2020 & 2033
- Table 13: Brazil Gene Expression Revenue (billion) Forecast, by Application 2020 & 2033
- Table 14: Argentina Gene Expression Revenue (billion) Forecast, by Application 2020 & 2033
- Table 15: Rest of South America Gene Expression Revenue (billion) Forecast, by Application 2020 & 2033
- Table 16: Global Gene Expression Revenue billion Forecast, by Application 2020 & 2033
- Table 17: Global Gene Expression Revenue billion Forecast, by Type 2020 & 2033
- Table 18: Global Gene Expression Revenue billion Forecast, by Country 2020 & 2033
- Table 19: United Kingdom Gene Expression Revenue (billion) Forecast, by Application 2020 & 2033
- Table 20: Germany Gene Expression Revenue (billion) Forecast, by Application 2020 & 2033
- Table 21: France Gene Expression Revenue (billion) Forecast, by Application 2020 & 2033
- Table 22: Italy Gene Expression Revenue (billion) Forecast, by Application 2020 & 2033
- Table 23: Spain Gene Expression Revenue (billion) Forecast, by Application 2020 & 2033
- Table 24: Russia Gene Expression Revenue (billion) Forecast, by Application 2020 & 2033
- Table 25: Benelux Gene Expression Revenue (billion) Forecast, by Application 2020 & 2033
- Table 26: Nordics Gene Expression Revenue (billion) Forecast, by Application 2020 & 2033
- Table 27: Rest of Europe Gene Expression Revenue (billion) Forecast, by Application 2020 & 2033
- Table 28: Global Gene Expression Revenue billion Forecast, by Application 2020 & 2033
- Table 29: Global Gene Expression Revenue billion Forecast, by Type 2020 & 2033
- Table 30: Global Gene Expression Revenue billion Forecast, by Country 2020 & 2033
- Table 31: Turkey Gene Expression Revenue (billion) Forecast, by Application 2020 & 2033
- Table 32: Israel Gene Expression Revenue (billion) Forecast, by Application 2020 & 2033
- Table 33: GCC Gene Expression Revenue (billion) Forecast, by Application 2020 & 2033
- Table 34: North Africa Gene Expression Revenue (billion) Forecast, by Application 2020 & 2033
- Table 35: South Africa Gene Expression Revenue (billion) Forecast, by Application 2020 & 2033
- Table 36: Rest of Middle East & Africa Gene Expression Revenue (billion) Forecast, by Application 2020 & 2033
- Table 37: Global Gene Expression Revenue billion Forecast, by Application 2020 & 2033
- Table 38: Global Gene Expression Revenue billion Forecast, by Type 2020 & 2033
- Table 39: Global Gene Expression Revenue billion Forecast, by Country 2020 & 2033
- Table 40: China Gene Expression Revenue (billion) Forecast, by Application 2020 & 2033
- Table 41: India Gene Expression Revenue (billion) Forecast, by Application 2020 & 2033
- Table 42: Japan Gene Expression Revenue (billion) Forecast, by Application 2020 & 2033
- Table 43: South Korea Gene Expression Revenue (billion) Forecast, by Application 2020 & 2033
- Table 44: ASEAN Gene Expression Revenue (billion) Forecast, by Application 2020 & 2033
- Table 45: Oceania Gene Expression Revenue (billion) Forecast, by Application 2020 & 2033
- Table 46: Rest of Asia Pacific Gene Expression Revenue (billion) Forecast, by Application 2020 & 2033
Frequently Asked Questions
1. What is the projected Compound Annual Growth Rate (CAGR) of the Gene Expression?
The projected CAGR is approximately 4.87%.
2. Which companies are prominent players in the Gene Expression?
Key companies in the market include Agilent Technologies, Bio-Rad Laboratories, F. Hoffmann-La Roche, Thermo Fisher Scientific.
3. What are the main segments of the Gene Expression?
The market segments include Application, Type.
4. Can you provide details about the market size?
The market size is estimated to be USD 15.89 billion as of 2022.
5. What are some drivers contributing to market growth?
N/A
6. What are the notable trends driving market growth?
N/A
7. Are there any restraints impacting market growth?
N/A
8. Can you provide examples of recent developments in the market?
N/A
9. What pricing options are available for accessing the report?
Pricing options include single-user, multi-user, and enterprise licenses priced at USD 2900.00, USD 4350.00, and USD 5800.00 respectively.
10. Is the market size provided in terms of value or volume?
The market size is provided in terms of value, measured in billion.
11. Are there any specific market keywords associated with the report?
Yes, the market keyword associated with the report is "Gene Expression," which aids in identifying and referencing the specific market segment covered.
12. How do I determine which pricing option suits my needs best?
The pricing options vary based on user requirements and access needs. Individual users may opt for single-user licenses, while businesses requiring broader access may choose multi-user or enterprise licenses for cost-effective access to the report.
13. Are there any additional resources or data provided in the Gene Expression report?
While the report offers comprehensive insights, it's advisable to review the specific contents or supplementary materials provided to ascertain if additional resources or data are available.
14. How can I stay updated on further developments or reports in the Gene Expression?
To stay informed about further developments, trends, and reports in the Gene Expression, consider subscribing to industry newsletters, following relevant companies and organizations, or regularly checking reputable industry news sources and publications.
Methodology
Step 1 - Identification of Relevant Samples Size from Population Database



Step 2 - Approaches for Defining Global Market Size (Value, Volume* & Price*)

Note*: In applicable scenarios
Step 3 - Data Sources
Primary Research
- Web Analytics
- Survey Reports
- Research Institute
- Latest Research Reports
- Opinion Leaders
Secondary Research
- Annual Reports
- White Paper
- Latest Press Release
- Industry Association
- Paid Database
- Investor Presentations

Step 4 - Data Triangulation
Involves using different sources of information in order to increase the validity of a study
These sources are likely to be stakeholders in a program - participants, other researchers, program staff, other community members, and so on.
Then we put all data in single framework & apply various statistical tools to find out the dynamic on the market.
During the analysis stage, feedback from the stakeholder groups would be compared to determine areas of agreement as well as areas of divergence