

Key Insights
The Full Body CT Scanners market is poised for significant expansion, projected to reach $13.42 billion by 2025. This robust growth is fueled by an anticipated Compound Annual Growth Rate (CAGR) of 9.19% through 2033. Key drivers propelling this upward trajectory include advancements in imaging technology, leading to higher resolution and faster scan times, which are crucial for early and accurate diagnosis across a spectrum of medical conditions. The increasing prevalence of chronic diseases such as cancer, cardiovascular ailments, and neurological disorders is a primary demand generator, as CT scans play an indispensable role in diagnosis, treatment planning, and monitoring. Furthermore, the growing adoption of CT scanners in emerging economies, driven by improving healthcare infrastructure and increased healthcare spending, contributes substantially to market expansion. The rise of minimally invasive procedures and the need for detailed anatomical visualization further bolster the market's potential.
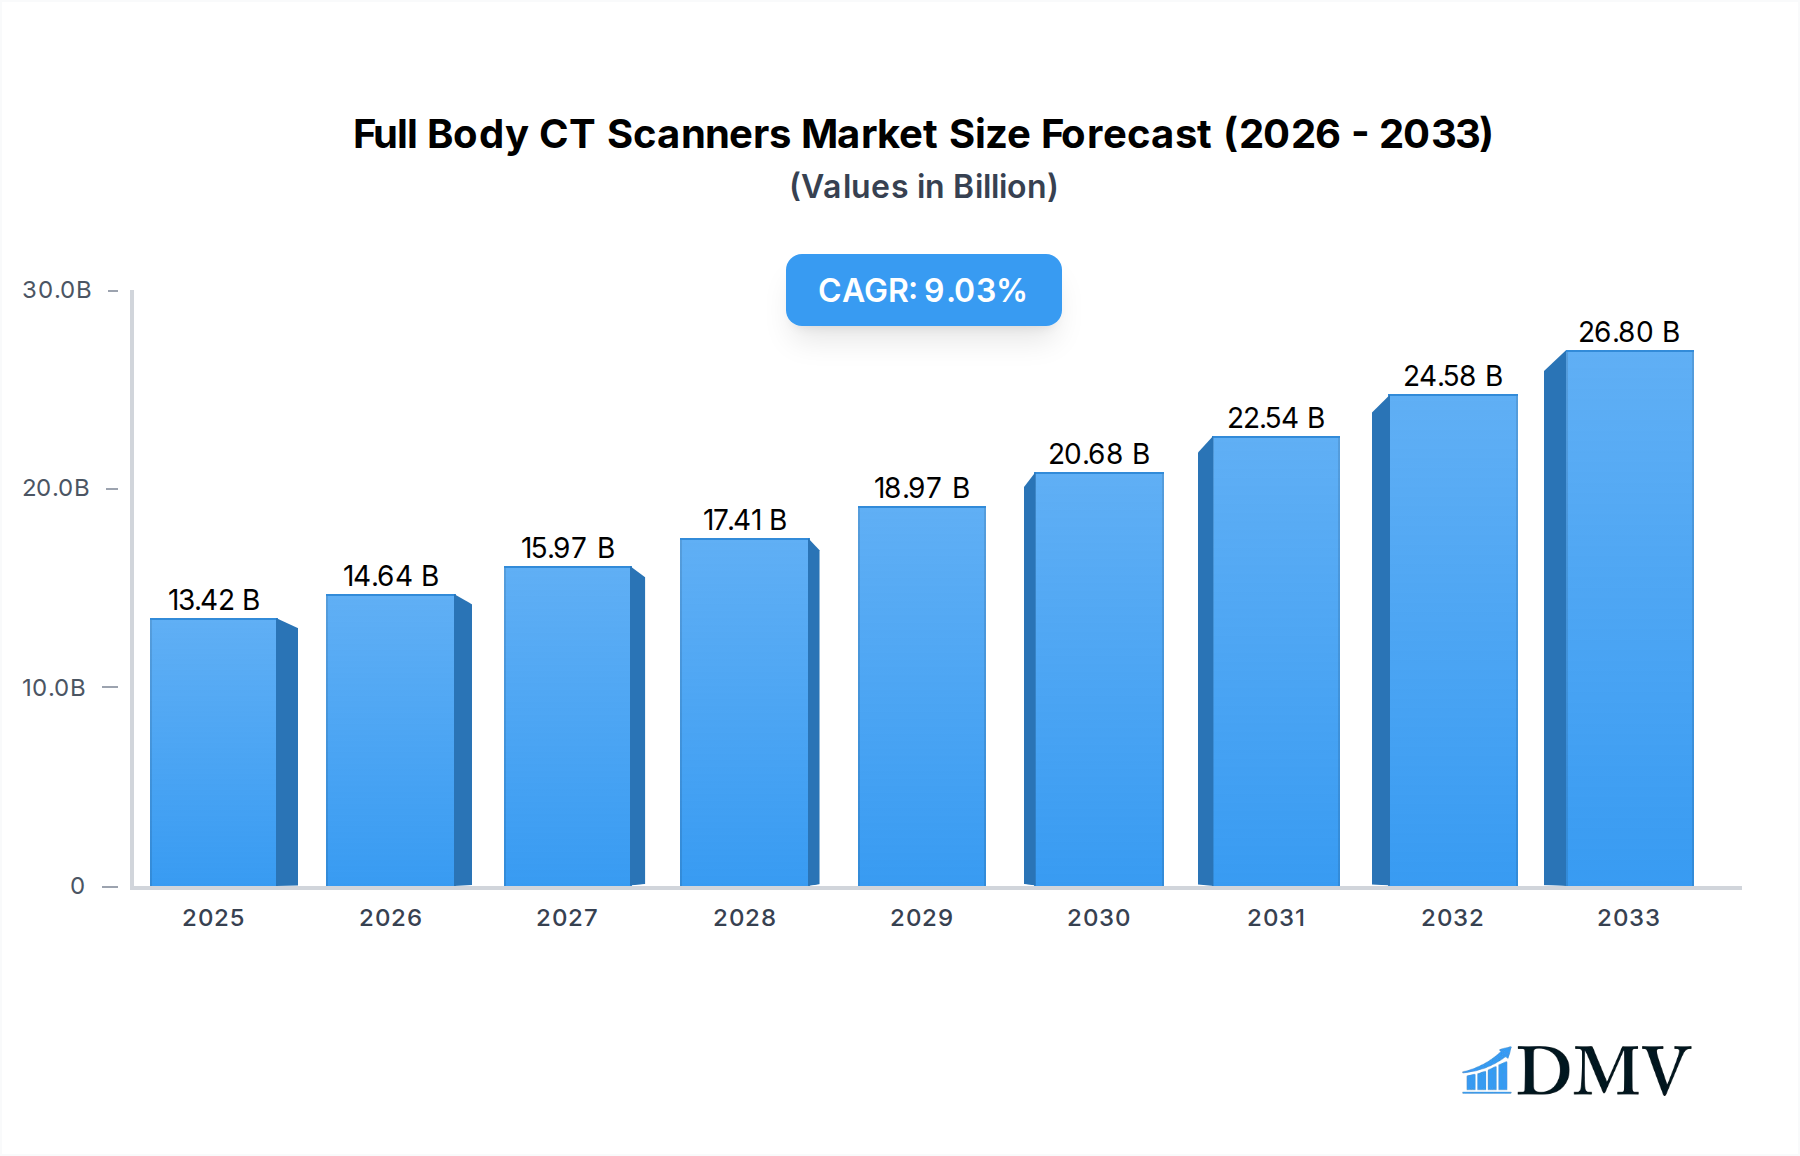
Full Body CT Scanners Market Size (In Billion)
The market segmentation reveals a dynamic landscape. The Neurology and Oncology segments are expected to dominate due to the critical need for precise imaging in these fields. Cardiology also presents a strong growth area with the increasing incidence of heart-related diseases. Within types, mobile (portable) CT scanners are gaining traction due to their flexibility in deployment, especially in emergency situations and remote areas, complementing the established dominance of fixed types. Geographically, North America and Europe currently lead the market due to advanced healthcare systems and high patient awareness. However, the Asia Pacific region is anticipated to witness the fastest growth, driven by substantial investments in healthcare infrastructure, a burgeoning patient population, and the presence of major manufacturing hubs. Leading companies like GE Healthcare, Philips Healthcare, and Siemens are at the forefront of innovation, introducing more efficient and patient-friendly CT scanner solutions, which will continue to shape market dynamics.

Full Body CT Scanners Company Market Share
Full Body CT Scanners Market Outlook: Comprehensive Analysis & Strategic Forecast (2019-2033)
This in-depth report provides a comprehensive analysis of the global Full Body CT Scanners market, offering critical insights for stakeholders seeking to navigate this dynamic sector. Covering a study period from 2019 to 2033, with a base year of 2025, this report delves into market composition, industry evolution, regional dominance, product innovations, growth drivers, obstacles, future opportunities, key players, and strategic forecasts. Leveraging high-ranking SEO keywords such as "full body CT scanner market," "CT imaging technology," "advanced medical diagnostics," and "oncology CT solutions," this report is designed to maximize search visibility and captivate industry leaders. All monetary values are presented in billions.
Full Body CT Scanners Market Composition & Trends
The global Full Body CT Scanners market is characterized by a moderate to high level of concentration, with leading players investing significantly in research and development to drive innovation. The market is propelled by increasing demand for early disease detection and the growing prevalence of chronic conditions. Regulatory landscapes, while evolving, generally support the adoption of advanced imaging technologies. Substitute products, such as MRI and PET scans, offer alternative diagnostic capabilities, but full body CT scanners provide a unique balance of speed, comprehensive coverage, and cost-effectiveness for certain applications. End-user profiles span a wide spectrum, from large hospital networks and specialized imaging centers to outpatient clinics and research institutions. Merger and acquisition (M&A) activities are a notable trend, with an estimated total deal value exceeding $10 billion in the historical period.
- Market Share Distribution: The top 5 players are estimated to hold approximately 65% of the market share.
- Innovation Catalysts: AI-powered image reconstruction, reduced radiation dose technologies, and portable CT scanner development are key drivers.
- Regulatory Landscapes: FDA, CE Mark, and NMPA approvals are crucial for market entry and expansion.
- Substitute Products: MRI, PET scans, and advanced ultrasound systems offer competitive diagnostic modalities.
- End-User Profiles: Hospitals (60%), imaging centers (25%), research institutions (10%), and others (5%) represent key customer segments.
- M&A Activities: Strategic acquisitions are aimed at expanding product portfolios and geographical reach. Notable M&A deals in the historical period are valued at over $2 billion.
Full Body CT Scanners Industry Evolution
The Full Body CT Scanners industry has witnessed remarkable evolution driven by technological advancements and an increasing global demand for sophisticated diagnostic tools. From its inception, the market has seen a consistent upward trajectory in growth, with the historical period (2019-2024) exhibiting an average annual growth rate of approximately 6.5%. The base year of 2025 is projected to be a pivotal point, with an estimated market size of $XX billion. This growth is underpinned by significant investments in research and development, leading to enhanced image resolution, faster scan times, and reduced radiation exposure for patients. The adoption of Artificial Intelligence (AI) and machine learning algorithms is revolutionizing CT imaging, enabling more accurate diagnoses, automated image analysis, and personalized treatment planning. The increasing prevalence of chronic diseases like cancer, cardiovascular ailments, and neurological disorders necessitates comprehensive and efficient diagnostic solutions, further fueling market expansion. Furthermore, the development of mobile and portable CT scanners is democratizing access to advanced imaging, particularly in remote or underserved areas, contributing to an estimated adoption rate increase of over 15% in the forecast period. The integration of photon-counting detector technology and iterative reconstruction techniques are also key advancements pushing the boundaries of diagnostic capabilities, with an anticipated market penetration of over 30% by 2033. The global market size is projected to reach $XX billion by the end of the forecast period in 2033, showcasing a robust compound annual growth rate (CAGR) of approximately 7.2% from the base year.
Leading Regions, Countries, or Segments in Full Body CT Scanners
North America currently dominates the Full Body CT Scanners market, driven by a strong healthcare infrastructure, high disposable incomes, and a proactive approach to adopting advanced medical technologies. The United States, in particular, is a leading market due to substantial investments in medical research and development, a high prevalence of target diseases, and the presence of major CT scanner manufacturers. The region’s focus on early disease detection and preventive healthcare further bolsters the demand for comprehensive diagnostic tools like full body CT scanners. The growing awareness among healthcare providers and patients about the benefits of whole-body screening for cancer and cardiovascular diseases contributes significantly to market leadership. Government initiatives and favorable reimbursement policies for advanced imaging procedures also play a crucial role in sustaining North America's dominance. The market in this region is projected to continue its expansion, reaching an estimated value of $XX billion by 2033.
Key Drivers for Dominance in North America:
- Investment Trends: Significant annual investment in healthcare infrastructure and technology, exceeding $XXX billion.
- Regulatory Support: Favorable regulatory frameworks and reimbursement policies for advanced imaging.
- Technological Adoption: High propensity to adopt new and innovative CT scanner technologies.
- Disease Prevalence: High incidence rates of oncology, cardiology, and neurological diseases.
- Awareness and Demand: Growing patient and physician awareness of full body CT benefits.
Application Segment Dominance:
While Oncology remains a primary driver, the Neurology segment is witnessing rapid growth due to an increasing aging population and a rise in neurological disorders. The demand for comprehensive stroke imaging, neurodegenerative disease diagnosis, and trauma assessment is accelerating the adoption of full body CT solutions in neurology.
Type Segment Dominance:
The Fixed Type CT Scanners segment holds a dominant position due to their superior image quality, advanced features, and higher throughput capabilities, essential for high-volume diagnostic centers and large hospital networks. However, the Mobile (Portable) Type segment is experiencing significant growth, driven by its versatility in emergency situations, intensive care units, and remote healthcare settings.
Full Body CT Scanners Product Innovations
Product innovation in the Full Body CT Scanners market is primarily focused on enhancing diagnostic accuracy, reducing patient radiation dose, and improving workflow efficiency. Manufacturers are integrating AI-powered algorithms for image reconstruction and noise reduction, leading to clearer images with less data. Advanced detector technologies, such as photon-counting detectors, are enabling unprecedented spectral imaging capabilities, allowing for better tissue characterization and differentiation. Furthermore, the development of lighter, more compact designs, including mobile CT scanners, is expanding their application reach into critical care environments and resource-limited settings. These innovations are crucial for applications in neurology for detailed brain imaging, oncology for precise tumor detection and staging, and cardiology for comprehensive cardiovascular assessments. Performance metrics like temporal resolution, spatial resolution, and dose reduction capabilities are continuously being improved, setting new industry benchmarks and offering unique selling propositions.
Propelling Factors for Full Body CT Scanners Growth
The Full Body CT Scanners market is propelled by a confluence of technological advancements, rising healthcare expenditures, and an increasing global burden of chronic diseases. The continuous innovation in CT imaging technology, including AI integration, dose reduction techniques, and spectral imaging, is enhancing diagnostic accuracy and patient safety. Growing awareness of the benefits of early disease detection and the increasing prevalence of conditions like cancer, cardiovascular diseases, and neurological disorders are creating a robust demand for comprehensive imaging solutions. Moreover, expanding healthcare infrastructure, particularly in emerging economies, coupled with favorable government policies and reimbursement schemes, is further accelerating market growth. The growing preference for minimally invasive procedures also necessitates precise pre-operative imaging, a role perfectly suited for advanced CT scanners, contributing to an estimated market growth of $XX billion in the forecast period.
Obstacles in the Full Body CT Scanners Market
Despite the promising growth trajectory, the Full Body CT Scanners market faces several obstacles. High initial acquisition costs and ongoing maintenance expenses can be a significant barrier for smaller healthcare facilities and in low-income regions. Stringent regulatory approvals and compliance requirements for advanced medical devices can delay market entry and increase development costs. Global supply chain disruptions, as witnessed in recent years, can impact the availability of essential components and lead to production delays. Intense competition among established players and emerging manufacturers also pressures profit margins and necessitates continuous investment in R&D. Furthermore, public perception and concerns regarding radiation exposure, although mitigated by technological advancements, can still influence patient and physician preferences, representing a significant hurdle with an estimated impact of over 10% on market adoption rates.
Future Opportunities in Full Body CT Scanners
The Full Body CT Scanners market is ripe with future opportunities. The integration of AI and machine learning for automated image analysis, predictive diagnostics, and personalized treatment planning presents a significant avenue for growth. The increasing demand for mobile and portable CT scanners in emergency care, disaster relief, and remote healthcare settings offers substantial market potential. Furthermore, the expansion of CT imaging into new application areas, such as precision medicine and early detection of rare diseases, is expected to drive market expansion. Emerging economies with rapidly developing healthcare infrastructure represent untapped markets for full body CT solutions. The growing trend of value-based healthcare also emphasizes the need for efficient and cost-effective diagnostic tools, positioning full body CT scanners favorably. The market is projected to witness an expansion of over $XX billion in new market opportunities by 2033.
Major Players in the Full Body CT Scanners Ecosystem
- GE Healthcare
- Philips Healthcare
- NeuroLogica (Samsung)
- Siemens
- MinFound Medical Systems Co
- Toshiba
- Hitachi
- Shimadzu
- Canon
- Neusoft
- SinoVision
- SternMed GmbH
- Shenzhen Anke Hi-Tech Co
Key Developments in Full Body CT Scanners Industry
- January 2024: GE Healthcare launches a new AI-powered CT scanner for enhanced oncology imaging.
- November 2023: Philips Healthcare receives FDA clearance for its next-generation portable CT scanner.
- August 2023: Siemens Healthineers announces a strategic partnership to expand its footprint in the Asia-Pacific region.
- May 2023: NeuroLogica (Samsung) introduces a compact CT scanner designed for emergency room use.
- February 2023: MinFound Medical Systems Co unveils a new spectral CT scanner with advanced diagnostic capabilities.
- October 2022: Toshiba Medical Systems (now part of Canon Medical Systems) showcases advancements in low-dose CT technology.
- June 2022: Hitachi develops innovative CT reconstruction algorithms for improved image quality.
- March 2022: Canon Medical Systems completes the acquisition of a major imaging solutions provider, strengthening its market position.
- December 2021: SternMed GmbH introduces a cost-effective full body CT solution for developing markets.
- September 2021: Shenzhen Anke Hi-Tech Co expands its R&D facility to focus on next-generation CT imaging.
- July 2020: Neusoft Medical Systems announces a significant order for its CT scanners from a leading hospital group.
- April 2020: SinoVision launches a new mobile CT scanner for rapid deployment in outbreak scenarios.
Strategic Full Body CT Scanners Market Forecast
The strategic outlook for the Full Body CT Scanners market is overwhelmingly positive, driven by sustained technological innovation and a growing global demand for advanced medical diagnostics. The forecast period (2025-2033) is expected to witness significant market expansion, fueled by the increasing adoption of AI-powered solutions, the development of photon-counting detector technology, and the growing need for comprehensive screening in oncology, cardiology, and neurology. The burgeoning demand in emerging economies and the continued push for early disease detection will act as powerful growth catalysts. Emerging opportunities in personalized medicine and point-of-care diagnostics further enhance the market's potential, projecting a robust CAGR and a market size exceeding $XX billion by 2033.
Full Body CT Scanners Segmentation
-
1. Application
- 1.1. Neurology
- 1.2. Oncology
- 1.3. Cardiology
- 1.4. Orthopedic Surgery
- 1.5. Others (e.g. veterinary)
-
2. Types
- 2.1. Mobile (Portable) Type
- 2.2. Fixed Type
Full Body CT Scanners Segmentation By Geography
-
1. North America
- 1.1. United States
- 1.2. Canada
- 1.3. Mexico
-
2. South America
- 2.1. Brazil
- 2.2. Argentina
- 2.3. Rest of South America
-
3. Europe
- 3.1. United Kingdom
- 3.2. Germany
- 3.3. France
- 3.4. Italy
- 3.5. Spain
- 3.6. Russia
- 3.7. Benelux
- 3.8. Nordics
- 3.9. Rest of Europe
-
4. Middle East & Africa
- 4.1. Turkey
- 4.2. Israel
- 4.3. GCC
- 4.4. North Africa
- 4.5. South Africa
- 4.6. Rest of Middle East & Africa
-
5. Asia Pacific
- 5.1. China
- 5.2. India
- 5.3. Japan
- 5.4. South Korea
- 5.5. ASEAN
- 5.6. Oceania
- 5.7. Rest of Asia Pacific
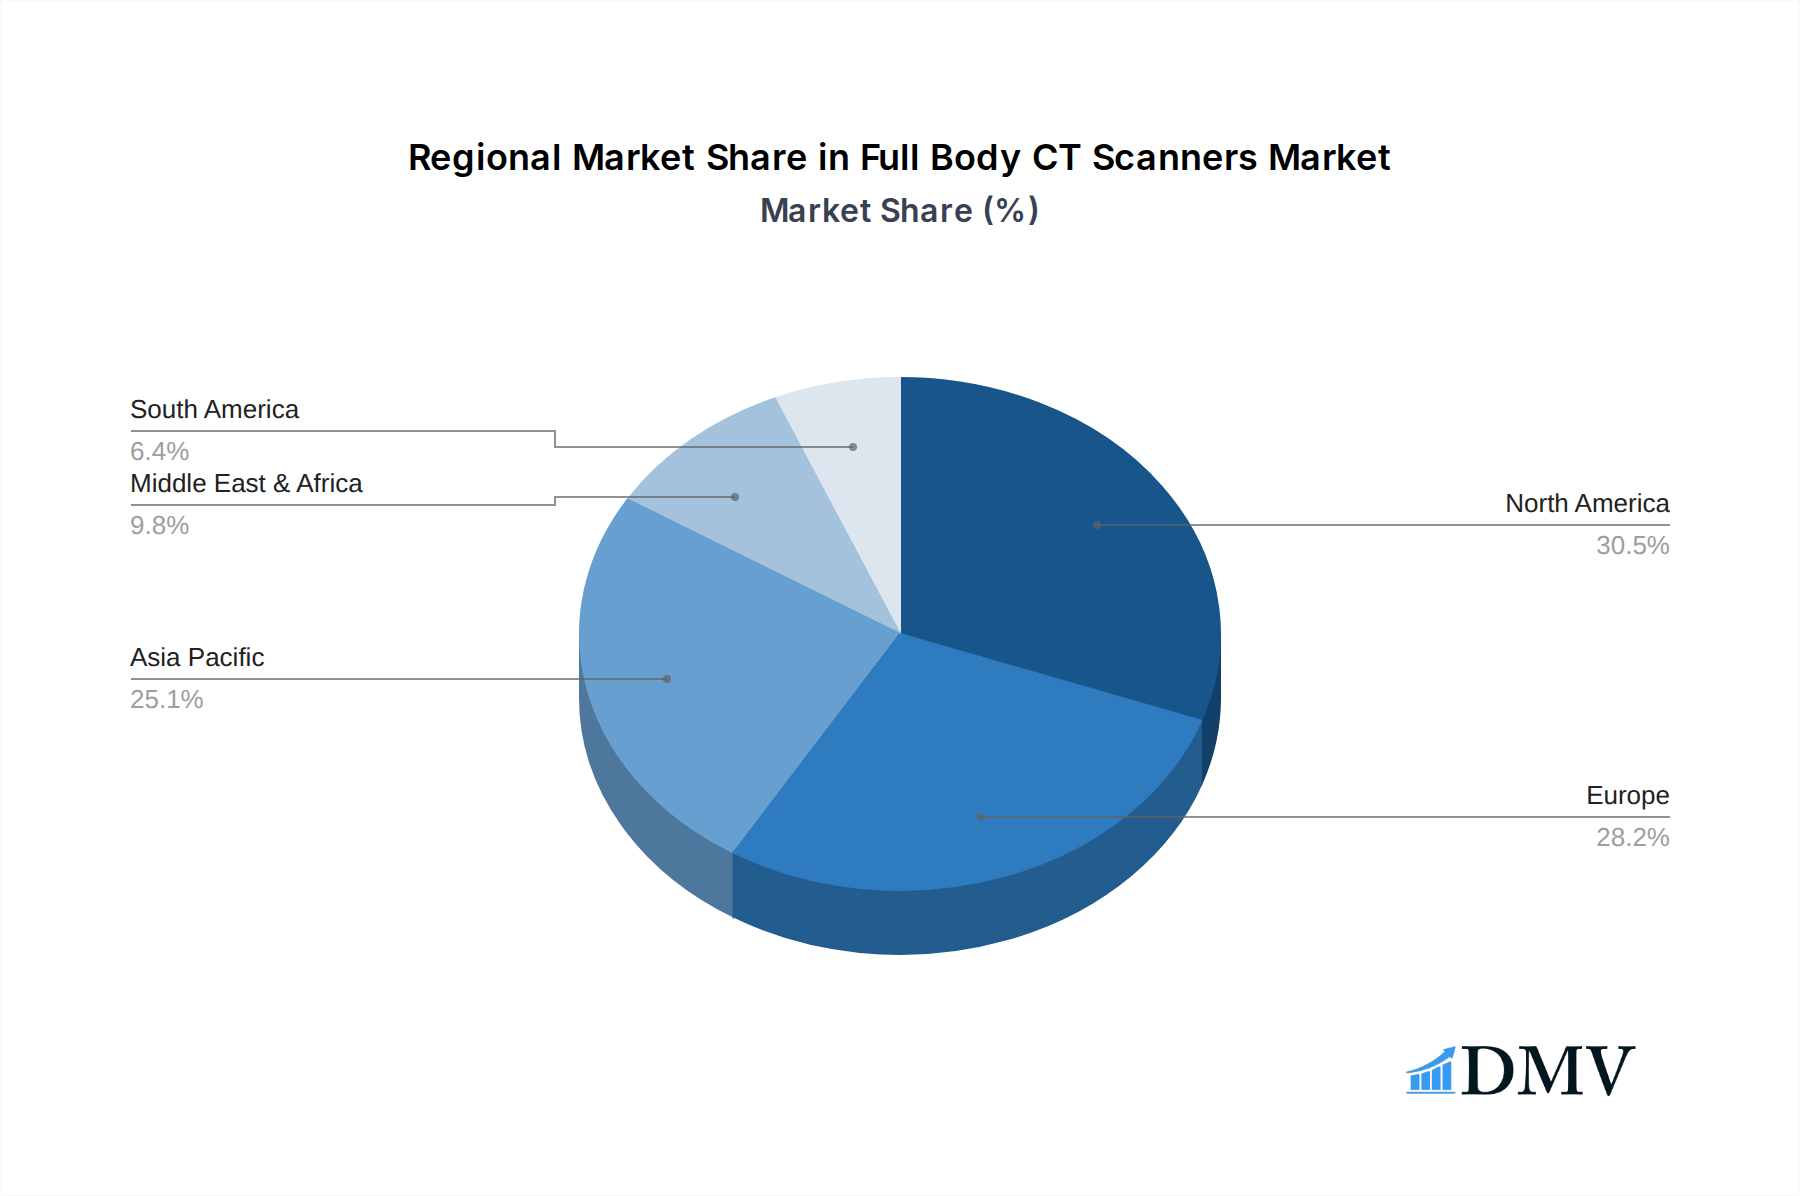
Full Body CT Scanners Regional Market Share
Geographic Coverage of Full Body CT Scanners
Full Body CT Scanners REPORT HIGHLIGHTS
| Aspects | Details |
|---|---|
| Study Period | 2020-2034 |
| Base Year | 2025 |
| Estimated Year | 2026 |
| Forecast Period | 2026-2034 |
| Historical Period | 2020-2025 |
| Growth Rate | CAGR of 9.19% from 2020-2034 |
| Segmentation |
|
Table of Contents
- 1. Introduction
- 1.1. Research Scope
- 1.2. Market Segmentation
- 1.3. Research Objective
- 1.4. Definitions and Assumptions
- 2. Executive Summary
- 2.1. Market Snapshot
- 3. Market Dynamics
- 3.1. Market Drivers
- 3.2. Market Restrains
- 3.3. Market Trends
- 3.4. Market Opportunities
- 4. Market Factor Analysis
- 4.1. Porters Five Forces
- 4.1.1. Bargaining Power of Suppliers
- 4.1.2. Bargaining Power of Buyers
- 4.1.3. Threat of New Entrants
- 4.1.4. Threat of Substitutes
- 4.1.5. Competitive Rivalry
- 4.2. PESTEL analysis
- 4.3. BCG Analysis
- 4.3.1. Stars (High Growth, High Market Share)
- 4.3.2. Cash Cows (Low Growth, High Market Share)
- 4.3.3. Question Mark (High Growth, Low Market Share)
- 4.3.4. Dogs (Low Growth, Low Market Share)
- 4.4. Ansoff Matrix Analysis
- 4.5. Supply Chain Analysis
- 4.6. Regulatory Landscape
- 4.7. Current Market Potential and Opportunity Assessment (TAM–SAM–SOM Framework)
- 4.8. DMV Analyst Note
- 4.1. Porters Five Forces
- 5. Market Analysis, Insights and Forecast 2021-2033
- 5.1. Market Analysis, Insights and Forecast - by Application
- 5.1.1. Neurology
- 5.1.2. Oncology
- 5.1.3. Cardiology
- 5.1.4. Orthopedic Surgery
- 5.1.5. Others (e.g. veterinary)
- 5.2. Market Analysis, Insights and Forecast - by Types
- 5.2.1. Mobile (Portable) Type
- 5.2.2. Fixed Type
- 5.3. Market Analysis, Insights and Forecast - by Region
- 5.3.1. North America
- 5.3.2. South America
- 5.3.3. Europe
- 5.3.4. Middle East & Africa
- 5.3.5. Asia Pacific
- 5.1. Market Analysis, Insights and Forecast - by Application
- 6. Global Full Body CT Scanners Analysis, Insights and Forecast, 2021-2033
- 6.1. Market Analysis, Insights and Forecast - by Application
- 6.1.1. Neurology
- 6.1.2. Oncology
- 6.1.3. Cardiology
- 6.1.4. Orthopedic Surgery
- 6.1.5. Others (e.g. veterinary)
- 6.2. Market Analysis, Insights and Forecast - by Types
- 6.2.1. Mobile (Portable) Type
- 6.2.2. Fixed Type
- 6.1. Market Analysis, Insights and Forecast - by Application
- 7. North America Full Body CT Scanners Analysis, Insights and Forecast, 2020-2032
- 7.1. Market Analysis, Insights and Forecast - by Application
- 7.1.1. Neurology
- 7.1.2. Oncology
- 7.1.3. Cardiology
- 7.1.4. Orthopedic Surgery
- 7.1.5. Others (e.g. veterinary)
- 7.2. Market Analysis, Insights and Forecast - by Types
- 7.2.1. Mobile (Portable) Type
- 7.2.2. Fixed Type
- 7.1. Market Analysis, Insights and Forecast - by Application
- 8. South America Full Body CT Scanners Analysis, Insights and Forecast, 2020-2032
- 8.1. Market Analysis, Insights and Forecast - by Application
- 8.1.1. Neurology
- 8.1.2. Oncology
- 8.1.3. Cardiology
- 8.1.4. Orthopedic Surgery
- 8.1.5. Others (e.g. veterinary)
- 8.2. Market Analysis, Insights and Forecast - by Types
- 8.2.1. Mobile (Portable) Type
- 8.2.2. Fixed Type
- 8.1. Market Analysis, Insights and Forecast - by Application
- 9. Europe Full Body CT Scanners Analysis, Insights and Forecast, 2020-2032
- 9.1. Market Analysis, Insights and Forecast - by Application
- 9.1.1. Neurology
- 9.1.2. Oncology
- 9.1.3. Cardiology
- 9.1.4. Orthopedic Surgery
- 9.1.5. Others (e.g. veterinary)
- 9.2. Market Analysis, Insights and Forecast - by Types
- 9.2.1. Mobile (Portable) Type
- 9.2.2. Fixed Type
- 9.1. Market Analysis, Insights and Forecast - by Application
- 10. Middle East & Africa Full Body CT Scanners Analysis, Insights and Forecast, 2020-2032
- 10.1. Market Analysis, Insights and Forecast - by Application
- 10.1.1. Neurology
- 10.1.2. Oncology
- 10.1.3. Cardiology
- 10.1.4. Orthopedic Surgery
- 10.1.5. Others (e.g. veterinary)
- 10.2. Market Analysis, Insights and Forecast - by Types
- 10.2.1. Mobile (Portable) Type
- 10.2.2. Fixed Type
- 10.1. Market Analysis, Insights and Forecast - by Application
- 11. Asia Pacific Full Body CT Scanners Analysis, Insights and Forecast, 2020-2032
- 11.1. Market Analysis, Insights and Forecast - by Application
- 11.1.1. Neurology
- 11.1.2. Oncology
- 11.1.3. Cardiology
- 11.1.4. Orthopedic Surgery
- 11.1.5. Others (e.g. veterinary)
- 11.2. Market Analysis, Insights and Forecast - by Types
- 11.2.1. Mobile (Portable) Type
- 11.2.2. Fixed Type
- 11.1. Market Analysis, Insights and Forecast - by Application
- 12. Competitive Analysis
- 12.1. Company Profiles
- 12.1.1 GE Healthcare
- 12.1.1.1. Company Overview
- 12.1.1.2. Products
- 12.1.1.3. Company Financials
- 12.1.1.4. SWOT Analysis
- 12.1.2 Philips Healthcare
- 12.1.2.1. Company Overview
- 12.1.2.2. Products
- 12.1.2.3. Company Financials
- 12.1.2.4. SWOT Analysis
- 12.1.3 NeuroLogica (Samsung)
- 12.1.3.1. Company Overview
- 12.1.3.2. Products
- 12.1.3.3. Company Financials
- 12.1.3.4. SWOT Analysis
- 12.1.4 Siemens
- 12.1.4.1. Company Overview
- 12.1.4.2. Products
- 12.1.4.3. Company Financials
- 12.1.4.4. SWOT Analysis
- 12.1.5 MinFound Medical Systems Co
- 12.1.5.1. Company Overview
- 12.1.5.2. Products
- 12.1.5.3. Company Financials
- 12.1.5.4. SWOT Analysis
- 12.1.6 Toshiba
- 12.1.6.1. Company Overview
- 12.1.6.2. Products
- 12.1.6.3. Company Financials
- 12.1.6.4. SWOT Analysis
- 12.1.7 Hitachi
- 12.1.7.1. Company Overview
- 12.1.7.2. Products
- 12.1.7.3. Company Financials
- 12.1.7.4. SWOT Analysis
- 12.1.8 Shimadzu
- 12.1.8.1. Company Overview
- 12.1.8.2. Products
- 12.1.8.3. Company Financials
- 12.1.8.4. SWOT Analysis
- 12.1.9 Canon
- 12.1.9.1. Company Overview
- 12.1.9.2. Products
- 12.1.9.3. Company Financials
- 12.1.9.4. SWOT Analysis
- 12.1.10 Neusoft
- 12.1.10.1. Company Overview
- 12.1.10.2. Products
- 12.1.10.3. Company Financials
- 12.1.10.4. SWOT Analysis
- 12.1.11 SinoVision
- 12.1.11.1. Company Overview
- 12.1.11.2. Products
- 12.1.11.3. Company Financials
- 12.1.11.4. SWOT Analysis
- 12.1.12 SternMed GmbH
- 12.1.12.1. Company Overview
- 12.1.12.2. Products
- 12.1.12.3. Company Financials
- 12.1.12.4. SWOT Analysis
- 12.1.13 Shenzhen Anke Hi-Tech Co
- 12.1.13.1. Company Overview
- 12.1.13.2. Products
- 12.1.13.3. Company Financials
- 12.1.13.4. SWOT Analysis
- 12.1.1 GE Healthcare
- 12.2. Market Entropy
- 12.2.1 Company's Key Areas Served
- 12.2.2 Recent Developments
- 12.3. Company Market Share Analysis 2025
- 12.3.1 Top 5 Companies Market Share Analysis
- 12.3.2 Top 3 Companies Market Share Analysis
- 12.4. List of Potential Customers
- 13. Research Methodology
List of Figures
- Figure 1: Global Full Body CT Scanners Revenue Breakdown (billion, %) by Region 2025 & 2033
- Figure 2: Global Full Body CT Scanners Volume Breakdown (K, %) by Region 2025 & 2033
- Figure 3: North America Full Body CT Scanners Revenue (billion), by Application 2025 & 2033
- Figure 4: North America Full Body CT Scanners Volume (K), by Application 2025 & 2033
- Figure 5: North America Full Body CT Scanners Revenue Share (%), by Application 2025 & 2033
- Figure 6: North America Full Body CT Scanners Volume Share (%), by Application 2025 & 2033
- Figure 7: North America Full Body CT Scanners Revenue (billion), by Types 2025 & 2033
- Figure 8: North America Full Body CT Scanners Volume (K), by Types 2025 & 2033
- Figure 9: North America Full Body CT Scanners Revenue Share (%), by Types 2025 & 2033
- Figure 10: North America Full Body CT Scanners Volume Share (%), by Types 2025 & 2033
- Figure 11: North America Full Body CT Scanners Revenue (billion), by Country 2025 & 2033
- Figure 12: North America Full Body CT Scanners Volume (K), by Country 2025 & 2033
- Figure 13: North America Full Body CT Scanners Revenue Share (%), by Country 2025 & 2033
- Figure 14: North America Full Body CT Scanners Volume Share (%), by Country 2025 & 2033
- Figure 15: South America Full Body CT Scanners Revenue (billion), by Application 2025 & 2033
- Figure 16: South America Full Body CT Scanners Volume (K), by Application 2025 & 2033
- Figure 17: South America Full Body CT Scanners Revenue Share (%), by Application 2025 & 2033
- Figure 18: South America Full Body CT Scanners Volume Share (%), by Application 2025 & 2033
- Figure 19: South America Full Body CT Scanners Revenue (billion), by Types 2025 & 2033
- Figure 20: South America Full Body CT Scanners Volume (K), by Types 2025 & 2033
- Figure 21: South America Full Body CT Scanners Revenue Share (%), by Types 2025 & 2033
- Figure 22: South America Full Body CT Scanners Volume Share (%), by Types 2025 & 2033
- Figure 23: South America Full Body CT Scanners Revenue (billion), by Country 2025 & 2033
- Figure 24: South America Full Body CT Scanners Volume (K), by Country 2025 & 2033
- Figure 25: South America Full Body CT Scanners Revenue Share (%), by Country 2025 & 2033
- Figure 26: South America Full Body CT Scanners Volume Share (%), by Country 2025 & 2033
- Figure 27: Europe Full Body CT Scanners Revenue (billion), by Application 2025 & 2033
- Figure 28: Europe Full Body CT Scanners Volume (K), by Application 2025 & 2033
- Figure 29: Europe Full Body CT Scanners Revenue Share (%), by Application 2025 & 2033
- Figure 30: Europe Full Body CT Scanners Volume Share (%), by Application 2025 & 2033
- Figure 31: Europe Full Body CT Scanners Revenue (billion), by Types 2025 & 2033
- Figure 32: Europe Full Body CT Scanners Volume (K), by Types 2025 & 2033
- Figure 33: Europe Full Body CT Scanners Revenue Share (%), by Types 2025 & 2033
- Figure 34: Europe Full Body CT Scanners Volume Share (%), by Types 2025 & 2033
- Figure 35: Europe Full Body CT Scanners Revenue (billion), by Country 2025 & 2033
- Figure 36: Europe Full Body CT Scanners Volume (K), by Country 2025 & 2033
- Figure 37: Europe Full Body CT Scanners Revenue Share (%), by Country 2025 & 2033
- Figure 38: Europe Full Body CT Scanners Volume Share (%), by Country 2025 & 2033
- Figure 39: Middle East & Africa Full Body CT Scanners Revenue (billion), by Application 2025 & 2033
- Figure 40: Middle East & Africa Full Body CT Scanners Volume (K), by Application 2025 & 2033
- Figure 41: Middle East & Africa Full Body CT Scanners Revenue Share (%), by Application 2025 & 2033
- Figure 42: Middle East & Africa Full Body CT Scanners Volume Share (%), by Application 2025 & 2033
- Figure 43: Middle East & Africa Full Body CT Scanners Revenue (billion), by Types 2025 & 2033
- Figure 44: Middle East & Africa Full Body CT Scanners Volume (K), by Types 2025 & 2033
- Figure 45: Middle East & Africa Full Body CT Scanners Revenue Share (%), by Types 2025 & 2033
- Figure 46: Middle East & Africa Full Body CT Scanners Volume Share (%), by Types 2025 & 2033
- Figure 47: Middle East & Africa Full Body CT Scanners Revenue (billion), by Country 2025 & 2033
- Figure 48: Middle East & Africa Full Body CT Scanners Volume (K), by Country 2025 & 2033
- Figure 49: Middle East & Africa Full Body CT Scanners Revenue Share (%), by Country 2025 & 2033
- Figure 50: Middle East & Africa Full Body CT Scanners Volume Share (%), by Country 2025 & 2033
- Figure 51: Asia Pacific Full Body CT Scanners Revenue (billion), by Application 2025 & 2033
- Figure 52: Asia Pacific Full Body CT Scanners Volume (K), by Application 2025 & 2033
- Figure 53: Asia Pacific Full Body CT Scanners Revenue Share (%), by Application 2025 & 2033
- Figure 54: Asia Pacific Full Body CT Scanners Volume Share (%), by Application 2025 & 2033
- Figure 55: Asia Pacific Full Body CT Scanners Revenue (billion), by Types 2025 & 2033
- Figure 56: Asia Pacific Full Body CT Scanners Volume (K), by Types 2025 & 2033
- Figure 57: Asia Pacific Full Body CT Scanners Revenue Share (%), by Types 2025 & 2033
- Figure 58: Asia Pacific Full Body CT Scanners Volume Share (%), by Types 2025 & 2033
- Figure 59: Asia Pacific Full Body CT Scanners Revenue (billion), by Country 2025 & 2033
- Figure 60: Asia Pacific Full Body CT Scanners Volume (K), by Country 2025 & 2033
- Figure 61: Asia Pacific Full Body CT Scanners Revenue Share (%), by Country 2025 & 2033
- Figure 62: Asia Pacific Full Body CT Scanners Volume Share (%), by Country 2025 & 2033
List of Tables
- Table 1: Global Full Body CT Scanners Revenue billion Forecast, by Application 2020 & 2033
- Table 2: Global Full Body CT Scanners Volume K Forecast, by Application 2020 & 2033
- Table 3: Global Full Body CT Scanners Revenue billion Forecast, by Types 2020 & 2033
- Table 4: Global Full Body CT Scanners Volume K Forecast, by Types 2020 & 2033
- Table 5: Global Full Body CT Scanners Revenue billion Forecast, by Region 2020 & 2033
- Table 6: Global Full Body CT Scanners Volume K Forecast, by Region 2020 & 2033
- Table 7: Global Full Body CT Scanners Revenue billion Forecast, by Application 2020 & 2033
- Table 8: Global Full Body CT Scanners Volume K Forecast, by Application 2020 & 2033
- Table 9: Global Full Body CT Scanners Revenue billion Forecast, by Types 2020 & 2033
- Table 10: Global Full Body CT Scanners Volume K Forecast, by Types 2020 & 2033
- Table 11: Global Full Body CT Scanners Revenue billion Forecast, by Country 2020 & 2033
- Table 12: Global Full Body CT Scanners Volume K Forecast, by Country 2020 & 2033
- Table 13: United States Full Body CT Scanners Revenue (billion) Forecast, by Application 2020 & 2033
- Table 14: United States Full Body CT Scanners Volume (K) Forecast, by Application 2020 & 2033
- Table 15: Canada Full Body CT Scanners Revenue (billion) Forecast, by Application 2020 & 2033
- Table 16: Canada Full Body CT Scanners Volume (K) Forecast, by Application 2020 & 2033
- Table 17: Mexico Full Body CT Scanners Revenue (billion) Forecast, by Application 2020 & 2033
- Table 18: Mexico Full Body CT Scanners Volume (K) Forecast, by Application 2020 & 2033
- Table 19: Global Full Body CT Scanners Revenue billion Forecast, by Application 2020 & 2033
- Table 20: Global Full Body CT Scanners Volume K Forecast, by Application 2020 & 2033
- Table 21: Global Full Body CT Scanners Revenue billion Forecast, by Types 2020 & 2033
- Table 22: Global Full Body CT Scanners Volume K Forecast, by Types 2020 & 2033
- Table 23: Global Full Body CT Scanners Revenue billion Forecast, by Country 2020 & 2033
- Table 24: Global Full Body CT Scanners Volume K Forecast, by Country 2020 & 2033
- Table 25: Brazil Full Body CT Scanners Revenue (billion) Forecast, by Application 2020 & 2033
- Table 26: Brazil Full Body CT Scanners Volume (K) Forecast, by Application 2020 & 2033
- Table 27: Argentina Full Body CT Scanners Revenue (billion) Forecast, by Application 2020 & 2033
- Table 28: Argentina Full Body CT Scanners Volume (K) Forecast, by Application 2020 & 2033
- Table 29: Rest of South America Full Body CT Scanners Revenue (billion) Forecast, by Application 2020 & 2033
- Table 30: Rest of South America Full Body CT Scanners Volume (K) Forecast, by Application 2020 & 2033
- Table 31: Global Full Body CT Scanners Revenue billion Forecast, by Application 2020 & 2033
- Table 32: Global Full Body CT Scanners Volume K Forecast, by Application 2020 & 2033
- Table 33: Global Full Body CT Scanners Revenue billion Forecast, by Types 2020 & 2033
- Table 34: Global Full Body CT Scanners Volume K Forecast, by Types 2020 & 2033
- Table 35: Global Full Body CT Scanners Revenue billion Forecast, by Country 2020 & 2033
- Table 36: Global Full Body CT Scanners Volume K Forecast, by Country 2020 & 2033
- Table 37: United Kingdom Full Body CT Scanners Revenue (billion) Forecast, by Application 2020 & 2033
- Table 38: United Kingdom Full Body CT Scanners Volume (K) Forecast, by Application 2020 & 2033
- Table 39: Germany Full Body CT Scanners Revenue (billion) Forecast, by Application 2020 & 2033
- Table 40: Germany Full Body CT Scanners Volume (K) Forecast, by Application 2020 & 2033
- Table 41: France Full Body CT Scanners Revenue (billion) Forecast, by Application 2020 & 2033
- Table 42: France Full Body CT Scanners Volume (K) Forecast, by Application 2020 & 2033
- Table 43: Italy Full Body CT Scanners Revenue (billion) Forecast, by Application 2020 & 2033
- Table 44: Italy Full Body CT Scanners Volume (K) Forecast, by Application 2020 & 2033
- Table 45: Spain Full Body CT Scanners Revenue (billion) Forecast, by Application 2020 & 2033
- Table 46: Spain Full Body CT Scanners Volume (K) Forecast, by Application 2020 & 2033
- Table 47: Russia Full Body CT Scanners Revenue (billion) Forecast, by Application 2020 & 2033
- Table 48: Russia Full Body CT Scanners Volume (K) Forecast, by Application 2020 & 2033
- Table 49: Benelux Full Body CT Scanners Revenue (billion) Forecast, by Application 2020 & 2033
- Table 50: Benelux Full Body CT Scanners Volume (K) Forecast, by Application 2020 & 2033
- Table 51: Nordics Full Body CT Scanners Revenue (billion) Forecast, by Application 2020 & 2033
- Table 52: Nordics Full Body CT Scanners Volume (K) Forecast, by Application 2020 & 2033
- Table 53: Rest of Europe Full Body CT Scanners Revenue (billion) Forecast, by Application 2020 & 2033
- Table 54: Rest of Europe Full Body CT Scanners Volume (K) Forecast, by Application 2020 & 2033
- Table 55: Global Full Body CT Scanners Revenue billion Forecast, by Application 2020 & 2033
- Table 56: Global Full Body CT Scanners Volume K Forecast, by Application 2020 & 2033
- Table 57: Global Full Body CT Scanners Revenue billion Forecast, by Types 2020 & 2033
- Table 58: Global Full Body CT Scanners Volume K Forecast, by Types 2020 & 2033
- Table 59: Global Full Body CT Scanners Revenue billion Forecast, by Country 2020 & 2033
- Table 60: Global Full Body CT Scanners Volume K Forecast, by Country 2020 & 2033
- Table 61: Turkey Full Body CT Scanners Revenue (billion) Forecast, by Application 2020 & 2033
- Table 62: Turkey Full Body CT Scanners Volume (K) Forecast, by Application 2020 & 2033
- Table 63: Israel Full Body CT Scanners Revenue (billion) Forecast, by Application 2020 & 2033
- Table 64: Israel Full Body CT Scanners Volume (K) Forecast, by Application 2020 & 2033
- Table 65: GCC Full Body CT Scanners Revenue (billion) Forecast, by Application 2020 & 2033
- Table 66: GCC Full Body CT Scanners Volume (K) Forecast, by Application 2020 & 2033
- Table 67: North Africa Full Body CT Scanners Revenue (billion) Forecast, by Application 2020 & 2033
- Table 68: North Africa Full Body CT Scanners Volume (K) Forecast, by Application 2020 & 2033
- Table 69: South Africa Full Body CT Scanners Revenue (billion) Forecast, by Application 2020 & 2033
- Table 70: South Africa Full Body CT Scanners Volume (K) Forecast, by Application 2020 & 2033
- Table 71: Rest of Middle East & Africa Full Body CT Scanners Revenue (billion) Forecast, by Application 2020 & 2033
- Table 72: Rest of Middle East & Africa Full Body CT Scanners Volume (K) Forecast, by Application 2020 & 2033
- Table 73: Global Full Body CT Scanners Revenue billion Forecast, by Application 2020 & 2033
- Table 74: Global Full Body CT Scanners Volume K Forecast, by Application 2020 & 2033
- Table 75: Global Full Body CT Scanners Revenue billion Forecast, by Types 2020 & 2033
- Table 76: Global Full Body CT Scanners Volume K Forecast, by Types 2020 & 2033
- Table 77: Global Full Body CT Scanners Revenue billion Forecast, by Country 2020 & 2033
- Table 78: Global Full Body CT Scanners Volume K Forecast, by Country 2020 & 2033
- Table 79: China Full Body CT Scanners Revenue (billion) Forecast, by Application 2020 & 2033
- Table 80: China Full Body CT Scanners Volume (K) Forecast, by Application 2020 & 2033
- Table 81: India Full Body CT Scanners Revenue (billion) Forecast, by Application 2020 & 2033
- Table 82: India Full Body CT Scanners Volume (K) Forecast, by Application 2020 & 2033
- Table 83: Japan Full Body CT Scanners Revenue (billion) Forecast, by Application 2020 & 2033
- Table 84: Japan Full Body CT Scanners Volume (K) Forecast, by Application 2020 & 2033
- Table 85: South Korea Full Body CT Scanners Revenue (billion) Forecast, by Application 2020 & 2033
- Table 86: South Korea Full Body CT Scanners Volume (K) Forecast, by Application 2020 & 2033
- Table 87: ASEAN Full Body CT Scanners Revenue (billion) Forecast, by Application 2020 & 2033
- Table 88: ASEAN Full Body CT Scanners Volume (K) Forecast, by Application 2020 & 2033
- Table 89: Oceania Full Body CT Scanners Revenue (billion) Forecast, by Application 2020 & 2033
- Table 90: Oceania Full Body CT Scanners Volume (K) Forecast, by Application 2020 & 2033
- Table 91: Rest of Asia Pacific Full Body CT Scanners Revenue (billion) Forecast, by Application 2020 & 2033
- Table 92: Rest of Asia Pacific Full Body CT Scanners Volume (K) Forecast, by Application 2020 & 2033
Frequently Asked Questions
1. What is the projected Compound Annual Growth Rate (CAGR) of the Full Body CT Scanners?
The projected CAGR is approximately 9.19%.
2. Which companies are prominent players in the Full Body CT Scanners?
Key companies in the market include GE Healthcare, Philips Healthcare, NeuroLogica (Samsung), Siemens, MinFound Medical Systems Co, Toshiba, Hitachi, Shimadzu, Canon, Neusoft, SinoVision, SternMed GmbH, Shenzhen Anke Hi-Tech Co.
3. What are the main segments of the Full Body CT Scanners?
The market segments include Application, Types.
4. Can you provide details about the market size?
The market size is estimated to be USD 13.42 billion as of 2022.
5. What are some drivers contributing to market growth?
N/A
6. What are the notable trends driving market growth?
N/A
7. Are there any restraints impacting market growth?
N/A
8. Can you provide examples of recent developments in the market?
N/A
9. What pricing options are available for accessing the report?
Pricing options include single-user, multi-user, and enterprise licenses priced at USD 3350.00, USD 5025.00, and USD 6700.00 respectively.
10. Is the market size provided in terms of value or volume?
The market size is provided in terms of value, measured in billion and volume, measured in K.
11. Are there any specific market keywords associated with the report?
Yes, the market keyword associated with the report is "Full Body CT Scanners," which aids in identifying and referencing the specific market segment covered.
12. How do I determine which pricing option suits my needs best?
The pricing options vary based on user requirements and access needs. Individual users may opt for single-user licenses, while businesses requiring broader access may choose multi-user or enterprise licenses for cost-effective access to the report.
13. Are there any additional resources or data provided in the Full Body CT Scanners report?
While the report offers comprehensive insights, it's advisable to review the specific contents or supplementary materials provided to ascertain if additional resources or data are available.
14. How can I stay updated on further developments or reports in the Full Body CT Scanners?
To stay informed about further developments, trends, and reports in the Full Body CT Scanners, consider subscribing to industry newsletters, following relevant companies and organizations, or regularly checking reputable industry news sources and publications.
Methodology
Step 1 - Identification of Relevant Samples Size from Population Database


Step 2 - Approaches for Defining Global Market Size (Value, Volume* & Price*)

Note*: In applicable scenarios
Step 3 - Data Sources
Primary Research
- Web Analytics
- Survey Reports
- Research Institute
- Latest Research Reports
- Opinion Leaders
Secondary Research
- Annual Reports
- White Paper
- Latest Press Release
- Industry Association
- Paid Database
- Investor Presentations

Step 4 - Data Triangulation
Involves using different sources of information in order to increase the validity of a study
These sources are likely to be stakeholders in a program - participants, other researchers, program staff, other community members, and so on.
Then we put all data in single framework & apply various statistical tools to find out the dynamic on the market.
During the analysis stage, feedback from the stakeholder groups would be compared to determine areas of agreement as well as areas of divergence