

Key Insights
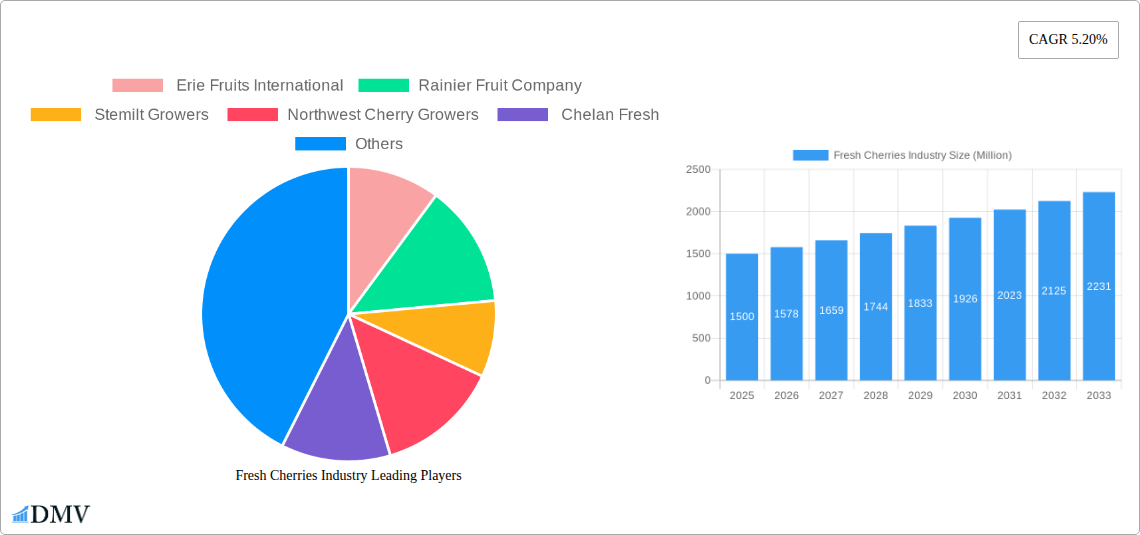
The global fresh cherries market, valued at approximately $XX million in 2025, is projected to experience robust growth, exhibiting a compound annual growth rate (CAGR) of 5.20% from 2025 to 2033. This growth is driven by several key factors. Increasing consumer demand for healthy and convenient snack options fuels the popularity of fresh cherries, particularly among health-conscious individuals. The rising disposable incomes in developing economies, coupled with increased awareness of the nutritional benefits of cherries (rich in antioxidants and vitamins), are expanding the market's consumer base. Furthermore, innovative product offerings, such as cherry-infused beverages and ready-to-eat cherry snacks, are diversifying the market and attracting new customers. The growth is further supported by advancements in cherry cultivation techniques resulting in higher yields and improved quality. However, factors like seasonal availability, susceptibility to spoilage, and price fluctuations pose challenges to consistent market growth. The dominance of certain regions, like North America, presents both an opportunity and a challenge – creating avenues for expansion in other regions while simultaneously facing competition from established players. The segmentation of the market, encompassing various cherry types (Bing, Rainier, Royal Ann, Montmorency) and distribution channels (supermarkets, hypermarkets, e-commerce), provides opportunities for targeted marketing and strategic expansion within specific niches.
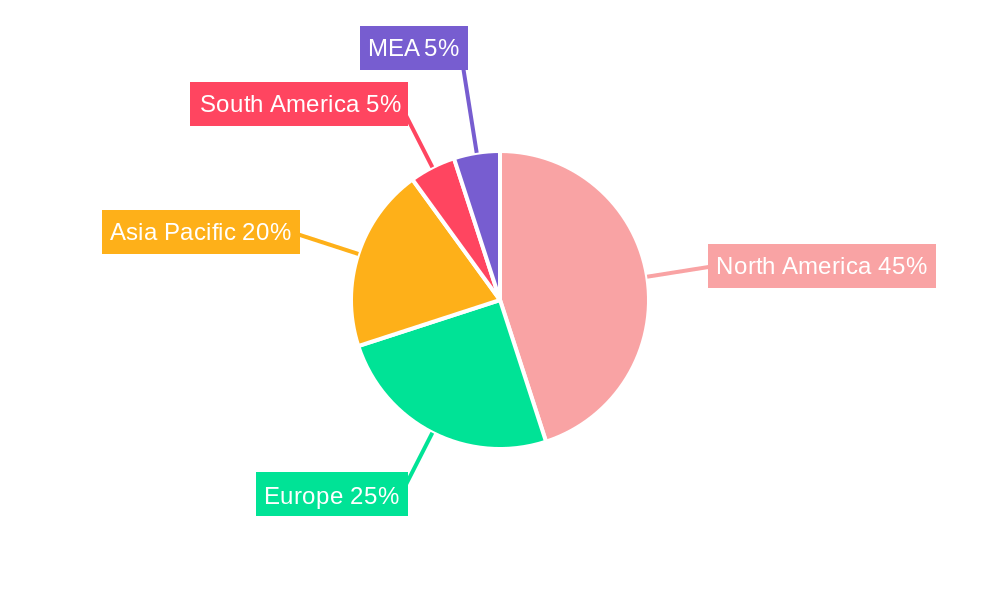
The market's geographical distribution showcases varying levels of development. North America, particularly the United States, currently holds a significant market share due to established production and consumption patterns. However, emerging markets in Asia-Pacific, driven by rising incomes and changing dietary preferences, are exhibiting substantial growth potential. Europe, while a mature market, continues to demonstrate steady growth, driven by consistent demand and innovative product development within the fresh cherry sector. Players like Erie Fruits International, Rainier Fruit Company, Stemilt Growers, Northwest Cherry Growers, and Chelan Fresh are key contributors to the market’s dynamics, constantly innovating to meet the evolving needs of consumers and expand their reach globally. Future market growth will depend on addressing the challenges related to maintaining consistent supply throughout the year, reducing post-harvest losses, and effectively targeting consumers in various geographic regions.
Fresh Cherries Industry: A Comprehensive Market Report (2019-2033)
This insightful report provides a detailed analysis of the global fresh cherries industry, encompassing market size, growth trends, key players, and future projections from 2019 to 2033. With a focus on key segments like Bing, Rainier, Royal Ann, and Montmorency cherries, across fresh and processed applications and various distribution channels (supermarkets, hypermarkets, and e-commerce), this report is an invaluable resource for stakeholders seeking to understand and capitalize on opportunities within this dynamic market. The report leverages data from the historical period (2019-2024), base year (2025), and estimated year (2025), projecting market trends through 2033. The global market is estimated to be worth $XX Million in 2025 and is projected to reach $XX Million by 2033.
Fresh Cherries Industry Market Composition & Trends
This section delves into the competitive landscape of the fresh cherries industry, analyzing market concentration, innovation drivers, regulatory frameworks, substitute products, end-user preferences, and merger & acquisition (M&A) activities. The report examines the market share distribution among key players, including Erie Fruits International, Rainier Fruit Company, Stemilt Growers, Northwest Cherry Growers, and Chelan Fresh. We analyze the impact of innovation in cultivation techniques, post-harvest handling, and packaging on market dynamics. Regulatory changes influencing production, trade, and labeling are also critically assessed. Furthermore, the report explores the presence of substitute fruits and their impact on market share, along with profiling key end-users and analyzing the impact of M&A activities on market consolidation. Estimated M&A deal values are analyzed, revealing trends in industry consolidation and strategic partnerships. The report quantifies market share distribution among the top five players, showing a combined market share of approximately XX%.
- Market Concentration: High concentration with the top 5 players holding a significant market share.
- Innovation Catalysts: Advancements in orchard management, post-harvest technologies, and packaging solutions.
- Regulatory Landscape: Impact of food safety regulations, trade policies, and labeling requirements.
- Substitute Products: Analysis of competing fruits and their market penetration.
- End-User Profiles: Detailed segmentation of consumer preferences and purchasing behavior.
- M&A Activities: Evaluation of recent mergers, acquisitions, and their influence on market dynamics. Total M&A deal value over the study period is estimated at $XX Million.
Fresh Cherries Industry Evolution
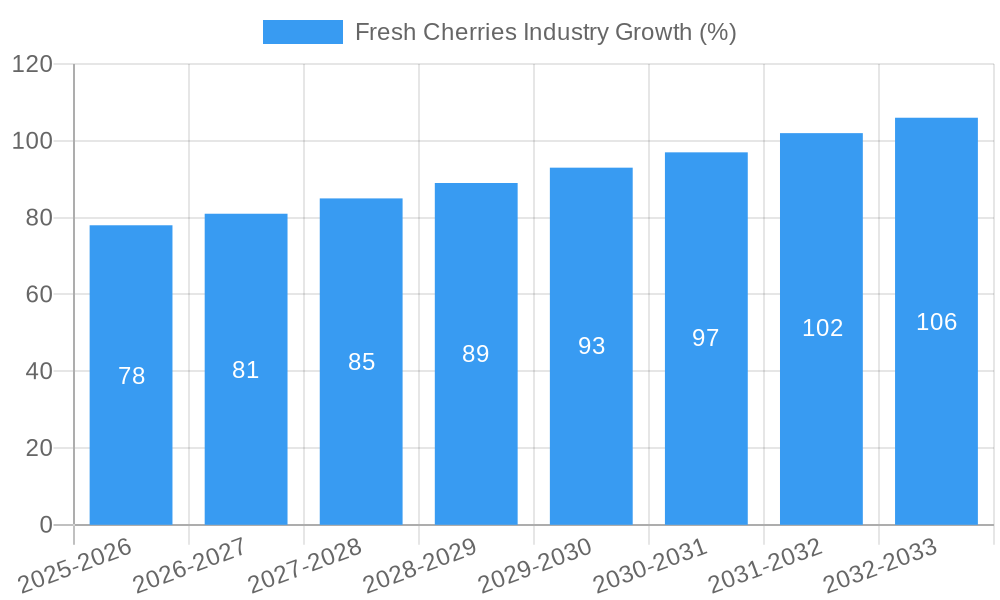
This section provides a comprehensive analysis of the evolution of the fresh cherries industry, encompassing market growth trajectories, technological advancements, and shifts in consumer demand from 2019-2033. We examine the historical growth rate of the global fresh cherries market, projecting a compound annual growth rate (CAGR) of XX% during the forecast period (2025-2033). The impact of technological advancements such as precision agriculture, improved irrigation techniques, and advanced packaging on production efficiency and product quality is explored. This section also analyses shifting consumer preferences towards organic and sustainably produced cherries, influencing industry practices and market segments. The report examines the adoption rates of new technologies, analyzing their influence on yield, quality, and overall market competitiveness. For instance, the adoption rate of precision agriculture techniques increased by approximately XX% from 2019 to 2024.
Leading Regions, Countries, or Segments in Fresh Cherries Industry
This section identifies the dominant regions, countries, and segments within the fresh cherries industry. Analysis considers the cherry types (Bing, Rainier, Royal Ann, Montmorency), applications (fresh, processed), and distribution channels (supermarkets, hypermarkets, e-commerce). The report pinpoints the leading region based on production volume and market value. Specific examples include detailed analysis of market leadership in key regions.
- Key Drivers:
- Investment Trends: Significant investments in high-density orchards and advanced technologies.
- Regulatory Support: Favorable policies promoting cherry cultivation and exports.
- Dominance Factors: Superior climatic conditions, established infrastructure, and efficient supply chains contribute to the dominance of the leading region.
Fresh Cherries Industry Product Innovations
This section highlights recent product innovations in the fresh cherries industry, focusing on novel varieties, improved packaging, and technologies enhancing shelf life and quality. The report examines new cherry varieties with enhanced flavor profiles, improved disease resistance, and longer shelf life. Advances in packaging technologies that extend the shelf life and maintain freshness are detailed, including modified atmosphere packaging (MAP) and innovative preservation methods. Unique selling propositions of new products and their market reception are analyzed, alongside the performance metrics of key innovations.
Propelling Factors for Fresh Cherries Industry Growth
Several factors drive the growth of the fresh cherries industry. Technological advancements in cultivation and post-harvest handling significantly increase production efficiency and quality. Favorable economic conditions in key consumer markets fuel demand for premium fruits like cherries. Supportive government policies promoting sustainable agriculture and international trade further stimulate growth. Examples include investments in research and development, leading to new varieties with improved yield and quality.
Obstacles in the Fresh Cherries Industry Market
The fresh cherries industry faces several challenges. Strict regulatory requirements for food safety and traceability increase production costs. Supply chain disruptions due to weather events and logistical issues can impact availability and pricing. Intense competition from substitute fruits and other fresh produce puts pressure on market share and profitability. The report quantifies the financial impact of these challenges, estimating, for instance, that supply chain disruptions caused a XX% decrease in revenue in 2022.
Future Opportunities in Fresh Cherries Industry
The fresh cherries industry presents promising opportunities. Expanding into new markets with increasing disposable incomes and a growing demand for premium produce presents significant potential. Technological advancements, such as precision agriculture and improved packaging, continue to enhance efficiency and product quality. The rising popularity of convenient and ready-to-eat options creates opportunities for value-added products.
Major Players in the Fresh Cherries Industry Ecosystem
- Erie Fruits International
- Rainier Fruit Company
- Stemilt Growers
- Northwest Cherry Growers
- Chelan Fresh
Key Developments in Fresh Cherries Industry Industry
- December 2020: ProChile launched the "Cherry-sh Every Moment" campaign in India, expanding market reach.
- July 2021: Modern intensive cherry orchards emerged in Uzbekistan, increasing global supply.
- October 2021: US imports of Chilean cherries reached approximately 6,800 metric tons, showcasing diversification of supply sources.
Strategic Fresh Cherries Industry Market Forecast
The global fresh cherries market is poised for robust growth, driven by rising consumer demand, technological advancements, and expanding market access. The forecast period (2025-2033) anticipates a CAGR of XX%, with significant potential for market expansion in emerging economies and through innovative product development. These growth catalysts are expected to propel market expansion and create significant value generation opportunities for industry participants.
Fresh Cherries Industry Segmentation
- 1. Production Analysis
- 2. Consumption Analysis
- 3. Import Market Analysis (Value & Volume)
- 4. Export Market Analysis (Value & Volume)
- 5. Price Trend Analysis
Fresh Cherries Industry Segmentation By Geography
-
1. North America
- 1.1. United States
-
2. Europe
- 2.1. Spain
-
3. Asia Pacific
- 3.1. China
-
4. South America
- 4.1. Chile
-
5. Middle East and Africa
- 5.1. Turkey
Fresh Cherries Industry REPORT HIGHLIGHTS
| Aspects | Details |
|---|---|
| Study Period | 2019-2033 |
| Base Year | 2024 |
| Estimated Year | 2025 |
| Forecast Period | 2025-2033 |
| Historical Period | 2019-2024 |
| Growth Rate | CAGR of 5.20% from 2019-2033 |
| Segmentation |
|
Table of Contents
- 1. Introduction
- 1.1. Research Scope
- 1.2. Market Segmentation
- 1.3. Research Methodology
- 1.4. Definitions and Assumptions
- 2. Executive Summary
- 2.1. Introduction
- 3. Market Dynamics
- 3.1. Introduction
- 3.2. Market Drivers
- 3.2.1. ; Awareness About Health Benefits Associated With Pecan Consumption; Wide Application of Pecan
- 3.3. Market Restrains
- 3.3.1. ; Volatility in the Prices; Adverse Weather Conditions Affecting Yield
- 3.4. Market Trends
- 3.4.1. Increasing Demand for Imported Sweet Cherries
- 4. Market Factor Analysis
- 4.1. Porters Five Forces
- 4.2. Supply/Value Chain
- 4.3. PESTEL analysis
- 4.4. Market Entropy
- 4.5. Patent/Trademark Analysis
- 5. Global Fresh Cherries Industry Analysis, Insights and Forecast, 2019-2031
- 5.1. Market Analysis, Insights and Forecast - by Production Analysis
- 5.2. Market Analysis, Insights and Forecast - by Consumption Analysis
- 5.3. Market Analysis, Insights and Forecast - by Import Market Analysis (Value & Volume)
- 5.4. Market Analysis, Insights and Forecast - by Export Market Analysis (Value & Volume)
- 5.5. Market Analysis, Insights and Forecast - by Price Trend Analysis
- 5.6. Market Analysis, Insights and Forecast - by Region
- 5.6.1. North America
- 5.6.2. Europe
- 5.6.3. Asia Pacific
- 5.6.4. South America
- 5.6.5. Middle East and Africa
- 5.1. Market Analysis, Insights and Forecast - by Production Analysis
- 6. North America Fresh Cherries Industry Analysis, Insights and Forecast, 2019-2031
- 6.1. Market Analysis, Insights and Forecast - by Production Analysis
- 6.2. Market Analysis, Insights and Forecast - by Consumption Analysis
- 6.3. Market Analysis, Insights and Forecast - by Import Market Analysis (Value & Volume)
- 6.4. Market Analysis, Insights and Forecast - by Export Market Analysis (Value & Volume)
- 6.5. Market Analysis, Insights and Forecast - by Price Trend Analysis
- 6.1. Market Analysis, Insights and Forecast - by Production Analysis
- 7. Europe Fresh Cherries Industry Analysis, Insights and Forecast, 2019-2031
- 7.1. Market Analysis, Insights and Forecast - by Production Analysis
- 7.2. Market Analysis, Insights and Forecast - by Consumption Analysis
- 7.3. Market Analysis, Insights and Forecast - by Import Market Analysis (Value & Volume)
- 7.4. Market Analysis, Insights and Forecast - by Export Market Analysis (Value & Volume)
- 7.5. Market Analysis, Insights and Forecast - by Price Trend Analysis
- 7.1. Market Analysis, Insights and Forecast - by Production Analysis
- 8. Asia Pacific Fresh Cherries Industry Analysis, Insights and Forecast, 2019-2031
- 8.1. Market Analysis, Insights and Forecast - by Production Analysis
- 8.2. Market Analysis, Insights and Forecast - by Consumption Analysis
- 8.3. Market Analysis, Insights and Forecast - by Import Market Analysis (Value & Volume)
- 8.4. Market Analysis, Insights and Forecast - by Export Market Analysis (Value & Volume)
- 8.5. Market Analysis, Insights and Forecast - by Price Trend Analysis
- 8.1. Market Analysis, Insights and Forecast - by Production Analysis
- 9. South America Fresh Cherries Industry Analysis, Insights and Forecast, 2019-2031
- 9.1. Market Analysis, Insights and Forecast - by Production Analysis
- 9.2. Market Analysis, Insights and Forecast - by Consumption Analysis
- 9.3. Market Analysis, Insights and Forecast - by Import Market Analysis (Value & Volume)
- 9.4. Market Analysis, Insights and Forecast - by Export Market Analysis (Value & Volume)
- 9.5. Market Analysis, Insights and Forecast - by Price Trend Analysis
- 9.1. Market Analysis, Insights and Forecast - by Production Analysis
- 10. Middle East and Africa Fresh Cherries Industry Analysis, Insights and Forecast, 2019-2031
- 10.1. Market Analysis, Insights and Forecast - by Production Analysis
- 10.2. Market Analysis, Insights and Forecast - by Consumption Analysis
- 10.3. Market Analysis, Insights and Forecast - by Import Market Analysis (Value & Volume)
- 10.4. Market Analysis, Insights and Forecast - by Export Market Analysis (Value & Volume)
- 10.5. Market Analysis, Insights and Forecast - by Price Trend Analysis
- 10.1. Market Analysis, Insights and Forecast - by Production Analysis
- 11. South America Fresh Cherries Industry Analysis, Insights and Forecast, 2019-2031
- 11.1. Market Analysis, Insights and Forecast - By Country/Sub-region
- 11.1.1 Brazil
- 11.1.2 Argentina
- 11.1.3 Rest of South America
- 12. North America Fresh Cherries Industry Analysis, Insights and Forecast, 2019-2031
- 12.1. Market Analysis, Insights and Forecast - By Country/Sub-region
- 12.1.1 United States
- 12.1.2 Canada
- 12.1.3 Mexico
- 13. Asia Pacific Fresh Cherries Industry Analysis, Insights and Forecast, 2019-2031
- 13.1. Market Analysis, Insights and Forecast - By Country/Sub-region
- 13.1.1 China
- 13.1.2 Japan
- 13.1.3 India
- 13.1.4 South Korea
- 13.1.5 Taiwan
- 13.1.6 Australia
- 13.1.7 Rest of Asia-Pacific
- 14. Europe Fresh Cherries Industry Analysis, Insights and Forecast, 2019-2031
- 14.1. Market Analysis, Insights and Forecast - By Country/Sub-region
- 14.1.1 Germany
- 14.1.2 France
- 14.1.3 Italy
- 14.1.4 United Kingdom
- 14.1.5 Netherlands
- 14.1.6 Rest of Europe
- 15. MEA Fresh Cherries Industry Analysis, Insights and Forecast, 2019-2031
- 15.1. Market Analysis, Insights and Forecast - By Country/Sub-region
- 15.1.1 Middle East
- 15.1.2 Africa
- 16. Competitive Analysis
- 16.1. Global Market Share Analysis 2024
- 16.2. Company Profiles
- 16.2.1 Erie Fruits International
- 16.2.1.1. Overview
- 16.2.1.2. Products
- 16.2.1.3. SWOT Analysis
- 16.2.1.4. Recent Developments
- 16.2.1.5. Financials (Based on Availability)
- 16.2.2 Rainier Fruit Company
- 16.2.2.1. Overview
- 16.2.2.2. Products
- 16.2.2.3. SWOT Analysis
- 16.2.2.4. Recent Developments
- 16.2.2.5. Financials (Based on Availability)
- 16.2.3 Stemilt Growers
- 16.2.3.1. Overview
- 16.2.3.2. Products
- 16.2.3.3. SWOT Analysis
- 16.2.3.4. Recent Developments
- 16.2.3.5. Financials (Based on Availability)
- 16.2.4 Northwest Cherry Growers
- 16.2.4.1. Overview
- 16.2.4.2. Products
- 16.2.4.3. SWOT Analysis
- 16.2.4.4. Recent Developments
- 16.2.4.5. Financials (Based on Availability)
- 16.2.5 Chelan Fresh
- 16.2.5.1. Overview
- 16.2.5.2. Products
- 16.2.5.3. SWOT Analysis
- 16.2.5.4. Recent Developments
- 16.2.5.5. Financials (Based on Availability)
- 16.2.1 Erie Fruits International
List of Figures
- Figure 1: Global Fresh Cherries Industry Revenue Breakdown (Million, %) by Region 2024 & 2032
- Figure 2: Global Fresh Cherries Industry Volume Breakdown (Metric Tons, %) by Region 2024 & 2032
- Figure 3: South America Fresh Cherries Industry Revenue (Million), by Country 2024 & 2032
- Figure 4: South America Fresh Cherries Industry Volume (Metric Tons), by Country 2024 & 2032
- Figure 5: South America Fresh Cherries Industry Revenue Share (%), by Country 2024 & 2032
- Figure 6: South America Fresh Cherries Industry Volume Share (%), by Country 2024 & 2032
- Figure 7: North America Fresh Cherries Industry Revenue (Million), by Country 2024 & 2032
- Figure 8: North America Fresh Cherries Industry Volume (Metric Tons), by Country 2024 & 2032
- Figure 9: North America Fresh Cherries Industry Revenue Share (%), by Country 2024 & 2032
- Figure 10: North America Fresh Cherries Industry Volume Share (%), by Country 2024 & 2032
- Figure 11: Asia Pacific Fresh Cherries Industry Revenue (Million), by Country 2024 & 2032
- Figure 12: Asia Pacific Fresh Cherries Industry Volume (Metric Tons), by Country 2024 & 2032
- Figure 13: Asia Pacific Fresh Cherries Industry Revenue Share (%), by Country 2024 & 2032
- Figure 14: Asia Pacific Fresh Cherries Industry Volume Share (%), by Country 2024 & 2032
- Figure 15: Europe Fresh Cherries Industry Revenue (Million), by Country 2024 & 2032
- Figure 16: Europe Fresh Cherries Industry Volume (Metric Tons), by Country 2024 & 2032
- Figure 17: Europe Fresh Cherries Industry Revenue Share (%), by Country 2024 & 2032
- Figure 18: Europe Fresh Cherries Industry Volume Share (%), by Country 2024 & 2032
- Figure 19: MEA Fresh Cherries Industry Revenue (Million), by Country 2024 & 2032
- Figure 20: MEA Fresh Cherries Industry Volume (Metric Tons), by Country 2024 & 2032
- Figure 21: MEA Fresh Cherries Industry Revenue Share (%), by Country 2024 & 2032
- Figure 22: MEA Fresh Cherries Industry Volume Share (%), by Country 2024 & 2032
- Figure 23: North America Fresh Cherries Industry Revenue (Million), by Production Analysis 2024 & 2032
- Figure 24: North America Fresh Cherries Industry Volume (Metric Tons), by Production Analysis 2024 & 2032
- Figure 25: North America Fresh Cherries Industry Revenue Share (%), by Production Analysis 2024 & 2032
- Figure 26: North America Fresh Cherries Industry Volume Share (%), by Production Analysis 2024 & 2032
- Figure 27: North America Fresh Cherries Industry Revenue (Million), by Consumption Analysis 2024 & 2032
- Figure 28: North America Fresh Cherries Industry Volume (Metric Tons), by Consumption Analysis 2024 & 2032
- Figure 29: North America Fresh Cherries Industry Revenue Share (%), by Consumption Analysis 2024 & 2032
- Figure 30: North America Fresh Cherries Industry Volume Share (%), by Consumption Analysis 2024 & 2032
- Figure 31: North America Fresh Cherries Industry Revenue (Million), by Import Market Analysis (Value & Volume) 2024 & 2032
- Figure 32: North America Fresh Cherries Industry Volume (Metric Tons), by Import Market Analysis (Value & Volume) 2024 & 2032
- Figure 33: North America Fresh Cherries Industry Revenue Share (%), by Import Market Analysis (Value & Volume) 2024 & 2032
- Figure 34: North America Fresh Cherries Industry Volume Share (%), by Import Market Analysis (Value & Volume) 2024 & 2032
- Figure 35: North America Fresh Cherries Industry Revenue (Million), by Export Market Analysis (Value & Volume) 2024 & 2032
- Figure 36: North America Fresh Cherries Industry Volume (Metric Tons), by Export Market Analysis (Value & Volume) 2024 & 2032
- Figure 37: North America Fresh Cherries Industry Revenue Share (%), by Export Market Analysis (Value & Volume) 2024 & 2032
- Figure 38: North America Fresh Cherries Industry Volume Share (%), by Export Market Analysis (Value & Volume) 2024 & 2032
- Figure 39: North America Fresh Cherries Industry Revenue (Million), by Price Trend Analysis 2024 & 2032
- Figure 40: North America Fresh Cherries Industry Volume (Metric Tons), by Price Trend Analysis 2024 & 2032
- Figure 41: North America Fresh Cherries Industry Revenue Share (%), by Price Trend Analysis 2024 & 2032
- Figure 42: North America Fresh Cherries Industry Volume Share (%), by Price Trend Analysis 2024 & 2032
- Figure 43: North America Fresh Cherries Industry Revenue (Million), by Country 2024 & 2032
- Figure 44: North America Fresh Cherries Industry Volume (Metric Tons), by Country 2024 & 2032
- Figure 45: North America Fresh Cherries Industry Revenue Share (%), by Country 2024 & 2032
- Figure 46: North America Fresh Cherries Industry Volume Share (%), by Country 2024 & 2032
- Figure 47: Europe Fresh Cherries Industry Revenue (Million), by Production Analysis 2024 & 2032
- Figure 48: Europe Fresh Cherries Industry Volume (Metric Tons), by Production Analysis 2024 & 2032
- Figure 49: Europe Fresh Cherries Industry Revenue Share (%), by Production Analysis 2024 & 2032
- Figure 50: Europe Fresh Cherries Industry Volume Share (%), by Production Analysis 2024 & 2032
- Figure 51: Europe Fresh Cherries Industry Revenue (Million), by Consumption Analysis 2024 & 2032
- Figure 52: Europe Fresh Cherries Industry Volume (Metric Tons), by Consumption Analysis 2024 & 2032
- Figure 53: Europe Fresh Cherries Industry Revenue Share (%), by Consumption Analysis 2024 & 2032
- Figure 54: Europe Fresh Cherries Industry Volume Share (%), by Consumption Analysis 2024 & 2032
- Figure 55: Europe Fresh Cherries Industry Revenue (Million), by Import Market Analysis (Value & Volume) 2024 & 2032
- Figure 56: Europe Fresh Cherries Industry Volume (Metric Tons), by Import Market Analysis (Value & Volume) 2024 & 2032
- Figure 57: Europe Fresh Cherries Industry Revenue Share (%), by Import Market Analysis (Value & Volume) 2024 & 2032
- Figure 58: Europe Fresh Cherries Industry Volume Share (%), by Import Market Analysis (Value & Volume) 2024 & 2032
- Figure 59: Europe Fresh Cherries Industry Revenue (Million), by Export Market Analysis (Value & Volume) 2024 & 2032
- Figure 60: Europe Fresh Cherries Industry Volume (Metric Tons), by Export Market Analysis (Value & Volume) 2024 & 2032
- Figure 61: Europe Fresh Cherries Industry Revenue Share (%), by Export Market Analysis (Value & Volume) 2024 & 2032
- Figure 62: Europe Fresh Cherries Industry Volume Share (%), by Export Market Analysis (Value & Volume) 2024 & 2032
- Figure 63: Europe Fresh Cherries Industry Revenue (Million), by Price Trend Analysis 2024 & 2032
- Figure 64: Europe Fresh Cherries Industry Volume (Metric Tons), by Price Trend Analysis 2024 & 2032
- Figure 65: Europe Fresh Cherries Industry Revenue Share (%), by Price Trend Analysis 2024 & 2032
- Figure 66: Europe Fresh Cherries Industry Volume Share (%), by Price Trend Analysis 2024 & 2032
- Figure 67: Europe Fresh Cherries Industry Revenue (Million), by Country 2024 & 2032
- Figure 68: Europe Fresh Cherries Industry Volume (Metric Tons), by Country 2024 & 2032
- Figure 69: Europe Fresh Cherries Industry Revenue Share (%), by Country 2024 & 2032
- Figure 70: Europe Fresh Cherries Industry Volume Share (%), by Country 2024 & 2032
- Figure 71: Asia Pacific Fresh Cherries Industry Revenue (Million), by Production Analysis 2024 & 2032
- Figure 72: Asia Pacific Fresh Cherries Industry Volume (Metric Tons), by Production Analysis 2024 & 2032
- Figure 73: Asia Pacific Fresh Cherries Industry Revenue Share (%), by Production Analysis 2024 & 2032
- Figure 74: Asia Pacific Fresh Cherries Industry Volume Share (%), by Production Analysis 2024 & 2032
- Figure 75: Asia Pacific Fresh Cherries Industry Revenue (Million), by Consumption Analysis 2024 & 2032
- Figure 76: Asia Pacific Fresh Cherries Industry Volume (Metric Tons), by Consumption Analysis 2024 & 2032
- Figure 77: Asia Pacific Fresh Cherries Industry Revenue Share (%), by Consumption Analysis 2024 & 2032
- Figure 78: Asia Pacific Fresh Cherries Industry Volume Share (%), by Consumption Analysis 2024 & 2032
- Figure 79: Asia Pacific Fresh Cherries Industry Revenue (Million), by Import Market Analysis (Value & Volume) 2024 & 2032
- Figure 80: Asia Pacific Fresh Cherries Industry Volume (Metric Tons), by Import Market Analysis (Value & Volume) 2024 & 2032
- Figure 81: Asia Pacific Fresh Cherries Industry Revenue Share (%), by Import Market Analysis (Value & Volume) 2024 & 2032
- Figure 82: Asia Pacific Fresh Cherries Industry Volume Share (%), by Import Market Analysis (Value & Volume) 2024 & 2032
- Figure 83: Asia Pacific Fresh Cherries Industry Revenue (Million), by Export Market Analysis (Value & Volume) 2024 & 2032
- Figure 84: Asia Pacific Fresh Cherries Industry Volume (Metric Tons), by Export Market Analysis (Value & Volume) 2024 & 2032
- Figure 85: Asia Pacific Fresh Cherries Industry Revenue Share (%), by Export Market Analysis (Value & Volume) 2024 & 2032
- Figure 86: Asia Pacific Fresh Cherries Industry Volume Share (%), by Export Market Analysis (Value & Volume) 2024 & 2032
- Figure 87: Asia Pacific Fresh Cherries Industry Revenue (Million), by Price Trend Analysis 2024 & 2032
- Figure 88: Asia Pacific Fresh Cherries Industry Volume (Metric Tons), by Price Trend Analysis 2024 & 2032
- Figure 89: Asia Pacific Fresh Cherries Industry Revenue Share (%), by Price Trend Analysis 2024 & 2032
- Figure 90: Asia Pacific Fresh Cherries Industry Volume Share (%), by Price Trend Analysis 2024 & 2032
- Figure 91: Asia Pacific Fresh Cherries Industry Revenue (Million), by Country 2024 & 2032
- Figure 92: Asia Pacific Fresh Cherries Industry Volume (Metric Tons), by Country 2024 & 2032
- Figure 93: Asia Pacific Fresh Cherries Industry Revenue Share (%), by Country 2024 & 2032
- Figure 94: Asia Pacific Fresh Cherries Industry Volume Share (%), by Country 2024 & 2032
- Figure 95: South America Fresh Cherries Industry Revenue (Million), by Production Analysis 2024 & 2032
- Figure 96: South America Fresh Cherries Industry Volume (Metric Tons), by Production Analysis 2024 & 2032
- Figure 97: South America Fresh Cherries Industry Revenue Share (%), by Production Analysis 2024 & 2032
- Figure 98: South America Fresh Cherries Industry Volume Share (%), by Production Analysis 2024 & 2032
- Figure 99: South America Fresh Cherries Industry Revenue (Million), by Consumption Analysis 2024 & 2032
- Figure 100: South America Fresh Cherries Industry Volume (Metric Tons), by Consumption Analysis 2024 & 2032
- Figure 101: South America Fresh Cherries Industry Revenue Share (%), by Consumption Analysis 2024 & 2032
- Figure 102: South America Fresh Cherries Industry Volume Share (%), by Consumption Analysis 2024 & 2032
- Figure 103: South America Fresh Cherries Industry Revenue (Million), by Import Market Analysis (Value & Volume) 2024 & 2032
- Figure 104: South America Fresh Cherries Industry Volume (Metric Tons), by Import Market Analysis (Value & Volume) 2024 & 2032
- Figure 105: South America Fresh Cherries Industry Revenue Share (%), by Import Market Analysis (Value & Volume) 2024 & 2032
- Figure 106: South America Fresh Cherries Industry Volume Share (%), by Import Market Analysis (Value & Volume) 2024 & 2032
- Figure 107: South America Fresh Cherries Industry Revenue (Million), by Export Market Analysis (Value & Volume) 2024 & 2032
- Figure 108: South America Fresh Cherries Industry Volume (Metric Tons), by Export Market Analysis (Value & Volume) 2024 & 2032
- Figure 109: South America Fresh Cherries Industry Revenue Share (%), by Export Market Analysis (Value & Volume) 2024 & 2032
- Figure 110: South America Fresh Cherries Industry Volume Share (%), by Export Market Analysis (Value & Volume) 2024 & 2032
- Figure 111: South America Fresh Cherries Industry Revenue (Million), by Price Trend Analysis 2024 & 2032
- Figure 112: South America Fresh Cherries Industry Volume (Metric Tons), by Price Trend Analysis 2024 & 2032
- Figure 113: South America Fresh Cherries Industry Revenue Share (%), by Price Trend Analysis 2024 & 2032
- Figure 114: South America Fresh Cherries Industry Volume Share (%), by Price Trend Analysis 2024 & 2032
- Figure 115: South America Fresh Cherries Industry Revenue (Million), by Country 2024 & 2032
- Figure 116: South America Fresh Cherries Industry Volume (Metric Tons), by Country 2024 & 2032
- Figure 117: South America Fresh Cherries Industry Revenue Share (%), by Country 2024 & 2032
- Figure 118: South America Fresh Cherries Industry Volume Share (%), by Country 2024 & 2032
- Figure 119: Middle East and Africa Fresh Cherries Industry Revenue (Million), by Production Analysis 2024 & 2032
- Figure 120: Middle East and Africa Fresh Cherries Industry Volume (Metric Tons), by Production Analysis 2024 & 2032
- Figure 121: Middle East and Africa Fresh Cherries Industry Revenue Share (%), by Production Analysis 2024 & 2032
- Figure 122: Middle East and Africa Fresh Cherries Industry Volume Share (%), by Production Analysis 2024 & 2032
- Figure 123: Middle East and Africa Fresh Cherries Industry Revenue (Million), by Consumption Analysis 2024 & 2032
- Figure 124: Middle East and Africa Fresh Cherries Industry Volume (Metric Tons), by Consumption Analysis 2024 & 2032
- Figure 125: Middle East and Africa Fresh Cherries Industry Revenue Share (%), by Consumption Analysis 2024 & 2032
- Figure 126: Middle East and Africa Fresh Cherries Industry Volume Share (%), by Consumption Analysis 2024 & 2032
- Figure 127: Middle East and Africa Fresh Cherries Industry Revenue (Million), by Import Market Analysis (Value & Volume) 2024 & 2032
- Figure 128: Middle East and Africa Fresh Cherries Industry Volume (Metric Tons), by Import Market Analysis (Value & Volume) 2024 & 2032
- Figure 129: Middle East and Africa Fresh Cherries Industry Revenue Share (%), by Import Market Analysis (Value & Volume) 2024 & 2032
- Figure 130: Middle East and Africa Fresh Cherries Industry Volume Share (%), by Import Market Analysis (Value & Volume) 2024 & 2032
- Figure 131: Middle East and Africa Fresh Cherries Industry Revenue (Million), by Export Market Analysis (Value & Volume) 2024 & 2032
- Figure 132: Middle East and Africa Fresh Cherries Industry Volume (Metric Tons), by Export Market Analysis (Value & Volume) 2024 & 2032
- Figure 133: Middle East and Africa Fresh Cherries Industry Revenue Share (%), by Export Market Analysis (Value & Volume) 2024 & 2032
- Figure 134: Middle East and Africa Fresh Cherries Industry Volume Share (%), by Export Market Analysis (Value & Volume) 2024 & 2032
- Figure 135: Middle East and Africa Fresh Cherries Industry Revenue (Million), by Price Trend Analysis 2024 & 2032
- Figure 136: Middle East and Africa Fresh Cherries Industry Volume (Metric Tons), by Price Trend Analysis 2024 & 2032
- Figure 137: Middle East and Africa Fresh Cherries Industry Revenue Share (%), by Price Trend Analysis 2024 & 2032
- Figure 138: Middle East and Africa Fresh Cherries Industry Volume Share (%), by Price Trend Analysis 2024 & 2032
- Figure 139: Middle East and Africa Fresh Cherries Industry Revenue (Million), by Country 2024 & 2032
- Figure 140: Middle East and Africa Fresh Cherries Industry Volume (Metric Tons), by Country 2024 & 2032
- Figure 141: Middle East and Africa Fresh Cherries Industry Revenue Share (%), by Country 2024 & 2032
- Figure 142: Middle East and Africa Fresh Cherries Industry Volume Share (%), by Country 2024 & 2032
List of Tables
- Table 1: Global Fresh Cherries Industry Revenue Million Forecast, by Region 2019 & 2032
- Table 2: Global Fresh Cherries Industry Volume Metric Tons Forecast, by Region 2019 & 2032
- Table 3: Global Fresh Cherries Industry Revenue Million Forecast, by Production Analysis 2019 & 2032
- Table 4: Global Fresh Cherries Industry Volume Metric Tons Forecast, by Production Analysis 2019 & 2032
- Table 5: Global Fresh Cherries Industry Revenue Million Forecast, by Consumption Analysis 2019 & 2032
- Table 6: Global Fresh Cherries Industry Volume Metric Tons Forecast, by Consumption Analysis 2019 & 2032
- Table 7: Global Fresh Cherries Industry Revenue Million Forecast, by Import Market Analysis (Value & Volume) 2019 & 2032
- Table 8: Global Fresh Cherries Industry Volume Metric Tons Forecast, by Import Market Analysis (Value & Volume) 2019 & 2032
- Table 9: Global Fresh Cherries Industry Revenue Million Forecast, by Export Market Analysis (Value & Volume) 2019 & 2032
- Table 10: Global Fresh Cherries Industry Volume Metric Tons Forecast, by Export Market Analysis (Value & Volume) 2019 & 2032
- Table 11: Global Fresh Cherries Industry Revenue Million Forecast, by Price Trend Analysis 2019 & 2032
- Table 12: Global Fresh Cherries Industry Volume Metric Tons Forecast, by Price Trend Analysis 2019 & 2032
- Table 13: Global Fresh Cherries Industry Revenue Million Forecast, by Region 2019 & 2032
- Table 14: Global Fresh Cherries Industry Volume Metric Tons Forecast, by Region 2019 & 2032
- Table 15: Global Fresh Cherries Industry Revenue Million Forecast, by Country 2019 & 2032
- Table 16: Global Fresh Cherries Industry Volume Metric Tons Forecast, by Country 2019 & 2032
- Table 17: Brazil Fresh Cherries Industry Revenue (Million) Forecast, by Application 2019 & 2032
- Table 18: Brazil Fresh Cherries Industry Volume (Metric Tons) Forecast, by Application 2019 & 2032
- Table 19: Argentina Fresh Cherries Industry Revenue (Million) Forecast, by Application 2019 & 2032
- Table 20: Argentina Fresh Cherries Industry Volume (Metric Tons) Forecast, by Application 2019 & 2032
- Table 21: Rest of South America Fresh Cherries Industry Revenue (Million) Forecast, by Application 2019 & 2032
- Table 22: Rest of South America Fresh Cherries Industry Volume (Metric Tons) Forecast, by Application 2019 & 2032
- Table 23: Global Fresh Cherries Industry Revenue Million Forecast, by Country 2019 & 2032
- Table 24: Global Fresh Cherries Industry Volume Metric Tons Forecast, by Country 2019 & 2032
- Table 25: United States Fresh Cherries Industry Revenue (Million) Forecast, by Application 2019 & 2032
- Table 26: United States Fresh Cherries Industry Volume (Metric Tons) Forecast, by Application 2019 & 2032
- Table 27: Canada Fresh Cherries Industry Revenue (Million) Forecast, by Application 2019 & 2032
- Table 28: Canada Fresh Cherries Industry Volume (Metric Tons) Forecast, by Application 2019 & 2032
- Table 29: Mexico Fresh Cherries Industry Revenue (Million) Forecast, by Application 2019 & 2032
- Table 30: Mexico Fresh Cherries Industry Volume (Metric Tons) Forecast, by Application 2019 & 2032
- Table 31: Global Fresh Cherries Industry Revenue Million Forecast, by Country 2019 & 2032
- Table 32: Global Fresh Cherries Industry Volume Metric Tons Forecast, by Country 2019 & 2032
- Table 33: China Fresh Cherries Industry Revenue (Million) Forecast, by Application 2019 & 2032
- Table 34: China Fresh Cherries Industry Volume (Metric Tons) Forecast, by Application 2019 & 2032
- Table 35: Japan Fresh Cherries Industry Revenue (Million) Forecast, by Application 2019 & 2032
- Table 36: Japan Fresh Cherries Industry Volume (Metric Tons) Forecast, by Application 2019 & 2032
- Table 37: India Fresh Cherries Industry Revenue (Million) Forecast, by Application 2019 & 2032
- Table 38: India Fresh Cherries Industry Volume (Metric Tons) Forecast, by Application 2019 & 2032
- Table 39: South Korea Fresh Cherries Industry Revenue (Million) Forecast, by Application 2019 & 2032
- Table 40: South Korea Fresh Cherries Industry Volume (Metric Tons) Forecast, by Application 2019 & 2032
- Table 41: Taiwan Fresh Cherries Industry Revenue (Million) Forecast, by Application 2019 & 2032
- Table 42: Taiwan Fresh Cherries Industry Volume (Metric Tons) Forecast, by Application 2019 & 2032
- Table 43: Australia Fresh Cherries Industry Revenue (Million) Forecast, by Application 2019 & 2032
- Table 44: Australia Fresh Cherries Industry Volume (Metric Tons) Forecast, by Application 2019 & 2032
- Table 45: Rest of Asia-Pacific Fresh Cherries Industry Revenue (Million) Forecast, by Application 2019 & 2032
- Table 46: Rest of Asia-Pacific Fresh Cherries Industry Volume (Metric Tons) Forecast, by Application 2019 & 2032
- Table 47: Global Fresh Cherries Industry Revenue Million Forecast, by Country 2019 & 2032
- Table 48: Global Fresh Cherries Industry Volume Metric Tons Forecast, by Country 2019 & 2032
- Table 49: Germany Fresh Cherries Industry Revenue (Million) Forecast, by Application 2019 & 2032
- Table 50: Germany Fresh Cherries Industry Volume (Metric Tons) Forecast, by Application 2019 & 2032
- Table 51: France Fresh Cherries Industry Revenue (Million) Forecast, by Application 2019 & 2032
- Table 52: France Fresh Cherries Industry Volume (Metric Tons) Forecast, by Application 2019 & 2032
- Table 53: Italy Fresh Cherries Industry Revenue (Million) Forecast, by Application 2019 & 2032
- Table 54: Italy Fresh Cherries Industry Volume (Metric Tons) Forecast, by Application 2019 & 2032
- Table 55: United Kingdom Fresh Cherries Industry Revenue (Million) Forecast, by Application 2019 & 2032
- Table 56: United Kingdom Fresh Cherries Industry Volume (Metric Tons) Forecast, by Application 2019 & 2032
- Table 57: Netherlands Fresh Cherries Industry Revenue (Million) Forecast, by Application 2019 & 2032
- Table 58: Netherlands Fresh Cherries Industry Volume (Metric Tons) Forecast, by Application 2019 & 2032
- Table 59: Rest of Europe Fresh Cherries Industry Revenue (Million) Forecast, by Application 2019 & 2032
- Table 60: Rest of Europe Fresh Cherries Industry Volume (Metric Tons) Forecast, by Application 2019 & 2032
- Table 61: Global Fresh Cherries Industry Revenue Million Forecast, by Country 2019 & 2032
- Table 62: Global Fresh Cherries Industry Volume Metric Tons Forecast, by Country 2019 & 2032
- Table 63: Middle East Fresh Cherries Industry Revenue (Million) Forecast, by Application 2019 & 2032
- Table 64: Middle East Fresh Cherries Industry Volume (Metric Tons) Forecast, by Application 2019 & 2032
- Table 65: Africa Fresh Cherries Industry Revenue (Million) Forecast, by Application 2019 & 2032
- Table 66: Africa Fresh Cherries Industry Volume (Metric Tons) Forecast, by Application 2019 & 2032
- Table 67: Global Fresh Cherries Industry Revenue Million Forecast, by Production Analysis 2019 & 2032
- Table 68: Global Fresh Cherries Industry Volume Metric Tons Forecast, by Production Analysis 2019 & 2032
- Table 69: Global Fresh Cherries Industry Revenue Million Forecast, by Consumption Analysis 2019 & 2032
- Table 70: Global Fresh Cherries Industry Volume Metric Tons Forecast, by Consumption Analysis 2019 & 2032
- Table 71: Global Fresh Cherries Industry Revenue Million Forecast, by Import Market Analysis (Value & Volume) 2019 & 2032
- Table 72: Global Fresh Cherries Industry Volume Metric Tons Forecast, by Import Market Analysis (Value & Volume) 2019 & 2032
- Table 73: Global Fresh Cherries Industry Revenue Million Forecast, by Export Market Analysis (Value & Volume) 2019 & 2032
- Table 74: Global Fresh Cherries Industry Volume Metric Tons Forecast, by Export Market Analysis (Value & Volume) 2019 & 2032
- Table 75: Global Fresh Cherries Industry Revenue Million Forecast, by Price Trend Analysis 2019 & 2032
- Table 76: Global Fresh Cherries Industry Volume Metric Tons Forecast, by Price Trend Analysis 2019 & 2032
- Table 77: Global Fresh Cherries Industry Revenue Million Forecast, by Country 2019 & 2032
- Table 78: Global Fresh Cherries Industry Volume Metric Tons Forecast, by Country 2019 & 2032
- Table 79: United States Fresh Cherries Industry Revenue (Million) Forecast, by Application 2019 & 2032
- Table 80: United States Fresh Cherries Industry Volume (Metric Tons) Forecast, by Application 2019 & 2032
- Table 81: Global Fresh Cherries Industry Revenue Million Forecast, by Production Analysis 2019 & 2032
- Table 82: Global Fresh Cherries Industry Volume Metric Tons Forecast, by Production Analysis 2019 & 2032
- Table 83: Global Fresh Cherries Industry Revenue Million Forecast, by Consumption Analysis 2019 & 2032
- Table 84: Global Fresh Cherries Industry Volume Metric Tons Forecast, by Consumption Analysis 2019 & 2032
- Table 85: Global Fresh Cherries Industry Revenue Million Forecast, by Import Market Analysis (Value & Volume) 2019 & 2032
- Table 86: Global Fresh Cherries Industry Volume Metric Tons Forecast, by Import Market Analysis (Value & Volume) 2019 & 2032
- Table 87: Global Fresh Cherries Industry Revenue Million Forecast, by Export Market Analysis (Value & Volume) 2019 & 2032
- Table 88: Global Fresh Cherries Industry Volume Metric Tons Forecast, by Export Market Analysis (Value & Volume) 2019 & 2032
- Table 89: Global Fresh Cherries Industry Revenue Million Forecast, by Price Trend Analysis 2019 & 2032
- Table 90: Global Fresh Cherries Industry Volume Metric Tons Forecast, by Price Trend Analysis 2019 & 2032
- Table 91: Global Fresh Cherries Industry Revenue Million Forecast, by Country 2019 & 2032
- Table 92: Global Fresh Cherries Industry Volume Metric Tons Forecast, by Country 2019 & 2032
- Table 93: Spain Fresh Cherries Industry Revenue (Million) Forecast, by Application 2019 & 2032
- Table 94: Spain Fresh Cherries Industry Volume (Metric Tons) Forecast, by Application 2019 & 2032
- Table 95: Global Fresh Cherries Industry Revenue Million Forecast, by Production Analysis 2019 & 2032
- Table 96: Global Fresh Cherries Industry Volume Metric Tons Forecast, by Production Analysis 2019 & 2032
- Table 97: Global Fresh Cherries Industry Revenue Million Forecast, by Consumption Analysis 2019 & 2032
- Table 98: Global Fresh Cherries Industry Volume Metric Tons Forecast, by Consumption Analysis 2019 & 2032
- Table 99: Global Fresh Cherries Industry Revenue Million Forecast, by Import Market Analysis (Value & Volume) 2019 & 2032
- Table 100: Global Fresh Cherries Industry Volume Metric Tons Forecast, by Import Market Analysis (Value & Volume) 2019 & 2032
- Table 101: Global Fresh Cherries Industry Revenue Million Forecast, by Export Market Analysis (Value & Volume) 2019 & 2032
- Table 102: Global Fresh Cherries Industry Volume Metric Tons Forecast, by Export Market Analysis (Value & Volume) 2019 & 2032
- Table 103: Global Fresh Cherries Industry Revenue Million Forecast, by Price Trend Analysis 2019 & 2032
- Table 104: Global Fresh Cherries Industry Volume Metric Tons Forecast, by Price Trend Analysis 2019 & 2032
- Table 105: Global Fresh Cherries Industry Revenue Million Forecast, by Country 2019 & 2032
- Table 106: Global Fresh Cherries Industry Volume Metric Tons Forecast, by Country 2019 & 2032
- Table 107: China Fresh Cherries Industry Revenue (Million) Forecast, by Application 2019 & 2032
- Table 108: China Fresh Cherries Industry Volume (Metric Tons) Forecast, by Application 2019 & 2032
- Table 109: Global Fresh Cherries Industry Revenue Million Forecast, by Production Analysis 2019 & 2032
- Table 110: Global Fresh Cherries Industry Volume Metric Tons Forecast, by Production Analysis 2019 & 2032
- Table 111: Global Fresh Cherries Industry Revenue Million Forecast, by Consumption Analysis 2019 & 2032
- Table 112: Global Fresh Cherries Industry Volume Metric Tons Forecast, by Consumption Analysis 2019 & 2032
- Table 113: Global Fresh Cherries Industry Revenue Million Forecast, by Import Market Analysis (Value & Volume) 2019 & 2032
- Table 114: Global Fresh Cherries Industry Volume Metric Tons Forecast, by Import Market Analysis (Value & Volume) 2019 & 2032
- Table 115: Global Fresh Cherries Industry Revenue Million Forecast, by Export Market Analysis (Value & Volume) 2019 & 2032
- Table 116: Global Fresh Cherries Industry Volume Metric Tons Forecast, by Export Market Analysis (Value & Volume) 2019 & 2032
- Table 117: Global Fresh Cherries Industry Revenue Million Forecast, by Price Trend Analysis 2019 & 2032
- Table 118: Global Fresh Cherries Industry Volume Metric Tons Forecast, by Price Trend Analysis 2019 & 2032
- Table 119: Global Fresh Cherries Industry Revenue Million Forecast, by Country 2019 & 2032
- Table 120: Global Fresh Cherries Industry Volume Metric Tons Forecast, by Country 2019 & 2032
- Table 121: Chile Fresh Cherries Industry Revenue (Million) Forecast, by Application 2019 & 2032
- Table 122: Chile Fresh Cherries Industry Volume (Metric Tons) Forecast, by Application 2019 & 2032
- Table 123: Global Fresh Cherries Industry Revenue Million Forecast, by Production Analysis 2019 & 2032
- Table 124: Global Fresh Cherries Industry Volume Metric Tons Forecast, by Production Analysis 2019 & 2032
- Table 125: Global Fresh Cherries Industry Revenue Million Forecast, by Consumption Analysis 2019 & 2032
- Table 126: Global Fresh Cherries Industry Volume Metric Tons Forecast, by Consumption Analysis 2019 & 2032
- Table 127: Global Fresh Cherries Industry Revenue Million Forecast, by Import Market Analysis (Value & Volume) 2019 & 2032
- Table 128: Global Fresh Cherries Industry Volume Metric Tons Forecast, by Import Market Analysis (Value & Volume) 2019 & 2032
- Table 129: Global Fresh Cherries Industry Revenue Million Forecast, by Export Market Analysis (Value & Volume) 2019 & 2032
- Table 130: Global Fresh Cherries Industry Volume Metric Tons Forecast, by Export Market Analysis (Value & Volume) 2019 & 2032
- Table 131: Global Fresh Cherries Industry Revenue Million Forecast, by Price Trend Analysis 2019 & 2032
- Table 132: Global Fresh Cherries Industry Volume Metric Tons Forecast, by Price Trend Analysis 2019 & 2032
- Table 133: Global Fresh Cherries Industry Revenue Million Forecast, by Country 2019 & 2032
- Table 134: Global Fresh Cherries Industry Volume Metric Tons Forecast, by Country 2019 & 2032
- Table 135: Turkey Fresh Cherries Industry Revenue (Million) Forecast, by Application 2019 & 2032
- Table 136: Turkey Fresh Cherries Industry Volume (Metric Tons) Forecast, by Application 2019 & 2032
Frequently Asked Questions
1. What is the projected Compound Annual Growth Rate (CAGR) of the Fresh Cherries Industry?
The projected CAGR is approximately 5.20%.
2. Which companies are prominent players in the Fresh Cherries Industry?
Key companies in the market include Erie Fruits International, Rainier Fruit Company , Stemilt Growers , Northwest Cherry Growers , Chelan Fresh .
3. What are the main segments of the Fresh Cherries Industry?
The market segments include Production Analysis, Consumption Analysis, Import Market Analysis (Value & Volume), Export Market Analysis (Value & Volume), Price Trend Analysis.
4. Can you provide details about the market size?
The market size is estimated to be USD XX Million as of 2022.
5. What are some drivers contributing to market growth?
; Awareness About Health Benefits Associated With Pecan Consumption; Wide Application of Pecan.
6. What are the notable trends driving market growth?
Increasing Demand for Imported Sweet Cherries.
7. Are there any restraints impacting market growth?
; Volatility in the Prices; Adverse Weather Conditions Affecting Yield.
8. Can you provide examples of recent developments in the market?
October 2021: For the 2020-21 season, the United States Department of Agriculture (USDA) reported that US imports of Chilean cherries totaled about 6,800 metric tons. While China has been the main receiver of Chilean cherries, the industry is working diligently to develop other markets, including the United States.
9. What pricing options are available for accessing the report?
Pricing options include single-user, multi-user, and enterprise licenses priced at USD 4750, USD 5250, and USD 8750 respectively.
10. Is the market size provided in terms of value or volume?
The market size is provided in terms of value, measured in Million and volume, measured in Metric Tons.
11. Are there any specific market keywords associated with the report?
Yes, the market keyword associated with the report is "Fresh Cherries Industry," which aids in identifying and referencing the specific market segment covered.
12. How do I determine which pricing option suits my needs best?
The pricing options vary based on user requirements and access needs. Individual users may opt for single-user licenses, while businesses requiring broader access may choose multi-user or enterprise licenses for cost-effective access to the report.
13. Are there any additional resources or data provided in the Fresh Cherries Industry report?
While the report offers comprehensive insights, it's advisable to review the specific contents or supplementary materials provided to ascertain if additional resources or data are available.
14. How can I stay updated on further developments or reports in the Fresh Cherries Industry?
To stay informed about further developments, trends, and reports in the Fresh Cherries Industry, consider subscribing to industry newsletters, following relevant companies and organizations, or regularly checking reputable industry news sources and publications.
Methodology
Step 1 - Identification of Relevant Samples Size from Population Database


Step 2 - Approaches for Defining Global Market Size (Value, Volume* & Price*)

Note*: In applicable scenarios
Step 3 - Data Sources
Primary Research
- Web Analytics
- Survey Reports
- Research Institute
- Latest Research Reports
- Opinion Leaders
Secondary Research
- Annual Reports
- White Paper
- Latest Press Release
- Industry Association
- Paid Database
- Investor Presentations

Step 4 - Data Triangulation
Involves using different sources of information in order to increase the validity of a study
These sources are likely to be stakeholders in a program - participants, other researchers, program staff, other community members, and so on.
Then we put all data in single framework & apply various statistical tools to find out the dynamic on the market.
During the analysis stage, feedback from the stakeholder groups would be compared to determine areas of agreement as well as areas of divergence
