

Key Insights
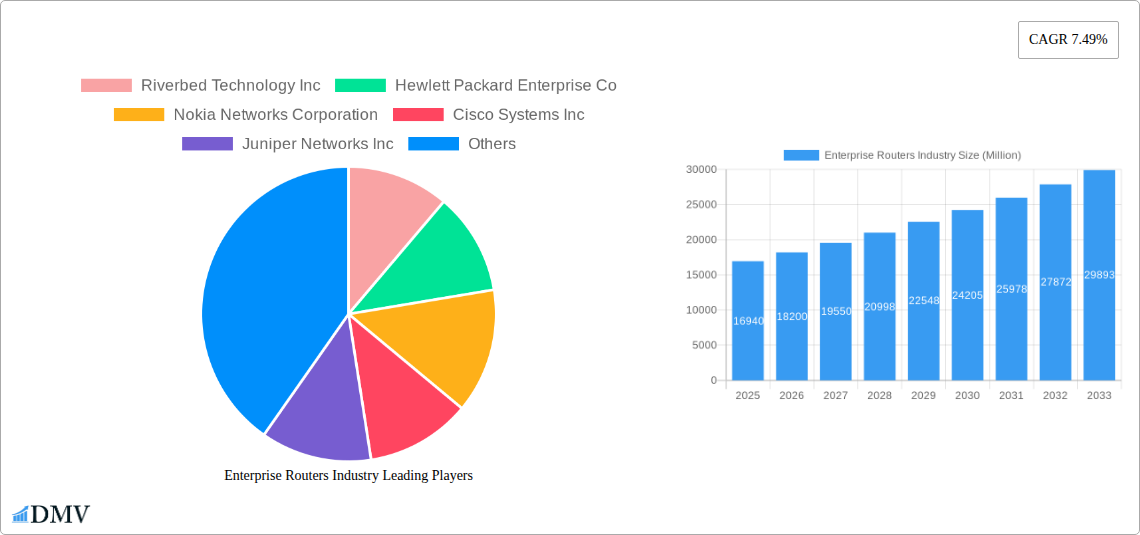
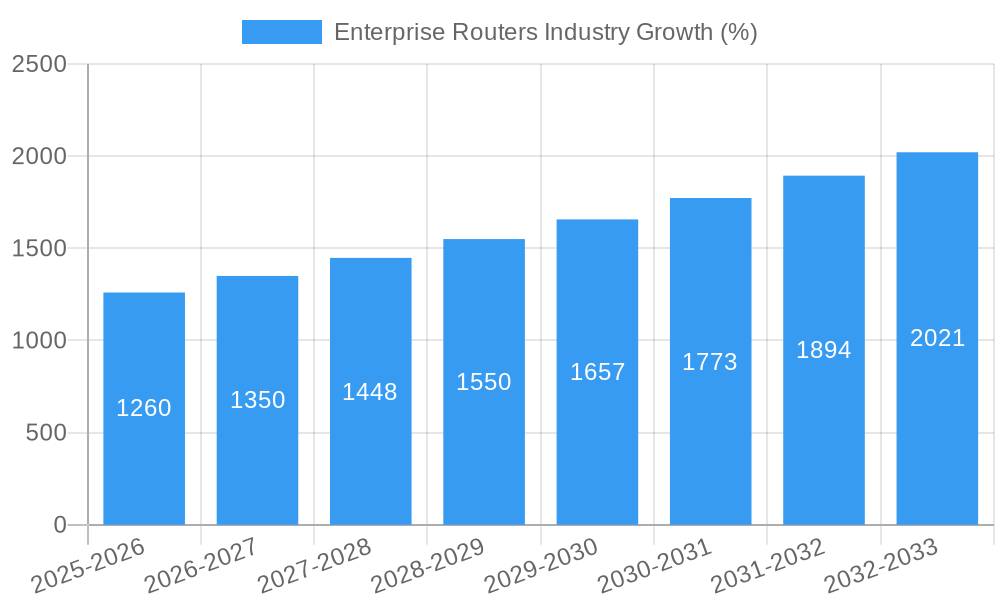
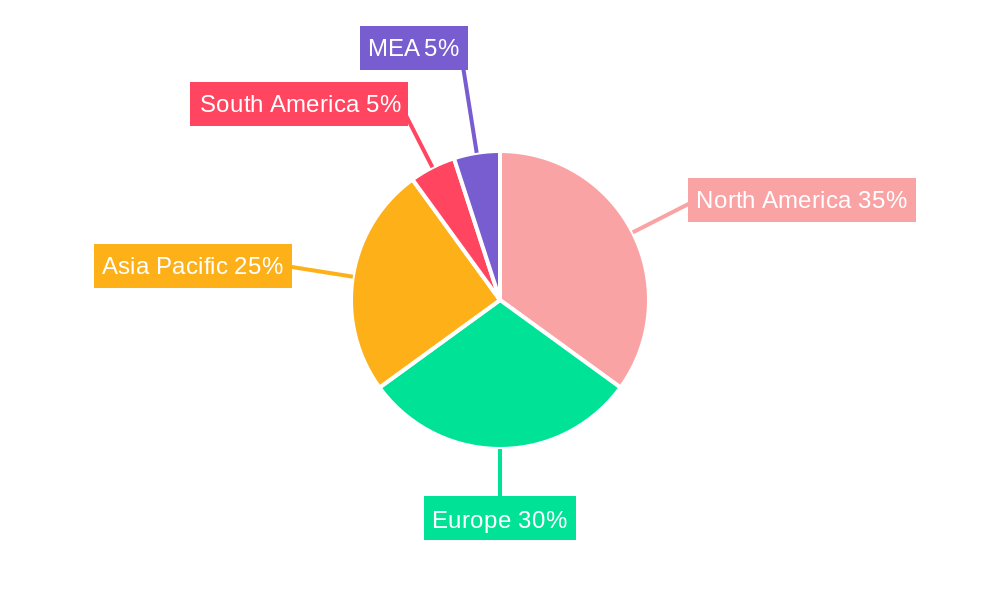
The Enterprise Router market, valued at $16.94 billion in 2025, is projected to experience robust growth, driven by the increasing adoption of cloud computing, the expansion of 5G networks, and the rising demand for secure and reliable network infrastructure across various sectors. The market's Compound Annual Growth Rate (CAGR) of 7.49% from 2025 to 2033 indicates a significant expansion over the forecast period. Key drivers include the need for enhanced network security in the face of escalating cyber threats, the growing adoption of Software-Defined Networking (SDN) and Network Function Virtualization (NFV), and the rising demand for high-bandwidth applications like video conferencing and data analytics. The BFSI, IT & Telecom, and Healthcare sectors are leading adopters, fueled by their dependence on secure and reliable connectivity for critical operations. The shift towards wireless connectivity, driven by the increasing popularity of mobile devices and IoT applications, is another significant trend. However, high initial investment costs and the complexities associated with network integration and management pose challenges to market growth. The market segmentation reveals strong demand across various router types, including core routers, multi-service edge routers, and access routers, with modular ports gaining traction due to their flexibility and scalability. Competition among established players like Cisco, Juniper, and Huawei is fierce, prompting innovation and price optimization strategies. Geographical analysis shows a strong concentration of market share in North America and Europe, with Asia Pacific expected to witness significant growth in the coming years.
The competitive landscape is dynamic, with both established players and emerging companies vying for market share. This competition is driving innovation in areas such as network security, automation, and cloud integration. Growth is expected to be fuelled by technological advancements leading to improved network performance and efficiency, increased adoption of hybrid cloud models, and the growing importance of edge computing. While challenges remain, the long-term outlook for the enterprise router market remains positive, driven by the continuing digital transformation across diverse industries and the persistent need for advanced networking capabilities to support this evolution. The adoption of new technologies like AI and machine learning for network optimization and security enhancement will further shape the market trajectory in the coming years.
Enterprise Routers Industry Market Report: 2019-2033
This comprehensive report provides an in-depth analysis of the Enterprise Routers market, projecting a robust growth trajectory from 2025 to 2033. Valued at $XX Million in 2025, the market is poised for significant expansion, driven by technological advancements and increasing demand across diverse sectors. This report offers critical insights for stakeholders, including market players, investors, and researchers, seeking to understand the current landscape and future potential of this dynamic industry. The study period spans 2019-2033, with 2025 serving as the base and estimated year. The forecast period covers 2025-2033, and the historical period is 2019-2024.
Enterprise Routers Industry Market Composition & Trends
The Enterprise Routers market exhibits a moderately concentrated landscape, with key players like Cisco Systems Inc, Juniper Networks Inc, and Huawei Technologies Co Ltd holding significant market share. However, the market is witnessing increased competition from emerging players and innovative solutions. Market share distribution in 2025 is estimated as follows: Cisco (30%), Juniper (15%), Huawei (12%), others (43%). Innovation is primarily driven by advancements in 5G technology, software-defined networking (SDN), and network function virtualization (NFV). The regulatory landscape is evolving with increasing focus on cybersecurity and data privacy, impacting product development and market access. Substitute products, such as Software-Defined WAN (SD-WAN) solutions, are gaining traction, creating competitive pressure. End-user profiles reveal a diverse range of industries, including BFSI, IT & Telecom, Healthcare, Retail, and Manufacturing, each presenting unique networking requirements. The historical period (2019-2024) witnessed several mergers and acquisitions (M&A) with a total deal value of approximately $XX Million, further shaping market dynamics.
- Market Concentration: Moderately concentrated, with a few dominant players.
- Innovation Catalysts: 5G, SDN, NFV, and enhanced security features.
- Regulatory Landscape: Increasing focus on cybersecurity and data privacy.
- Substitute Products: SD-WAN solutions are gaining market share.
- End-User Profiles: Diverse range of industries with varied networking needs.
- M&A Activity: Significant M&A activity observed in the historical period (2019-2024), totaling approximately $XX Million.
Enterprise Routers Industry Evolution
The Enterprise Routers market has experienced significant growth over the past five years, fueled by the rising adoption of cloud computing, the Internet of Things (IoT), and the increasing demand for high-bandwidth connectivity. The market exhibited a CAGR of XX% during the historical period (2019-2024), and is projected to maintain a CAGR of XX% during the forecast period (2025-2033). Technological advancements, including the introduction of 5G networks and advancements in SDN and NFV, are driving the adoption of sophisticated routing solutions. Shifting consumer demands towards enhanced security features, improved network performance, and streamlined management are reshaping the market. The increased adoption of hybrid and multi-cloud environments is driving demand for routers that can seamlessly integrate with diverse network architectures. The rise of edge computing is also creating new opportunities for the deployment of enterprise routers closer to the data source. This evolution is continuously impacted by factors such as technological upgrades in core technologies, global macroeconomic factors, and the changing needs of end users, influencing the demand for network upgrades and enhancements.
Leading Regions, Countries, or Segments in Enterprise Routers Industry
The North American region currently holds the largest market share in the enterprise router industry, driven by high levels of technological advancements, strong IT infrastructure, and substantial investments in digital transformation initiatives. Within the end-user verticals, the IT & Telecom sector demonstrates the highest growth potential, followed by the BFSI and Healthcare sectors. Wired connectivity remains dominant, although wireless solutions are rapidly gaining traction, particularly with the expansion of 5G networks. Fixed-port routers are currently the most prevalent type, but modular routers are witnessing increased adoption due to their flexibility and scalability. Core routers continue to be the largest segment by type.
- Key Drivers for North American Dominance:
- High adoption of advanced technologies.
- Strong IT infrastructure.
- Significant investments in digital transformation.
- Fastest-Growing End-User Verticals:
- IT & Telecom
- BFSI
- Healthcare
- Dominant Connectivity Type: Wired (with wireless rapidly growing).
- Dominant Port Type: Fixed Port (with modular gaining traction).
- Dominant Router Type: Core Routers.
Enterprise Routers Industry Product Innovations
Recent innovations focus on improving security, performance, and manageability. Next-generation routers incorporate advanced encryption protocols, threat detection capabilities, and intelligent traffic management features. The integration of AI and machine learning is enhancing network automation, optimization, and predictive maintenance. This also includes advancements in software-defined networking (SDN) and network function virtualization (NFV) which offer greater flexibility and scalability. Unique selling propositions often include superior throughput, low latency, and robust security features tailored to specific industry needs.
Propelling Factors for Enterprise Routers Industry Growth
Several factors propel the growth of the Enterprise Routers industry. Technological advancements such as 5G, SDN, and NFV are significantly improving network capabilities. The growing adoption of cloud computing and IoT is driving demand for sophisticated networking solutions. Favorable regulatory environments that encourage digital transformation are also fueling growth. Government initiatives in several countries aiming to foster innovation in telecommunications infrastructure further strengthen this momentum.
Obstacles in the Enterprise Routers Industry Market
The industry faces challenges such as increasing complexity in network management, concerns about cybersecurity threats, and potential supply chain disruptions. The high cost of implementation and maintenance can also hinder adoption in certain markets. Intense competition from established and emerging players and the need to address new security challenges are key obstacles. The impact of these factors is estimated to reduce the market's CAGR by approximately XX% over the next few years.
Future Opportunities in Enterprise Routers Industry
Emerging opportunities lie in the expansion of 5G networks, the growth of edge computing, and the increasing demand for secure and reliable network infrastructure in diverse industries like healthcare and manufacturing. The development of innovative solutions incorporating AI and machine learning for network automation and optimization will further present significant opportunities. Moreover, specialized routers designed for specific industry needs, such as industrial IoT (IIoT) or healthcare environments, are expected to gain market share.
Major Players in the Enterprise Routers Industry Ecosystem
- Riverbed Technology Inc
- Hewlett Packard Enterprise Co
- Nokia Networks Corporation
- Cisco Systems Inc
- Juniper Networks Inc
- Avaya Inc
- Dell Inc
- Alcatel-Lucent S A
- Huawei Technologies Co Ltd
- ZTE Corporation
Key Developments in Enterprise Routers Industry Industry
- March 2023: Cisco announced patches for a high-severity denial-of-service vulnerability (CVE-2023-20049) affecting IOS XR software for ASR 9000 routers. This highlights the ongoing importance of robust security measures.
- January 2023: ZTE Corporation released its 5G flagship CPE MC888 PRO, showcasing advancements in wireless connectivity and expanding the reach of high-speed networks into various sectors.
Strategic Enterprise Routers Industry Market Forecast
The Enterprise Routers market is poised for sustained growth, driven by ongoing technological advancements, rising demand for high-bandwidth connectivity, and increasing adoption of cloud computing and IoT. The expansion of 5G networks, the emergence of edge computing, and the increasing focus on cybersecurity will create significant opportunities for growth in the forecast period. The market is expected to witness considerable expansion across various regions and segments, demonstrating a strong growth potential throughout the forecast period (2025-2033).
Enterprise Routers Industry Segmentation
-
1. Type of Connectivity
- 1.1. Wired
- 1.2. Wireless
-
2. Type of Port
- 2.1. Fixed Port
- 2.2. Modular
-
3. Type
- 3.1. Core Routers
- 3.2. Multi-Services Edge
- 3.3. Access Router
- 3.4. Other Types
-
4. End-user Vertical
- 4.1. BFSI
- 4.2. IT & Telecom
- 4.3. Healthcare
- 4.4. Retail
- 4.5. Manufacturing
- 4.6. Other End-user Verticals
Enterprise Routers Industry Segmentation By Geography
- 1. North America
- 2. Europe
- 3. Asia
- 4. Australia and New Zealand
- 5. Latin America
Enterprise Routers Industry REPORT HIGHLIGHTS
| Aspects | Details |
|---|---|
| Study Period | 2019-2033 |
| Base Year | 2024 |
| Estimated Year | 2025 |
| Forecast Period | 2025-2033 |
| Historical Period | 2019-2024 |
| Growth Rate | CAGR of 7.49% from 2019-2033 |
| Segmentation |
|
Table of Contents
- 1. Introduction
- 1.1. Research Scope
- 1.2. Market Segmentation
- 1.3. Research Methodology
- 1.4. Definitions and Assumptions
- 2. Executive Summary
- 2.1. Introduction
- 3. Market Dynamics
- 3.1. Introduction
- 3.2. Market Drivers
- 3.2.1. Increasing Network Virtualization; Rapid Growth in IP Traffic Enterprise
- 3.3. Market Restrains
- 3.3.1. Security and Privacy Concerns
- 3.4. Market Trends
- 3.4.1. Wireless Connectivity is Expected to Hold Major Share
- 4. Market Factor Analysis
- 4.1. Porters Five Forces
- 4.2. Supply/Value Chain
- 4.3. PESTEL analysis
- 4.4. Market Entropy
- 4.5. Patent/Trademark Analysis
- 5. Global Enterprise Routers Industry Analysis, Insights and Forecast, 2019-2031
- 5.1. Market Analysis, Insights and Forecast - by Type of Connectivity
- 5.1.1. Wired
- 5.1.2. Wireless
- 5.2. Market Analysis, Insights and Forecast - by Type of Port
- 5.2.1. Fixed Port
- 5.2.2. Modular
- 5.3. Market Analysis, Insights and Forecast - by Type
- 5.3.1. Core Routers
- 5.3.2. Multi-Services Edge
- 5.3.3. Access Router
- 5.3.4. Other Types
- 5.4. Market Analysis, Insights and Forecast - by End-user Vertical
- 5.4.1. BFSI
- 5.4.2. IT & Telecom
- 5.4.3. Healthcare
- 5.4.4. Retail
- 5.4.5. Manufacturing
- 5.4.6. Other End-user Verticals
- 5.5. Market Analysis, Insights and Forecast - by Region
- 5.5.1. North America
- 5.5.2. Europe
- 5.5.3. Asia
- 5.5.4. Australia and New Zealand
- 5.5.5. Latin America
- 5.1. Market Analysis, Insights and Forecast - by Type of Connectivity
- 6. North America Enterprise Routers Industry Analysis, Insights and Forecast, 2019-2031
- 6.1. Market Analysis, Insights and Forecast - by Type of Connectivity
- 6.1.1. Wired
- 6.1.2. Wireless
- 6.2. Market Analysis, Insights and Forecast - by Type of Port
- 6.2.1. Fixed Port
- 6.2.2. Modular
- 6.3. Market Analysis, Insights and Forecast - by Type
- 6.3.1. Core Routers
- 6.3.2. Multi-Services Edge
- 6.3.3. Access Router
- 6.3.4. Other Types
- 6.4. Market Analysis, Insights and Forecast - by End-user Vertical
- 6.4.1. BFSI
- 6.4.2. IT & Telecom
- 6.4.3. Healthcare
- 6.4.4. Retail
- 6.4.5. Manufacturing
- 6.4.6. Other End-user Verticals
- 6.1. Market Analysis, Insights and Forecast - by Type of Connectivity
- 7. Europe Enterprise Routers Industry Analysis, Insights and Forecast, 2019-2031
- 7.1. Market Analysis, Insights and Forecast - by Type of Connectivity
- 7.1.1. Wired
- 7.1.2. Wireless
- 7.2. Market Analysis, Insights and Forecast - by Type of Port
- 7.2.1. Fixed Port
- 7.2.2. Modular
- 7.3. Market Analysis, Insights and Forecast - by Type
- 7.3.1. Core Routers
- 7.3.2. Multi-Services Edge
- 7.3.3. Access Router
- 7.3.4. Other Types
- 7.4. Market Analysis, Insights and Forecast - by End-user Vertical
- 7.4.1. BFSI
- 7.4.2. IT & Telecom
- 7.4.3. Healthcare
- 7.4.4. Retail
- 7.4.5. Manufacturing
- 7.4.6. Other End-user Verticals
- 7.1. Market Analysis, Insights and Forecast - by Type of Connectivity
- 8. Asia Enterprise Routers Industry Analysis, Insights and Forecast, 2019-2031
- 8.1. Market Analysis, Insights and Forecast - by Type of Connectivity
- 8.1.1. Wired
- 8.1.2. Wireless
- 8.2. Market Analysis, Insights and Forecast - by Type of Port
- 8.2.1. Fixed Port
- 8.2.2. Modular
- 8.3. Market Analysis, Insights and Forecast - by Type
- 8.3.1. Core Routers
- 8.3.2. Multi-Services Edge
- 8.3.3. Access Router
- 8.3.4. Other Types
- 8.4. Market Analysis, Insights and Forecast - by End-user Vertical
- 8.4.1. BFSI
- 8.4.2. IT & Telecom
- 8.4.3. Healthcare
- 8.4.4. Retail
- 8.4.5. Manufacturing
- 8.4.6. Other End-user Verticals
- 8.1. Market Analysis, Insights and Forecast - by Type of Connectivity
- 9. Australia and New Zealand Enterprise Routers Industry Analysis, Insights and Forecast, 2019-2031
- 9.1. Market Analysis, Insights and Forecast - by Type of Connectivity
- 9.1.1. Wired
- 9.1.2. Wireless
- 9.2. Market Analysis, Insights and Forecast - by Type of Port
- 9.2.1. Fixed Port
- 9.2.2. Modular
- 9.3. Market Analysis, Insights and Forecast - by Type
- 9.3.1. Core Routers
- 9.3.2. Multi-Services Edge
- 9.3.3. Access Router
- 9.3.4. Other Types
- 9.4. Market Analysis, Insights and Forecast - by End-user Vertical
- 9.4.1. BFSI
- 9.4.2. IT & Telecom
- 9.4.3. Healthcare
- 9.4.4. Retail
- 9.4.5. Manufacturing
- 9.4.6. Other End-user Verticals
- 9.1. Market Analysis, Insights and Forecast - by Type of Connectivity
- 10. Latin America Enterprise Routers Industry Analysis, Insights and Forecast, 2019-2031
- 10.1. Market Analysis, Insights and Forecast - by Type of Connectivity
- 10.1.1. Wired
- 10.1.2. Wireless
- 10.2. Market Analysis, Insights and Forecast - by Type of Port
- 10.2.1. Fixed Port
- 10.2.2. Modular
- 10.3. Market Analysis, Insights and Forecast - by Type
- 10.3.1. Core Routers
- 10.3.2. Multi-Services Edge
- 10.3.3. Access Router
- 10.3.4. Other Types
- 10.4. Market Analysis, Insights and Forecast - by End-user Vertical
- 10.4.1. BFSI
- 10.4.2. IT & Telecom
- 10.4.3. Healthcare
- 10.4.4. Retail
- 10.4.5. Manufacturing
- 10.4.6. Other End-user Verticals
- 10.1. Market Analysis, Insights and Forecast - by Type of Connectivity
- 11. North America Enterprise Routers Industry Analysis, Insights and Forecast, 2019-2031
- 11.1. Market Analysis, Insights and Forecast - By Country/Sub-region
- 11.1.1 United States
- 11.1.2 Canada
- 11.1.3 Mexico
- 12. Europe Enterprise Routers Industry Analysis, Insights and Forecast, 2019-2031
- 12.1. Market Analysis, Insights and Forecast - By Country/Sub-region
- 12.1.1 Germany
- 12.1.2 United Kingdom
- 12.1.3 France
- 12.1.4 Spain
- 12.1.5 Italy
- 12.1.6 Spain
- 12.1.7 Belgium
- 12.1.8 Netherland
- 12.1.9 Nordics
- 12.1.10 Rest of Europe
- 13. Asia Pacific Enterprise Routers Industry Analysis, Insights and Forecast, 2019-2031
- 13.1. Market Analysis, Insights and Forecast - By Country/Sub-region
- 13.1.1 China
- 13.1.2 Japan
- 13.1.3 India
- 13.1.4 South Korea
- 13.1.5 Southeast Asia
- 13.1.6 Australia
- 13.1.7 Indonesia
- 13.1.8 Phillipes
- 13.1.9 Singapore
- 13.1.10 Thailandc
- 13.1.11 Rest of Asia Pacific
- 14. South America Enterprise Routers Industry Analysis, Insights and Forecast, 2019-2031
- 14.1. Market Analysis, Insights and Forecast - By Country/Sub-region
- 14.1.1 Brazil
- 14.1.2 Argentina
- 14.1.3 Peru
- 14.1.4 Chile
- 14.1.5 Colombia
- 14.1.6 Ecuador
- 14.1.7 Venezuela
- 14.1.8 Rest of South America
- 15. North America Enterprise Routers Industry Analysis, Insights and Forecast, 2019-2031
- 15.1. Market Analysis, Insights and Forecast - By Country/Sub-region
- 15.1.1 United States
- 15.1.2 Canada
- 15.1.3 Mexico
- 16. MEA Enterprise Routers Industry Analysis, Insights and Forecast, 2019-2031
- 16.1. Market Analysis, Insights and Forecast - By Country/Sub-region
- 16.1.1 United Arab Emirates
- 16.1.2 Saudi Arabia
- 16.1.3 South Africa
- 16.1.4 Rest of Middle East and Africa
- 17. Competitive Analysis
- 17.1. Global Market Share Analysis 2024
- 17.2. Company Profiles
- 17.2.1 Riverbed Technology Inc
- 17.2.1.1. Overview
- 17.2.1.2. Products
- 17.2.1.3. SWOT Analysis
- 17.2.1.4. Recent Developments
- 17.2.1.5. Financials (Based on Availability)
- 17.2.2 Hewlett Packard Enterprise Co
- 17.2.2.1. Overview
- 17.2.2.2. Products
- 17.2.2.3. SWOT Analysis
- 17.2.2.4. Recent Developments
- 17.2.2.5. Financials (Based on Availability)
- 17.2.3 Nokia Networks Corporation
- 17.2.3.1. Overview
- 17.2.3.2. Products
- 17.2.3.3. SWOT Analysis
- 17.2.3.4. Recent Developments
- 17.2.3.5. Financials (Based on Availability)
- 17.2.4 Cisco Systems Inc
- 17.2.4.1. Overview
- 17.2.4.2. Products
- 17.2.4.3. SWOT Analysis
- 17.2.4.4. Recent Developments
- 17.2.4.5. Financials (Based on Availability)
- 17.2.5 Juniper Networks Inc
- 17.2.5.1. Overview
- 17.2.5.2. Products
- 17.2.5.3. SWOT Analysis
- 17.2.5.4. Recent Developments
- 17.2.5.5. Financials (Based on Availability)
- 17.2.6 Avaya Inc
- 17.2.6.1. Overview
- 17.2.6.2. Products
- 17.2.6.3. SWOT Analysis
- 17.2.6.4. Recent Developments
- 17.2.6.5. Financials (Based on Availability)
- 17.2.7 Dell Inc
- 17.2.7.1. Overview
- 17.2.7.2. Products
- 17.2.7.3. SWOT Analysis
- 17.2.7.4. Recent Developments
- 17.2.7.5. Financials (Based on Availability)
- 17.2.8 Alcatel-Lucent S A
- 17.2.8.1. Overview
- 17.2.8.2. Products
- 17.2.8.3. SWOT Analysis
- 17.2.8.4. Recent Developments
- 17.2.8.5. Financials (Based on Availability)
- 17.2.9 Huawei Technologies Co Ltd
- 17.2.9.1. Overview
- 17.2.9.2. Products
- 17.2.9.3. SWOT Analysis
- 17.2.9.4. Recent Developments
- 17.2.9.5. Financials (Based on Availability)
- 17.2.10 ZTE Corporation
- 17.2.10.1. Overview
- 17.2.10.2. Products
- 17.2.10.3. SWOT Analysis
- 17.2.10.4. Recent Developments
- 17.2.10.5. Financials (Based on Availability)
- 17.2.1 Riverbed Technology Inc
List of Figures
- Figure 1: Global Enterprise Routers Industry Revenue Breakdown (Million, %) by Region 2024 & 2032
- Figure 2: Global Enterprise Routers Industry Volume Breakdown (K Unit, %) by Region 2024 & 2032
- Figure 3: North America Enterprise Routers Industry Revenue (Million), by Country 2024 & 2032
- Figure 4: North America Enterprise Routers Industry Volume (K Unit), by Country 2024 & 2032
- Figure 5: North America Enterprise Routers Industry Revenue Share (%), by Country 2024 & 2032
- Figure 6: North America Enterprise Routers Industry Volume Share (%), by Country 2024 & 2032
- Figure 7: Europe Enterprise Routers Industry Revenue (Million), by Country 2024 & 2032
- Figure 8: Europe Enterprise Routers Industry Volume (K Unit), by Country 2024 & 2032
- Figure 9: Europe Enterprise Routers Industry Revenue Share (%), by Country 2024 & 2032
- Figure 10: Europe Enterprise Routers Industry Volume Share (%), by Country 2024 & 2032
- Figure 11: Asia Pacific Enterprise Routers Industry Revenue (Million), by Country 2024 & 2032
- Figure 12: Asia Pacific Enterprise Routers Industry Volume (K Unit), by Country 2024 & 2032
- Figure 13: Asia Pacific Enterprise Routers Industry Revenue Share (%), by Country 2024 & 2032
- Figure 14: Asia Pacific Enterprise Routers Industry Volume Share (%), by Country 2024 & 2032
- Figure 15: South America Enterprise Routers Industry Revenue (Million), by Country 2024 & 2032
- Figure 16: South America Enterprise Routers Industry Volume (K Unit), by Country 2024 & 2032
- Figure 17: South America Enterprise Routers Industry Revenue Share (%), by Country 2024 & 2032
- Figure 18: South America Enterprise Routers Industry Volume Share (%), by Country 2024 & 2032
- Figure 19: North America Enterprise Routers Industry Revenue (Million), by Country 2024 & 2032
- Figure 20: North America Enterprise Routers Industry Volume (K Unit), by Country 2024 & 2032
- Figure 21: North America Enterprise Routers Industry Revenue Share (%), by Country 2024 & 2032
- Figure 22: North America Enterprise Routers Industry Volume Share (%), by Country 2024 & 2032
- Figure 23: MEA Enterprise Routers Industry Revenue (Million), by Country 2024 & 2032
- Figure 24: MEA Enterprise Routers Industry Volume (K Unit), by Country 2024 & 2032
- Figure 25: MEA Enterprise Routers Industry Revenue Share (%), by Country 2024 & 2032
- Figure 26: MEA Enterprise Routers Industry Volume Share (%), by Country 2024 & 2032
- Figure 27: North America Enterprise Routers Industry Revenue (Million), by Type of Connectivity 2024 & 2032
- Figure 28: North America Enterprise Routers Industry Volume (K Unit), by Type of Connectivity 2024 & 2032
- Figure 29: North America Enterprise Routers Industry Revenue Share (%), by Type of Connectivity 2024 & 2032
- Figure 30: North America Enterprise Routers Industry Volume Share (%), by Type of Connectivity 2024 & 2032
- Figure 31: North America Enterprise Routers Industry Revenue (Million), by Type of Port 2024 & 2032
- Figure 32: North America Enterprise Routers Industry Volume (K Unit), by Type of Port 2024 & 2032
- Figure 33: North America Enterprise Routers Industry Revenue Share (%), by Type of Port 2024 & 2032
- Figure 34: North America Enterprise Routers Industry Volume Share (%), by Type of Port 2024 & 2032
- Figure 35: North America Enterprise Routers Industry Revenue (Million), by Type 2024 & 2032
- Figure 36: North America Enterprise Routers Industry Volume (K Unit), by Type 2024 & 2032
- Figure 37: North America Enterprise Routers Industry Revenue Share (%), by Type 2024 & 2032
- Figure 38: North America Enterprise Routers Industry Volume Share (%), by Type 2024 & 2032
- Figure 39: North America Enterprise Routers Industry Revenue (Million), by End-user Vertical 2024 & 2032
- Figure 40: North America Enterprise Routers Industry Volume (K Unit), by End-user Vertical 2024 & 2032
- Figure 41: North America Enterprise Routers Industry Revenue Share (%), by End-user Vertical 2024 & 2032
- Figure 42: North America Enterprise Routers Industry Volume Share (%), by End-user Vertical 2024 & 2032
- Figure 43: North America Enterprise Routers Industry Revenue (Million), by Country 2024 & 2032
- Figure 44: North America Enterprise Routers Industry Volume (K Unit), by Country 2024 & 2032
- Figure 45: North America Enterprise Routers Industry Revenue Share (%), by Country 2024 & 2032
- Figure 46: North America Enterprise Routers Industry Volume Share (%), by Country 2024 & 2032
- Figure 47: Europe Enterprise Routers Industry Revenue (Million), by Type of Connectivity 2024 & 2032
- Figure 48: Europe Enterprise Routers Industry Volume (K Unit), by Type of Connectivity 2024 & 2032
- Figure 49: Europe Enterprise Routers Industry Revenue Share (%), by Type of Connectivity 2024 & 2032
- Figure 50: Europe Enterprise Routers Industry Volume Share (%), by Type of Connectivity 2024 & 2032
- Figure 51: Europe Enterprise Routers Industry Revenue (Million), by Type of Port 2024 & 2032
- Figure 52: Europe Enterprise Routers Industry Volume (K Unit), by Type of Port 2024 & 2032
- Figure 53: Europe Enterprise Routers Industry Revenue Share (%), by Type of Port 2024 & 2032
- Figure 54: Europe Enterprise Routers Industry Volume Share (%), by Type of Port 2024 & 2032
- Figure 55: Europe Enterprise Routers Industry Revenue (Million), by Type 2024 & 2032
- Figure 56: Europe Enterprise Routers Industry Volume (K Unit), by Type 2024 & 2032
- Figure 57: Europe Enterprise Routers Industry Revenue Share (%), by Type 2024 & 2032
- Figure 58: Europe Enterprise Routers Industry Volume Share (%), by Type 2024 & 2032
- Figure 59: Europe Enterprise Routers Industry Revenue (Million), by End-user Vertical 2024 & 2032
- Figure 60: Europe Enterprise Routers Industry Volume (K Unit), by End-user Vertical 2024 & 2032
- Figure 61: Europe Enterprise Routers Industry Revenue Share (%), by End-user Vertical 2024 & 2032
- Figure 62: Europe Enterprise Routers Industry Volume Share (%), by End-user Vertical 2024 & 2032
- Figure 63: Europe Enterprise Routers Industry Revenue (Million), by Country 2024 & 2032
- Figure 64: Europe Enterprise Routers Industry Volume (K Unit), by Country 2024 & 2032
- Figure 65: Europe Enterprise Routers Industry Revenue Share (%), by Country 2024 & 2032
- Figure 66: Europe Enterprise Routers Industry Volume Share (%), by Country 2024 & 2032
- Figure 67: Asia Enterprise Routers Industry Revenue (Million), by Type of Connectivity 2024 & 2032
- Figure 68: Asia Enterprise Routers Industry Volume (K Unit), by Type of Connectivity 2024 & 2032
- Figure 69: Asia Enterprise Routers Industry Revenue Share (%), by Type of Connectivity 2024 & 2032
- Figure 70: Asia Enterprise Routers Industry Volume Share (%), by Type of Connectivity 2024 & 2032
- Figure 71: Asia Enterprise Routers Industry Revenue (Million), by Type of Port 2024 & 2032
- Figure 72: Asia Enterprise Routers Industry Volume (K Unit), by Type of Port 2024 & 2032
- Figure 73: Asia Enterprise Routers Industry Revenue Share (%), by Type of Port 2024 & 2032
- Figure 74: Asia Enterprise Routers Industry Volume Share (%), by Type of Port 2024 & 2032
- Figure 75: Asia Enterprise Routers Industry Revenue (Million), by Type 2024 & 2032
- Figure 76: Asia Enterprise Routers Industry Volume (K Unit), by Type 2024 & 2032
- Figure 77: Asia Enterprise Routers Industry Revenue Share (%), by Type 2024 & 2032
- Figure 78: Asia Enterprise Routers Industry Volume Share (%), by Type 2024 & 2032
- Figure 79: Asia Enterprise Routers Industry Revenue (Million), by End-user Vertical 2024 & 2032
- Figure 80: Asia Enterprise Routers Industry Volume (K Unit), by End-user Vertical 2024 & 2032
- Figure 81: Asia Enterprise Routers Industry Revenue Share (%), by End-user Vertical 2024 & 2032
- Figure 82: Asia Enterprise Routers Industry Volume Share (%), by End-user Vertical 2024 & 2032
- Figure 83: Asia Enterprise Routers Industry Revenue (Million), by Country 2024 & 2032
- Figure 84: Asia Enterprise Routers Industry Volume (K Unit), by Country 2024 & 2032
- Figure 85: Asia Enterprise Routers Industry Revenue Share (%), by Country 2024 & 2032
- Figure 86: Asia Enterprise Routers Industry Volume Share (%), by Country 2024 & 2032
- Figure 87: Australia and New Zealand Enterprise Routers Industry Revenue (Million), by Type of Connectivity 2024 & 2032
- Figure 88: Australia and New Zealand Enterprise Routers Industry Volume (K Unit), by Type of Connectivity 2024 & 2032
- Figure 89: Australia and New Zealand Enterprise Routers Industry Revenue Share (%), by Type of Connectivity 2024 & 2032
- Figure 90: Australia and New Zealand Enterprise Routers Industry Volume Share (%), by Type of Connectivity 2024 & 2032
- Figure 91: Australia and New Zealand Enterprise Routers Industry Revenue (Million), by Type of Port 2024 & 2032
- Figure 92: Australia and New Zealand Enterprise Routers Industry Volume (K Unit), by Type of Port 2024 & 2032
- Figure 93: Australia and New Zealand Enterprise Routers Industry Revenue Share (%), by Type of Port 2024 & 2032
- Figure 94: Australia and New Zealand Enterprise Routers Industry Volume Share (%), by Type of Port 2024 & 2032
- Figure 95: Australia and New Zealand Enterprise Routers Industry Revenue (Million), by Type 2024 & 2032
- Figure 96: Australia and New Zealand Enterprise Routers Industry Volume (K Unit), by Type 2024 & 2032
- Figure 97: Australia and New Zealand Enterprise Routers Industry Revenue Share (%), by Type 2024 & 2032
- Figure 98: Australia and New Zealand Enterprise Routers Industry Volume Share (%), by Type 2024 & 2032
- Figure 99: Australia and New Zealand Enterprise Routers Industry Revenue (Million), by End-user Vertical 2024 & 2032
- Figure 100: Australia and New Zealand Enterprise Routers Industry Volume (K Unit), by End-user Vertical 2024 & 2032
- Figure 101: Australia and New Zealand Enterprise Routers Industry Revenue Share (%), by End-user Vertical 2024 & 2032
- Figure 102: Australia and New Zealand Enterprise Routers Industry Volume Share (%), by End-user Vertical 2024 & 2032
- Figure 103: Australia and New Zealand Enterprise Routers Industry Revenue (Million), by Country 2024 & 2032
- Figure 104: Australia and New Zealand Enterprise Routers Industry Volume (K Unit), by Country 2024 & 2032
- Figure 105: Australia and New Zealand Enterprise Routers Industry Revenue Share (%), by Country 2024 & 2032
- Figure 106: Australia and New Zealand Enterprise Routers Industry Volume Share (%), by Country 2024 & 2032
- Figure 107: Latin America Enterprise Routers Industry Revenue (Million), by Type of Connectivity 2024 & 2032
- Figure 108: Latin America Enterprise Routers Industry Volume (K Unit), by Type of Connectivity 2024 & 2032
- Figure 109: Latin America Enterprise Routers Industry Revenue Share (%), by Type of Connectivity 2024 & 2032
- Figure 110: Latin America Enterprise Routers Industry Volume Share (%), by Type of Connectivity 2024 & 2032
- Figure 111: Latin America Enterprise Routers Industry Revenue (Million), by Type of Port 2024 & 2032
- Figure 112: Latin America Enterprise Routers Industry Volume (K Unit), by Type of Port 2024 & 2032
- Figure 113: Latin America Enterprise Routers Industry Revenue Share (%), by Type of Port 2024 & 2032
- Figure 114: Latin America Enterprise Routers Industry Volume Share (%), by Type of Port 2024 & 2032
- Figure 115: Latin America Enterprise Routers Industry Revenue (Million), by Type 2024 & 2032
- Figure 116: Latin America Enterprise Routers Industry Volume (K Unit), by Type 2024 & 2032
- Figure 117: Latin America Enterprise Routers Industry Revenue Share (%), by Type 2024 & 2032
- Figure 118: Latin America Enterprise Routers Industry Volume Share (%), by Type 2024 & 2032
- Figure 119: Latin America Enterprise Routers Industry Revenue (Million), by End-user Vertical 2024 & 2032
- Figure 120: Latin America Enterprise Routers Industry Volume (K Unit), by End-user Vertical 2024 & 2032
- Figure 121: Latin America Enterprise Routers Industry Revenue Share (%), by End-user Vertical 2024 & 2032
- Figure 122: Latin America Enterprise Routers Industry Volume Share (%), by End-user Vertical 2024 & 2032
- Figure 123: Latin America Enterprise Routers Industry Revenue (Million), by Country 2024 & 2032
- Figure 124: Latin America Enterprise Routers Industry Volume (K Unit), by Country 2024 & 2032
- Figure 125: Latin America Enterprise Routers Industry Revenue Share (%), by Country 2024 & 2032
- Figure 126: Latin America Enterprise Routers Industry Volume Share (%), by Country 2024 & 2032
List of Tables
- Table 1: Global Enterprise Routers Industry Revenue Million Forecast, by Region 2019 & 2032
- Table 2: Global Enterprise Routers Industry Volume K Unit Forecast, by Region 2019 & 2032
- Table 3: Global Enterprise Routers Industry Revenue Million Forecast, by Type of Connectivity 2019 & 2032
- Table 4: Global Enterprise Routers Industry Volume K Unit Forecast, by Type of Connectivity 2019 & 2032
- Table 5: Global Enterprise Routers Industry Revenue Million Forecast, by Type of Port 2019 & 2032
- Table 6: Global Enterprise Routers Industry Volume K Unit Forecast, by Type of Port 2019 & 2032
- Table 7: Global Enterprise Routers Industry Revenue Million Forecast, by Type 2019 & 2032
- Table 8: Global Enterprise Routers Industry Volume K Unit Forecast, by Type 2019 & 2032
- Table 9: Global Enterprise Routers Industry Revenue Million Forecast, by End-user Vertical 2019 & 2032
- Table 10: Global Enterprise Routers Industry Volume K Unit Forecast, by End-user Vertical 2019 & 2032
- Table 11: Global Enterprise Routers Industry Revenue Million Forecast, by Region 2019 & 2032
- Table 12: Global Enterprise Routers Industry Volume K Unit Forecast, by Region 2019 & 2032
- Table 13: Global Enterprise Routers Industry Revenue Million Forecast, by Country 2019 & 2032
- Table 14: Global Enterprise Routers Industry Volume K Unit Forecast, by Country 2019 & 2032
- Table 15: United States Enterprise Routers Industry Revenue (Million) Forecast, by Application 2019 & 2032
- Table 16: United States Enterprise Routers Industry Volume (K Unit) Forecast, by Application 2019 & 2032
- Table 17: Canada Enterprise Routers Industry Revenue (Million) Forecast, by Application 2019 & 2032
- Table 18: Canada Enterprise Routers Industry Volume (K Unit) Forecast, by Application 2019 & 2032
- Table 19: Mexico Enterprise Routers Industry Revenue (Million) Forecast, by Application 2019 & 2032
- Table 20: Mexico Enterprise Routers Industry Volume (K Unit) Forecast, by Application 2019 & 2032
- Table 21: Global Enterprise Routers Industry Revenue Million Forecast, by Country 2019 & 2032
- Table 22: Global Enterprise Routers Industry Volume K Unit Forecast, by Country 2019 & 2032
- Table 23: Germany Enterprise Routers Industry Revenue (Million) Forecast, by Application 2019 & 2032
- Table 24: Germany Enterprise Routers Industry Volume (K Unit) Forecast, by Application 2019 & 2032
- Table 25: United Kingdom Enterprise Routers Industry Revenue (Million) Forecast, by Application 2019 & 2032
- Table 26: United Kingdom Enterprise Routers Industry Volume (K Unit) Forecast, by Application 2019 & 2032
- Table 27: France Enterprise Routers Industry Revenue (Million) Forecast, by Application 2019 & 2032
- Table 28: France Enterprise Routers Industry Volume (K Unit) Forecast, by Application 2019 & 2032
- Table 29: Spain Enterprise Routers Industry Revenue (Million) Forecast, by Application 2019 & 2032
- Table 30: Spain Enterprise Routers Industry Volume (K Unit) Forecast, by Application 2019 & 2032
- Table 31: Italy Enterprise Routers Industry Revenue (Million) Forecast, by Application 2019 & 2032
- Table 32: Italy Enterprise Routers Industry Volume (K Unit) Forecast, by Application 2019 & 2032
- Table 33: Spain Enterprise Routers Industry Revenue (Million) Forecast, by Application 2019 & 2032
- Table 34: Spain Enterprise Routers Industry Volume (K Unit) Forecast, by Application 2019 & 2032
- Table 35: Belgium Enterprise Routers Industry Revenue (Million) Forecast, by Application 2019 & 2032
- Table 36: Belgium Enterprise Routers Industry Volume (K Unit) Forecast, by Application 2019 & 2032
- Table 37: Netherland Enterprise Routers Industry Revenue (Million) Forecast, by Application 2019 & 2032
- Table 38: Netherland Enterprise Routers Industry Volume (K Unit) Forecast, by Application 2019 & 2032
- Table 39: Nordics Enterprise Routers Industry Revenue (Million) Forecast, by Application 2019 & 2032
- Table 40: Nordics Enterprise Routers Industry Volume (K Unit) Forecast, by Application 2019 & 2032
- Table 41: Rest of Europe Enterprise Routers Industry Revenue (Million) Forecast, by Application 2019 & 2032
- Table 42: Rest of Europe Enterprise Routers Industry Volume (K Unit) Forecast, by Application 2019 & 2032
- Table 43: Global Enterprise Routers Industry Revenue Million Forecast, by Country 2019 & 2032
- Table 44: Global Enterprise Routers Industry Volume K Unit Forecast, by Country 2019 & 2032
- Table 45: China Enterprise Routers Industry Revenue (Million) Forecast, by Application 2019 & 2032
- Table 46: China Enterprise Routers Industry Volume (K Unit) Forecast, by Application 2019 & 2032
- Table 47: Japan Enterprise Routers Industry Revenue (Million) Forecast, by Application 2019 & 2032
- Table 48: Japan Enterprise Routers Industry Volume (K Unit) Forecast, by Application 2019 & 2032
- Table 49: India Enterprise Routers Industry Revenue (Million) Forecast, by Application 2019 & 2032
- Table 50: India Enterprise Routers Industry Volume (K Unit) Forecast, by Application 2019 & 2032
- Table 51: South Korea Enterprise Routers Industry Revenue (Million) Forecast, by Application 2019 & 2032
- Table 52: South Korea Enterprise Routers Industry Volume (K Unit) Forecast, by Application 2019 & 2032
- Table 53: Southeast Asia Enterprise Routers Industry Revenue (Million) Forecast, by Application 2019 & 2032
- Table 54: Southeast Asia Enterprise Routers Industry Volume (K Unit) Forecast, by Application 2019 & 2032
- Table 55: Australia Enterprise Routers Industry Revenue (Million) Forecast, by Application 2019 & 2032
- Table 56: Australia Enterprise Routers Industry Volume (K Unit) Forecast, by Application 2019 & 2032
- Table 57: Indonesia Enterprise Routers Industry Revenue (Million) Forecast, by Application 2019 & 2032
- Table 58: Indonesia Enterprise Routers Industry Volume (K Unit) Forecast, by Application 2019 & 2032
- Table 59: Phillipes Enterprise Routers Industry Revenue (Million) Forecast, by Application 2019 & 2032
- Table 60: Phillipes Enterprise Routers Industry Volume (K Unit) Forecast, by Application 2019 & 2032
- Table 61: Singapore Enterprise Routers Industry Revenue (Million) Forecast, by Application 2019 & 2032
- Table 62: Singapore Enterprise Routers Industry Volume (K Unit) Forecast, by Application 2019 & 2032
- Table 63: Thailandc Enterprise Routers Industry Revenue (Million) Forecast, by Application 2019 & 2032
- Table 64: Thailandc Enterprise Routers Industry Volume (K Unit) Forecast, by Application 2019 & 2032
- Table 65: Rest of Asia Pacific Enterprise Routers Industry Revenue (Million) Forecast, by Application 2019 & 2032
- Table 66: Rest of Asia Pacific Enterprise Routers Industry Volume (K Unit) Forecast, by Application 2019 & 2032
- Table 67: Global Enterprise Routers Industry Revenue Million Forecast, by Country 2019 & 2032
- Table 68: Global Enterprise Routers Industry Volume K Unit Forecast, by Country 2019 & 2032
- Table 69: Brazil Enterprise Routers Industry Revenue (Million) Forecast, by Application 2019 & 2032
- Table 70: Brazil Enterprise Routers Industry Volume (K Unit) Forecast, by Application 2019 & 2032
- Table 71: Argentina Enterprise Routers Industry Revenue (Million) Forecast, by Application 2019 & 2032
- Table 72: Argentina Enterprise Routers Industry Volume (K Unit) Forecast, by Application 2019 & 2032
- Table 73: Peru Enterprise Routers Industry Revenue (Million) Forecast, by Application 2019 & 2032
- Table 74: Peru Enterprise Routers Industry Volume (K Unit) Forecast, by Application 2019 & 2032
- Table 75: Chile Enterprise Routers Industry Revenue (Million) Forecast, by Application 2019 & 2032
- Table 76: Chile Enterprise Routers Industry Volume (K Unit) Forecast, by Application 2019 & 2032
- Table 77: Colombia Enterprise Routers Industry Revenue (Million) Forecast, by Application 2019 & 2032
- Table 78: Colombia Enterprise Routers Industry Volume (K Unit) Forecast, by Application 2019 & 2032
- Table 79: Ecuador Enterprise Routers Industry Revenue (Million) Forecast, by Application 2019 & 2032
- Table 80: Ecuador Enterprise Routers Industry Volume (K Unit) Forecast, by Application 2019 & 2032
- Table 81: Venezuela Enterprise Routers Industry Revenue (Million) Forecast, by Application 2019 & 2032
- Table 82: Venezuela Enterprise Routers Industry Volume (K Unit) Forecast, by Application 2019 & 2032
- Table 83: Rest of South America Enterprise Routers Industry Revenue (Million) Forecast, by Application 2019 & 2032
- Table 84: Rest of South America Enterprise Routers Industry Volume (K Unit) Forecast, by Application 2019 & 2032
- Table 85: Global Enterprise Routers Industry Revenue Million Forecast, by Country 2019 & 2032
- Table 86: Global Enterprise Routers Industry Volume K Unit Forecast, by Country 2019 & 2032
- Table 87: United States Enterprise Routers Industry Revenue (Million) Forecast, by Application 2019 & 2032
- Table 88: United States Enterprise Routers Industry Volume (K Unit) Forecast, by Application 2019 & 2032
- Table 89: Canada Enterprise Routers Industry Revenue (Million) Forecast, by Application 2019 & 2032
- Table 90: Canada Enterprise Routers Industry Volume (K Unit) Forecast, by Application 2019 & 2032
- Table 91: Mexico Enterprise Routers Industry Revenue (Million) Forecast, by Application 2019 & 2032
- Table 92: Mexico Enterprise Routers Industry Volume (K Unit) Forecast, by Application 2019 & 2032
- Table 93: Global Enterprise Routers Industry Revenue Million Forecast, by Country 2019 & 2032
- Table 94: Global Enterprise Routers Industry Volume K Unit Forecast, by Country 2019 & 2032
- Table 95: United Arab Emirates Enterprise Routers Industry Revenue (Million) Forecast, by Application 2019 & 2032
- Table 96: United Arab Emirates Enterprise Routers Industry Volume (K Unit) Forecast, by Application 2019 & 2032
- Table 97: Saudi Arabia Enterprise Routers Industry Revenue (Million) Forecast, by Application 2019 & 2032
- Table 98: Saudi Arabia Enterprise Routers Industry Volume (K Unit) Forecast, by Application 2019 & 2032
- Table 99: South Africa Enterprise Routers Industry Revenue (Million) Forecast, by Application 2019 & 2032
- Table 100: South Africa Enterprise Routers Industry Volume (K Unit) Forecast, by Application 2019 & 2032
- Table 101: Rest of Middle East and Africa Enterprise Routers Industry Revenue (Million) Forecast, by Application 2019 & 2032
- Table 102: Rest of Middle East and Africa Enterprise Routers Industry Volume (K Unit) Forecast, by Application 2019 & 2032
- Table 103: Global Enterprise Routers Industry Revenue Million Forecast, by Type of Connectivity 2019 & 2032
- Table 104: Global Enterprise Routers Industry Volume K Unit Forecast, by Type of Connectivity 2019 & 2032
- Table 105: Global Enterprise Routers Industry Revenue Million Forecast, by Type of Port 2019 & 2032
- Table 106: Global Enterprise Routers Industry Volume K Unit Forecast, by Type of Port 2019 & 2032
- Table 107: Global Enterprise Routers Industry Revenue Million Forecast, by Type 2019 & 2032
- Table 108: Global Enterprise Routers Industry Volume K Unit Forecast, by Type 2019 & 2032
- Table 109: Global Enterprise Routers Industry Revenue Million Forecast, by End-user Vertical 2019 & 2032
- Table 110: Global Enterprise Routers Industry Volume K Unit Forecast, by End-user Vertical 2019 & 2032
- Table 111: Global Enterprise Routers Industry Revenue Million Forecast, by Country 2019 & 2032
- Table 112: Global Enterprise Routers Industry Volume K Unit Forecast, by Country 2019 & 2032
- Table 113: Global Enterprise Routers Industry Revenue Million Forecast, by Type of Connectivity 2019 & 2032
- Table 114: Global Enterprise Routers Industry Volume K Unit Forecast, by Type of Connectivity 2019 & 2032
- Table 115: Global Enterprise Routers Industry Revenue Million Forecast, by Type of Port 2019 & 2032
- Table 116: Global Enterprise Routers Industry Volume K Unit Forecast, by Type of Port 2019 & 2032
- Table 117: Global Enterprise Routers Industry Revenue Million Forecast, by Type 2019 & 2032
- Table 118: Global Enterprise Routers Industry Volume K Unit Forecast, by Type 2019 & 2032
- Table 119: Global Enterprise Routers Industry Revenue Million Forecast, by End-user Vertical 2019 & 2032
- Table 120: Global Enterprise Routers Industry Volume K Unit Forecast, by End-user Vertical 2019 & 2032
- Table 121: Global Enterprise Routers Industry Revenue Million Forecast, by Country 2019 & 2032
- Table 122: Global Enterprise Routers Industry Volume K Unit Forecast, by Country 2019 & 2032
- Table 123: Global Enterprise Routers Industry Revenue Million Forecast, by Type of Connectivity 2019 & 2032
- Table 124: Global Enterprise Routers Industry Volume K Unit Forecast, by Type of Connectivity 2019 & 2032
- Table 125: Global Enterprise Routers Industry Revenue Million Forecast, by Type of Port 2019 & 2032
- Table 126: Global Enterprise Routers Industry Volume K Unit Forecast, by Type of Port 2019 & 2032
- Table 127: Global Enterprise Routers Industry Revenue Million Forecast, by Type 2019 & 2032
- Table 128: Global Enterprise Routers Industry Volume K Unit Forecast, by Type 2019 & 2032
- Table 129: Global Enterprise Routers Industry Revenue Million Forecast, by End-user Vertical 2019 & 2032
- Table 130: Global Enterprise Routers Industry Volume K Unit Forecast, by End-user Vertical 2019 & 2032
- Table 131: Global Enterprise Routers Industry Revenue Million Forecast, by Country 2019 & 2032
- Table 132: Global Enterprise Routers Industry Volume K Unit Forecast, by Country 2019 & 2032
- Table 133: Global Enterprise Routers Industry Revenue Million Forecast, by Type of Connectivity 2019 & 2032
- Table 134: Global Enterprise Routers Industry Volume K Unit Forecast, by Type of Connectivity 2019 & 2032
- Table 135: Global Enterprise Routers Industry Revenue Million Forecast, by Type of Port 2019 & 2032
- Table 136: Global Enterprise Routers Industry Volume K Unit Forecast, by Type of Port 2019 & 2032
- Table 137: Global Enterprise Routers Industry Revenue Million Forecast, by Type 2019 & 2032
- Table 138: Global Enterprise Routers Industry Volume K Unit Forecast, by Type 2019 & 2032
- Table 139: Global Enterprise Routers Industry Revenue Million Forecast, by End-user Vertical 2019 & 2032
- Table 140: Global Enterprise Routers Industry Volume K Unit Forecast, by End-user Vertical 2019 & 2032
- Table 141: Global Enterprise Routers Industry Revenue Million Forecast, by Country 2019 & 2032
- Table 142: Global Enterprise Routers Industry Volume K Unit Forecast, by Country 2019 & 2032
- Table 143: Global Enterprise Routers Industry Revenue Million Forecast, by Type of Connectivity 2019 & 2032
- Table 144: Global Enterprise Routers Industry Volume K Unit Forecast, by Type of Connectivity 2019 & 2032
- Table 145: Global Enterprise Routers Industry Revenue Million Forecast, by Type of Port 2019 & 2032
- Table 146: Global Enterprise Routers Industry Volume K Unit Forecast, by Type of Port 2019 & 2032
- Table 147: Global Enterprise Routers Industry Revenue Million Forecast, by Type 2019 & 2032
- Table 148: Global Enterprise Routers Industry Volume K Unit Forecast, by Type 2019 & 2032
- Table 149: Global Enterprise Routers Industry Revenue Million Forecast, by End-user Vertical 2019 & 2032
- Table 150: Global Enterprise Routers Industry Volume K Unit Forecast, by End-user Vertical 2019 & 2032
- Table 151: Global Enterprise Routers Industry Revenue Million Forecast, by Country 2019 & 2032
- Table 152: Global Enterprise Routers Industry Volume K Unit Forecast, by Country 2019 & 2032
Frequently Asked Questions
1. What is the projected Compound Annual Growth Rate (CAGR) of the Enterprise Routers Industry?
The projected CAGR is approximately 7.49%.
2. Which companies are prominent players in the Enterprise Routers Industry?
Key companies in the market include Riverbed Technology Inc, Hewlett Packard Enterprise Co, Nokia Networks Corporation, Cisco Systems Inc, Juniper Networks Inc, Avaya Inc, Dell Inc, Alcatel-Lucent S A, Huawei Technologies Co Ltd, ZTE Corporation.
3. What are the main segments of the Enterprise Routers Industry?
The market segments include Type of Connectivity, Type of Port, Type, End-user Vertical.
4. Can you provide details about the market size?
The market size is estimated to be USD 16.94 Million as of 2022.
5. What are some drivers contributing to market growth?
Increasing Network Virtualization; Rapid Growth in IP Traffic Enterprise.
6. What are the notable trends driving market growth?
Wireless Connectivity is Expected to Hold Major Share.
7. Are there any restraints impacting market growth?
Security and Privacy Concerns.
8. Can you provide examples of recent developments in the market?
March 2023 - Cisco announced patches for a high-severity denial-of-service The IOS XR software for ASR 9000 routers, ASR 9902 and ASR 9903 Enterprise is affected by this vulnerability. Tracked as CVE-2023-20049 and, the vulnerability impacts the platform's bidirectional forwarding detection (BFD) hardware offload feature and can be exploited remotely without authentication. malformed BFD packets are not handled correctly on vulnerable devices with the hardware offloading feature enabled, allowing attackers to send malicious IPv4BFDs for an IP address that has been configured and trigger this flaw.
9. What pricing options are available for accessing the report?
Pricing options include single-user, multi-user, and enterprise licenses priced at USD 4750, USD 5250, and USD 8750 respectively.
10. Is the market size provided in terms of value or volume?
The market size is provided in terms of value, measured in Million and volume, measured in K Unit.
11. Are there any specific market keywords associated with the report?
Yes, the market keyword associated with the report is "Enterprise Routers Industry," which aids in identifying and referencing the specific market segment covered.
12. How do I determine which pricing option suits my needs best?
The pricing options vary based on user requirements and access needs. Individual users may opt for single-user licenses, while businesses requiring broader access may choose multi-user or enterprise licenses for cost-effective access to the report.
13. Are there any additional resources or data provided in the Enterprise Routers Industry report?
While the report offers comprehensive insights, it's advisable to review the specific contents or supplementary materials provided to ascertain if additional resources or data are available.
14. How can I stay updated on further developments or reports in the Enterprise Routers Industry?
To stay informed about further developments, trends, and reports in the Enterprise Routers Industry, consider subscribing to industry newsletters, following relevant companies and organizations, or regularly checking reputable industry news sources and publications.
Methodology
Step 1 - Identification of Relevant Samples Size from Population Database


Step 2 - Approaches for Defining Global Market Size (Value, Volume* & Price*)

Note*: In applicable scenarios
Step 3 - Data Sources
Primary Research
- Web Analytics
- Survey Reports
- Research Institute
- Latest Research Reports
- Opinion Leaders
Secondary Research
- Annual Reports
- White Paper
- Latest Press Release
- Industry Association
- Paid Database
- Investor Presentations

Step 4 - Data Triangulation
Involves using different sources of information in order to increase the validity of a study
These sources are likely to be stakeholders in a program - participants, other researchers, program staff, other community members, and so on.
Then we put all data in single framework & apply various statistical tools to find out the dynamic on the market.
During the analysis stage, feedback from the stakeholder groups would be compared to determine areas of agreement as well as areas of divergence
