

Key Insights
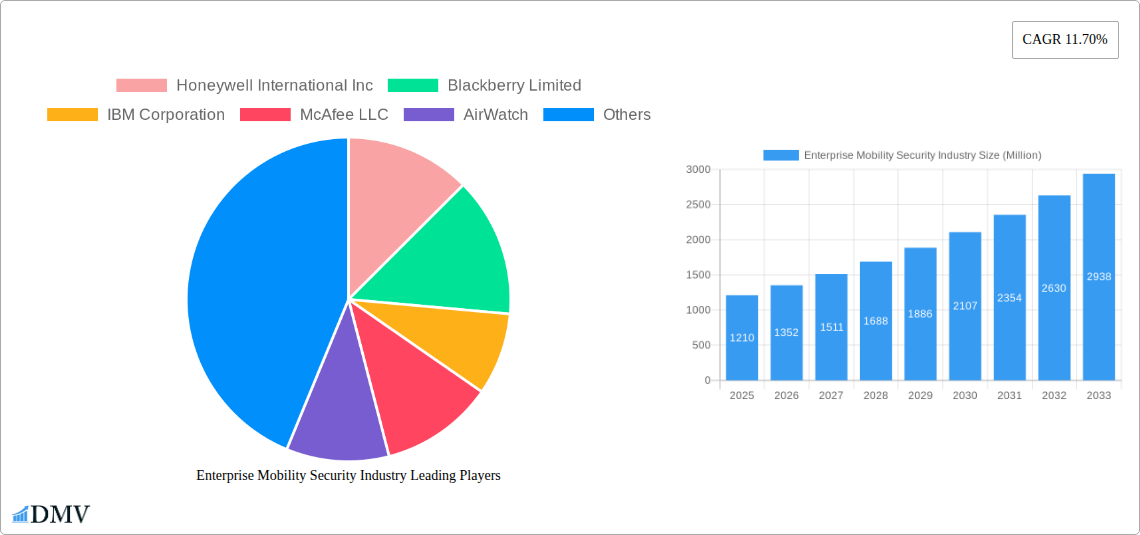
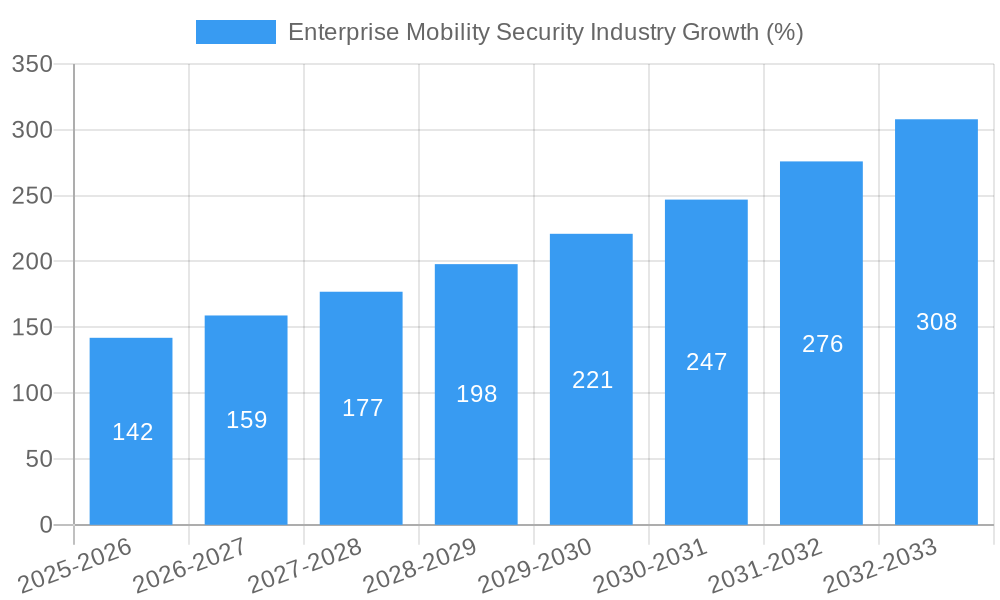
The Enterprise Mobility Security (EMS) market, valued at $1.21 billion in 2025, is projected to experience robust growth, driven by the increasing adoption of mobile devices in the workplace and the rising need for robust security solutions to protect sensitive data. A Compound Annual Growth Rate (CAGR) of 11.70% is anticipated from 2025 to 2033, indicating a significant expansion of this market. Key drivers include the proliferation of BYOD (Bring Your Own Device) policies, the growing threat landscape of cyberattacks targeting mobile devices, and the increasing regulatory compliance requirements for data protection across various sectors. The banking/insurance and healthcare sectors are expected to be major contributors to market growth, due to their stringent data security needs and the sensitive nature of the information they handle. Furthermore, the increasing adoption of cloud-based EMS solutions simplifies deployment and management, further propelling market expansion. Trends such as advanced threat protection, artificial intelligence (AI)-powered security solutions, and zero-trust security architectures are shaping the future of EMS. Despite this positive outlook, potential restraints include the complexity of integrating different security solutions and the high initial investment costs for businesses implementing comprehensive EMS strategies.
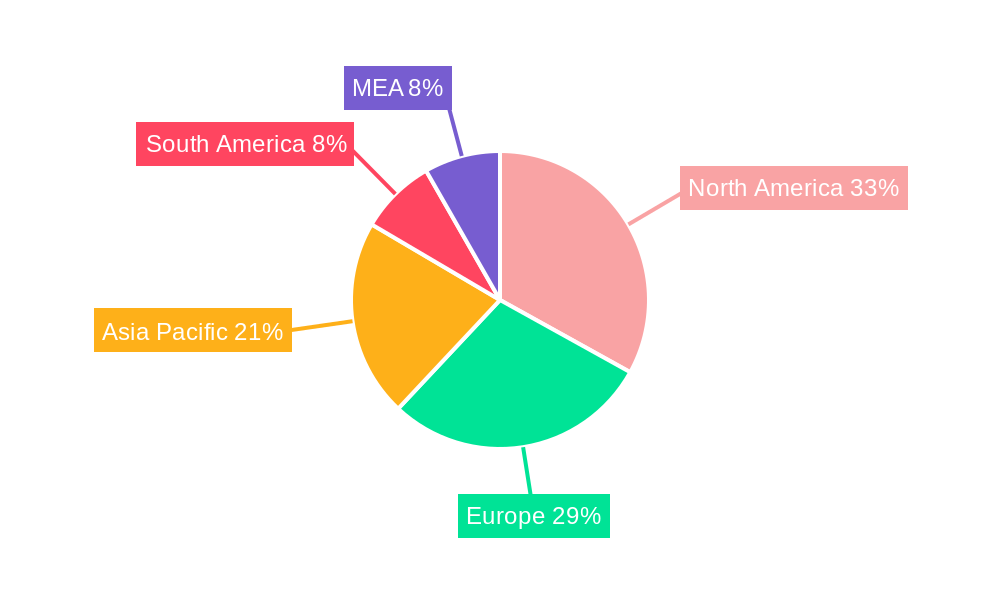
The geographical distribution of the EMS market is diverse, with North America and Europe currently holding significant market share. However, the Asia-Pacific region is poised for rapid growth, driven by increasing smartphone penetration and the rising adoption of digital technologies in emerging economies like India and China. Leading vendors like Honeywell, Blackberry, IBM, and others are actively competing through innovation and strategic acquisitions, resulting in a dynamic and competitive landscape. The segment by device shows significant growth in smartphones and tablets, representing the dominant mode of access for employees. The diverse application across various end-user industries, including IT and Telecom, government, and others, showcases the wide applicability and growing importance of robust enterprise mobility security solutions. The forecast period (2025-2033) paints a picture of sustained growth, with the market expected to reach a significant size by 2033, driven by continued technological advancements and increasing business adoption.
Enterprise Mobility Security Industry: A Comprehensive Market Report (2019-2033)
This insightful report provides a comprehensive analysis of the Enterprise Mobility Security industry, projecting a market valuation of $XX Million by 2033. It delves into market trends, key players, technological advancements, and future growth opportunities, offering crucial insights for stakeholders seeking to navigate this dynamic landscape. The report covers the historical period (2019-2024), the base year (2025), and forecasts through 2033.
Enterprise Mobility Security Industry Market Composition & Trends
The Enterprise Mobility Security market is experiencing significant growth, driven by the increasing adoption of mobile devices in the workplace and the escalating need for robust security solutions. Market concentration is moderate, with key players like Honeywell International Inc, Blackberry Limited, IBM Corporation, McAfee LLC, and Microsoft Corporation holding significant market share. However, the market also exhibits a fragmented landscape with numerous niche players. The total market share distribution among the top 10 players is estimated to be around 60% in 2025, with the remaining 40% spread across several smaller companies. Innovation is driven by advancements in areas such as artificial intelligence (AI), machine learning (ML), and cloud computing. Regulatory landscapes, including GDPR and CCPA, are influencing security protocols and data privacy practices. Substitute products include traditional network security solutions, but the trend leans heavily towards integrated enterprise mobility security. M&A activity is frequent, reflecting the industry's consolidation. In 2024, the total value of M&A deals in the Enterprise Mobility Security market was estimated at $XX Million.
- Market Share: Top 10 players hold approximately 60% of the market share in 2025.
- M&A Activity: 2024 saw a total M&A deal value of approximately $XX Million.
- Key Drivers: Increased mobile device adoption, stringent security regulations, and growing need for data protection.
Enterprise Mobility Security Industry Evolution
The Enterprise Mobility Security market exhibits a robust growth trajectory, driven by several factors. From 2019 to 2024, the market witnessed a Compound Annual Growth Rate (CAGR) of XX%. This growth is projected to continue at a CAGR of XX% from 2025 to 2033, reaching an estimated market value of $XX Million by 2033. This expansion is fueled by the increasing adoption of Bring Your Own Device (BYOD) policies, the rise of cloud computing and mobile workforce, and the growing sophistication of cyber threats. Technological advancements, such as AI-powered threat detection and zero-trust security models, are significantly influencing market evolution. Consumer demands are shifting towards more user-friendly and integrated security solutions that offer seamless mobility without compromising security. The adoption rate of enterprise mobility security solutions increased from XX% in 2019 to XX% in 2024 and is expected to exceed XX% by 2033.
Leading Regions, Countries, or Segments in Enterprise Mobility Security Industry
North America currently dominates the Enterprise Mobility Security market, accounting for approximately XX% of the global market share in 2025. This dominance is attributed to several factors:
- High Mobile Device Penetration: North America exhibits high smartphone, laptop, and tablet penetration rates among both consumers and businesses.
- Stringent Data Privacy Regulations: Strict regulations like CCPA drive demand for robust security solutions.
- High Investment in IT Infrastructure: Significant investments in IT infrastructure support enterprise mobility security adoption.
The Banking/Insurance and Healthcare sectors are leading end-user segments, driven by high sensitivity to data breaches and regulatory compliance. Smartphones currently hold the largest market share within the device segment, reflecting the widespread use of mobile devices for business purposes.
- Key Drivers for North America: High mobile device penetration, stringent data privacy regulations, and significant IT infrastructure investments.
- Key Drivers for Banking/Insurance: High data sensitivity, stringent regulatory compliance requirements.
- Key Drivers for Healthcare: Strict HIPAA compliance, increasing reliance on mobile devices for patient care.
Enterprise Mobility Security Industry Product Innovations
Recent innovations include AI-powered threat detection systems, advanced endpoint security solutions, and enhanced mobile device management (MDM) platforms. These solutions offer enhanced security, improved user experience, and enhanced data loss prevention (DLP) capabilities. Unique selling propositions often involve seamless integration with existing IT infrastructures, user-friendly interfaces, and proactive threat monitoring capabilities. The focus is on developing more adaptive and intelligent security systems that can respond to evolving threats in real-time.
Propelling Factors for Enterprise Mobility Security Industry Growth
The Enterprise Mobility Security market is propelled by several factors: The increasing adoption of cloud-based services necessitates secure access and data protection, the growing reliance on mobile devices in the workplace demands robust security measures, and stringent government regulations regarding data privacy necessitate sophisticated security solutions. Furthermore, the rise of sophisticated cyber threats and data breaches fuels demand for advanced security technologies.
Obstacles in the Enterprise Mobility Security Industry Market
Significant obstacles include high implementation costs of advanced security solutions, complexity in integrating disparate security systems, and the skills gap in cybersecurity professionals. Supply chain disruptions may also influence the availability and cost of components for security solutions. Intense competition from established players and new entrants creates a challenging environment. These factors may contribute to a projected XX% decrease in adoption rate in some sub-segments by 2033, depending on overcoming these obstacles.
Future Opportunities in Enterprise Mobility Security Industry
Emerging opportunities lie in expanding into new geographic markets, especially in developing countries with rising mobile adoption rates. The integration of AI and ML will further enhance threat detection and response capabilities. The increasing adoption of IoT devices and edge computing presents both challenges and opportunities for secure management and protection. Demand for secure remote access solutions will drive growth in this space.
Major Players in the Enterprise Mobility Security Industry Ecosystem
- Honeywell International Inc
- Blackberry Limited
- IBM Corporation
- McAfee LLC
- AirWatch
- Cisco Systems Inc
- Microsoft Corporation
- Oracle Corporation
- Symantec Corporation
- Citrix Systems Inc
- MobileIron
- SAP SE
Key Developments in Enterprise Mobility Security Industry
- October 2022: Kocho acquires Mobliciti, expanding its enterprise mobility and security service offerings.
- July 2022: CWSI acquires AVR International, strengthening its presence in the UK enterprise mobility security market.
Strategic Enterprise Mobility Security Industry Market Forecast
The Enterprise Mobility Security market is poised for continued growth, driven by technological advancements, increasing mobile adoption, and the growing need for robust security measures. The focus on AI and ML-driven solutions, coupled with expanding into new markets, presents significant opportunities. Despite challenges such as implementation costs and competition, the market is projected to experience robust growth, reaching a valuation of $XX Million by 2033.
Enterprise Mobility Security Industry Segmentation
-
1. Device
- 1.1. Smartphones
- 1.2. Laptops
- 1.3. Tablets
-
2. End-User
- 2.1. Banking/Insurance
- 2.2. Healthcare
- 2.3. IT and Telecom
- 2.4. Government
- 2.5. Other End-user Industries
Enterprise Mobility Security Industry Segmentation By Geography
- 1. North America
- 2. Europe
- 3. Asia Pacific
- 4. Latin America
- 5. Middle East and Africa
Enterprise Mobility Security Industry REPORT HIGHLIGHTS
| Aspects | Details |
|---|---|
| Study Period | 2019-2033 |
| Base Year | 2024 |
| Estimated Year | 2025 |
| Forecast Period | 2025-2033 |
| Historical Period | 2019-2024 |
| Growth Rate | CAGR of 11.70% from 2019-2033 |
| Segmentation |
|
Table of Contents
- 1. Introduction
- 1.1. Research Scope
- 1.2. Market Segmentation
- 1.3. Research Methodology
- 1.4. Definitions and Assumptions
- 2. Executive Summary
- 2.1. Introduction
- 3. Market Dynamics
- 3.1. Introduction
- 3.2. Market Drivers
- 3.2.1. Industrial Internet of Things (IIoT) has Accelerated the Use-cases in the Market; Increasing Implementation of the BYOD Concept
- 3.3. Market Restrains
- 3.3.1. Security Vulnerability for Manufacturing Vendors is Discouraging the Market Growth.; Government Regulations and Infrastructure Maintenance act as Market Challenges
- 3.4. Market Trends
- 3.4.1. Banking/Insurance Industry to Hold Significant Market Share
- 4. Market Factor Analysis
- 4.1. Porters Five Forces
- 4.2. Supply/Value Chain
- 4.3. PESTEL analysis
- 4.4. Market Entropy
- 4.5. Patent/Trademark Analysis
- 5. Global Enterprise Mobility Security Industry Analysis, Insights and Forecast, 2019-2031
- 5.1. Market Analysis, Insights and Forecast - by Device
- 5.1.1. Smartphones
- 5.1.2. Laptops
- 5.1.3. Tablets
- 5.2. Market Analysis, Insights and Forecast - by End-User
- 5.2.1. Banking/Insurance
- 5.2.2. Healthcare
- 5.2.3. IT and Telecom
- 5.2.4. Government
- 5.2.5. Other End-user Industries
- 5.3. Market Analysis, Insights and Forecast - by Region
- 5.3.1. North America
- 5.3.2. Europe
- 5.3.3. Asia Pacific
- 5.3.4. Latin America
- 5.3.5. Middle East and Africa
- 5.1. Market Analysis, Insights and Forecast - by Device
- 6. North America Enterprise Mobility Security Industry Analysis, Insights and Forecast, 2019-2031
- 6.1. Market Analysis, Insights and Forecast - by Device
- 6.1.1. Smartphones
- 6.1.2. Laptops
- 6.1.3. Tablets
- 6.2. Market Analysis, Insights and Forecast - by End-User
- 6.2.1. Banking/Insurance
- 6.2.2. Healthcare
- 6.2.3. IT and Telecom
- 6.2.4. Government
- 6.2.5. Other End-user Industries
- 6.1. Market Analysis, Insights and Forecast - by Device
- 7. Europe Enterprise Mobility Security Industry Analysis, Insights and Forecast, 2019-2031
- 7.1. Market Analysis, Insights and Forecast - by Device
- 7.1.1. Smartphones
- 7.1.2. Laptops
- 7.1.3. Tablets
- 7.2. Market Analysis, Insights and Forecast - by End-User
- 7.2.1. Banking/Insurance
- 7.2.2. Healthcare
- 7.2.3. IT and Telecom
- 7.2.4. Government
- 7.2.5. Other End-user Industries
- 7.1. Market Analysis, Insights and Forecast - by Device
- 8. Asia Pacific Enterprise Mobility Security Industry Analysis, Insights and Forecast, 2019-2031
- 8.1. Market Analysis, Insights and Forecast - by Device
- 8.1.1. Smartphones
- 8.1.2. Laptops
- 8.1.3. Tablets
- 8.2. Market Analysis, Insights and Forecast - by End-User
- 8.2.1. Banking/Insurance
- 8.2.2. Healthcare
- 8.2.3. IT and Telecom
- 8.2.4. Government
- 8.2.5. Other End-user Industries
- 8.1. Market Analysis, Insights and Forecast - by Device
- 9. Latin America Enterprise Mobility Security Industry Analysis, Insights and Forecast, 2019-2031
- 9.1. Market Analysis, Insights and Forecast - by Device
- 9.1.1. Smartphones
- 9.1.2. Laptops
- 9.1.3. Tablets
- 9.2. Market Analysis, Insights and Forecast - by End-User
- 9.2.1. Banking/Insurance
- 9.2.2. Healthcare
- 9.2.3. IT and Telecom
- 9.2.4. Government
- 9.2.5. Other End-user Industries
- 9.1. Market Analysis, Insights and Forecast - by Device
- 10. Middle East and Africa Enterprise Mobility Security Industry Analysis, Insights and Forecast, 2019-2031
- 10.1. Market Analysis, Insights and Forecast - by Device
- 10.1.1. Smartphones
- 10.1.2. Laptops
- 10.1.3. Tablets
- 10.2. Market Analysis, Insights and Forecast - by End-User
- 10.2.1. Banking/Insurance
- 10.2.2. Healthcare
- 10.2.3. IT and Telecom
- 10.2.4. Government
- 10.2.5. Other End-user Industries
- 10.1. Market Analysis, Insights and Forecast - by Device
- 11. North America Enterprise Mobility Security Industry Analysis, Insights and Forecast, 2019-2031
- 11.1. Market Analysis, Insights and Forecast - By Country/Sub-region
- 11.1.1 United States
- 11.1.2 Canada
- 11.1.3 Mexico
- 12. Europe Enterprise Mobility Security Industry Analysis, Insights and Forecast, 2019-2031
- 12.1. Market Analysis, Insights and Forecast - By Country/Sub-region
- 12.1.1 Germany
- 12.1.2 United Kingdom
- 12.1.3 France
- 12.1.4 Spain
- 12.1.5 Italy
- 12.1.6 Spain
- 12.1.7 Belgium
- 12.1.8 Netherland
- 12.1.9 Nordics
- 12.1.10 Rest of Europe
- 13. Asia Pacific Enterprise Mobility Security Industry Analysis, Insights and Forecast, 2019-2031
- 13.1. Market Analysis, Insights and Forecast - By Country/Sub-region
- 13.1.1 China
- 13.1.2 Japan
- 13.1.3 India
- 13.1.4 South Korea
- 13.1.5 Southeast Asia
- 13.1.6 Australia
- 13.1.7 Indonesia
- 13.1.8 Phillipes
- 13.1.9 Singapore
- 13.1.10 Thailandc
- 13.1.11 Rest of Asia Pacific
- 14. South America Enterprise Mobility Security Industry Analysis, Insights and Forecast, 2019-2031
- 14.1. Market Analysis, Insights and Forecast - By Country/Sub-region
- 14.1.1 Brazil
- 14.1.2 Argentina
- 14.1.3 Peru
- 14.1.4 Chile
- 14.1.5 Colombia
- 14.1.6 Ecuador
- 14.1.7 Venezuela
- 14.1.8 Rest of South America
- 15. North America Enterprise Mobility Security Industry Analysis, Insights and Forecast, 2019-2031
- 15.1. Market Analysis, Insights and Forecast - By Country/Sub-region
- 15.1.1 United States
- 15.1.2 Canada
- 15.1.3 Mexico
- 16. MEA Enterprise Mobility Security Industry Analysis, Insights and Forecast, 2019-2031
- 16.1. Market Analysis, Insights and Forecast - By Country/Sub-region
- 16.1.1 United Arab Emirates
- 16.1.2 Saudi Arabia
- 16.1.3 South Africa
- 16.1.4 Rest of Middle East and Africa
- 17. Competitive Analysis
- 17.1. Global Market Share Analysis 2024
- 17.2. Company Profiles
- 17.2.1 Honeywell International Inc
- 17.2.1.1. Overview
- 17.2.1.2. Products
- 17.2.1.3. SWOT Analysis
- 17.2.1.4. Recent Developments
- 17.2.1.5. Financials (Based on Availability)
- 17.2.2 Blackberry Limited
- 17.2.2.1. Overview
- 17.2.2.2. Products
- 17.2.2.3. SWOT Analysis
- 17.2.2.4. Recent Developments
- 17.2.2.5. Financials (Based on Availability)
- 17.2.3 IBM Corporation
- 17.2.3.1. Overview
- 17.2.3.2. Products
- 17.2.3.3. SWOT Analysis
- 17.2.3.4. Recent Developments
- 17.2.3.5. Financials (Based on Availability)
- 17.2.4 McAfee LLC
- 17.2.4.1. Overview
- 17.2.4.2. Products
- 17.2.4.3. SWOT Analysis
- 17.2.4.4. Recent Developments
- 17.2.4.5. Financials (Based on Availability)
- 17.2.5 AirWatch
- 17.2.5.1. Overview
- 17.2.5.2. Products
- 17.2.5.3. SWOT Analysis
- 17.2.5.4. Recent Developments
- 17.2.5.5. Financials (Based on Availability)
- 17.2.6 Cisco Systems Inc
- 17.2.6.1. Overview
- 17.2.6.2. Products
- 17.2.6.3. SWOT Analysis
- 17.2.6.4. Recent Developments
- 17.2.6.5. Financials (Based on Availability)
- 17.2.7 Microsoft Corporation
- 17.2.7.1. Overview
- 17.2.7.2. Products
- 17.2.7.3. SWOT Analysis
- 17.2.7.4. Recent Developments
- 17.2.7.5. Financials (Based on Availability)
- 17.2.8 Oracle Corporation
- 17.2.8.1. Overview
- 17.2.8.2. Products
- 17.2.8.3. SWOT Analysis
- 17.2.8.4. Recent Developments
- 17.2.8.5. Financials (Based on Availability)
- 17.2.9 Symantec Corporation
- 17.2.9.1. Overview
- 17.2.9.2. Products
- 17.2.9.3. SWOT Analysis
- 17.2.9.4. Recent Developments
- 17.2.9.5. Financials (Based on Availability)
- 17.2.10 Citrix Systems Inc
- 17.2.10.1. Overview
- 17.2.10.2. Products
- 17.2.10.3. SWOT Analysis
- 17.2.10.4. Recent Developments
- 17.2.10.5. Financials (Based on Availability)
- 17.2.11 MobileIron
- 17.2.11.1. Overview
- 17.2.11.2. Products
- 17.2.11.3. SWOT Analysis
- 17.2.11.4. Recent Developments
- 17.2.11.5. Financials (Based on Availability)
- 17.2.12 SAP SE
- 17.2.12.1. Overview
- 17.2.12.2. Products
- 17.2.12.3. SWOT Analysis
- 17.2.12.4. Recent Developments
- 17.2.12.5. Financials (Based on Availability)
- 17.2.1 Honeywell International Inc
List of Figures
- Figure 1: Global Enterprise Mobility Security Industry Revenue Breakdown (Million, %) by Region 2024 & 2032
- Figure 2: North America Enterprise Mobility Security Industry Revenue (Million), by Country 2024 & 2032
- Figure 3: North America Enterprise Mobility Security Industry Revenue Share (%), by Country 2024 & 2032
- Figure 4: Europe Enterprise Mobility Security Industry Revenue (Million), by Country 2024 & 2032
- Figure 5: Europe Enterprise Mobility Security Industry Revenue Share (%), by Country 2024 & 2032
- Figure 6: Asia Pacific Enterprise Mobility Security Industry Revenue (Million), by Country 2024 & 2032
- Figure 7: Asia Pacific Enterprise Mobility Security Industry Revenue Share (%), by Country 2024 & 2032
- Figure 8: South America Enterprise Mobility Security Industry Revenue (Million), by Country 2024 & 2032
- Figure 9: South America Enterprise Mobility Security Industry Revenue Share (%), by Country 2024 & 2032
- Figure 10: North America Enterprise Mobility Security Industry Revenue (Million), by Country 2024 & 2032
- Figure 11: North America Enterprise Mobility Security Industry Revenue Share (%), by Country 2024 & 2032
- Figure 12: MEA Enterprise Mobility Security Industry Revenue (Million), by Country 2024 & 2032
- Figure 13: MEA Enterprise Mobility Security Industry Revenue Share (%), by Country 2024 & 2032
- Figure 14: North America Enterprise Mobility Security Industry Revenue (Million), by Device 2024 & 2032
- Figure 15: North America Enterprise Mobility Security Industry Revenue Share (%), by Device 2024 & 2032
- Figure 16: North America Enterprise Mobility Security Industry Revenue (Million), by End-User 2024 & 2032
- Figure 17: North America Enterprise Mobility Security Industry Revenue Share (%), by End-User 2024 & 2032
- Figure 18: North America Enterprise Mobility Security Industry Revenue (Million), by Country 2024 & 2032
- Figure 19: North America Enterprise Mobility Security Industry Revenue Share (%), by Country 2024 & 2032
- Figure 20: Europe Enterprise Mobility Security Industry Revenue (Million), by Device 2024 & 2032
- Figure 21: Europe Enterprise Mobility Security Industry Revenue Share (%), by Device 2024 & 2032
- Figure 22: Europe Enterprise Mobility Security Industry Revenue (Million), by End-User 2024 & 2032
- Figure 23: Europe Enterprise Mobility Security Industry Revenue Share (%), by End-User 2024 & 2032
- Figure 24: Europe Enterprise Mobility Security Industry Revenue (Million), by Country 2024 & 2032
- Figure 25: Europe Enterprise Mobility Security Industry Revenue Share (%), by Country 2024 & 2032
- Figure 26: Asia Pacific Enterprise Mobility Security Industry Revenue (Million), by Device 2024 & 2032
- Figure 27: Asia Pacific Enterprise Mobility Security Industry Revenue Share (%), by Device 2024 & 2032
- Figure 28: Asia Pacific Enterprise Mobility Security Industry Revenue (Million), by End-User 2024 & 2032
- Figure 29: Asia Pacific Enterprise Mobility Security Industry Revenue Share (%), by End-User 2024 & 2032
- Figure 30: Asia Pacific Enterprise Mobility Security Industry Revenue (Million), by Country 2024 & 2032
- Figure 31: Asia Pacific Enterprise Mobility Security Industry Revenue Share (%), by Country 2024 & 2032
- Figure 32: Latin America Enterprise Mobility Security Industry Revenue (Million), by Device 2024 & 2032
- Figure 33: Latin America Enterprise Mobility Security Industry Revenue Share (%), by Device 2024 & 2032
- Figure 34: Latin America Enterprise Mobility Security Industry Revenue (Million), by End-User 2024 & 2032
- Figure 35: Latin America Enterprise Mobility Security Industry Revenue Share (%), by End-User 2024 & 2032
- Figure 36: Latin America Enterprise Mobility Security Industry Revenue (Million), by Country 2024 & 2032
- Figure 37: Latin America Enterprise Mobility Security Industry Revenue Share (%), by Country 2024 & 2032
- Figure 38: Middle East and Africa Enterprise Mobility Security Industry Revenue (Million), by Device 2024 & 2032
- Figure 39: Middle East and Africa Enterprise Mobility Security Industry Revenue Share (%), by Device 2024 & 2032
- Figure 40: Middle East and Africa Enterprise Mobility Security Industry Revenue (Million), by End-User 2024 & 2032
- Figure 41: Middle East and Africa Enterprise Mobility Security Industry Revenue Share (%), by End-User 2024 & 2032
- Figure 42: Middle East and Africa Enterprise Mobility Security Industry Revenue (Million), by Country 2024 & 2032
- Figure 43: Middle East and Africa Enterprise Mobility Security Industry Revenue Share (%), by Country 2024 & 2032
List of Tables
- Table 1: Global Enterprise Mobility Security Industry Revenue Million Forecast, by Region 2019 & 2032
- Table 2: Global Enterprise Mobility Security Industry Revenue Million Forecast, by Device 2019 & 2032
- Table 3: Global Enterprise Mobility Security Industry Revenue Million Forecast, by End-User 2019 & 2032
- Table 4: Global Enterprise Mobility Security Industry Revenue Million Forecast, by Region 2019 & 2032
- Table 5: Global Enterprise Mobility Security Industry Revenue Million Forecast, by Country 2019 & 2032
- Table 6: United States Enterprise Mobility Security Industry Revenue (Million) Forecast, by Application 2019 & 2032
- Table 7: Canada Enterprise Mobility Security Industry Revenue (Million) Forecast, by Application 2019 & 2032
- Table 8: Mexico Enterprise Mobility Security Industry Revenue (Million) Forecast, by Application 2019 & 2032
- Table 9: Global Enterprise Mobility Security Industry Revenue Million Forecast, by Country 2019 & 2032
- Table 10: Germany Enterprise Mobility Security Industry Revenue (Million) Forecast, by Application 2019 & 2032
- Table 11: United Kingdom Enterprise Mobility Security Industry Revenue (Million) Forecast, by Application 2019 & 2032
- Table 12: France Enterprise Mobility Security Industry Revenue (Million) Forecast, by Application 2019 & 2032
- Table 13: Spain Enterprise Mobility Security Industry Revenue (Million) Forecast, by Application 2019 & 2032
- Table 14: Italy Enterprise Mobility Security Industry Revenue (Million) Forecast, by Application 2019 & 2032
- Table 15: Spain Enterprise Mobility Security Industry Revenue (Million) Forecast, by Application 2019 & 2032
- Table 16: Belgium Enterprise Mobility Security Industry Revenue (Million) Forecast, by Application 2019 & 2032
- Table 17: Netherland Enterprise Mobility Security Industry Revenue (Million) Forecast, by Application 2019 & 2032
- Table 18: Nordics Enterprise Mobility Security Industry Revenue (Million) Forecast, by Application 2019 & 2032
- Table 19: Rest of Europe Enterprise Mobility Security Industry Revenue (Million) Forecast, by Application 2019 & 2032
- Table 20: Global Enterprise Mobility Security Industry Revenue Million Forecast, by Country 2019 & 2032
- Table 21: China Enterprise Mobility Security Industry Revenue (Million) Forecast, by Application 2019 & 2032
- Table 22: Japan Enterprise Mobility Security Industry Revenue (Million) Forecast, by Application 2019 & 2032
- Table 23: India Enterprise Mobility Security Industry Revenue (Million) Forecast, by Application 2019 & 2032
- Table 24: South Korea Enterprise Mobility Security Industry Revenue (Million) Forecast, by Application 2019 & 2032
- Table 25: Southeast Asia Enterprise Mobility Security Industry Revenue (Million) Forecast, by Application 2019 & 2032
- Table 26: Australia Enterprise Mobility Security Industry Revenue (Million) Forecast, by Application 2019 & 2032
- Table 27: Indonesia Enterprise Mobility Security Industry Revenue (Million) Forecast, by Application 2019 & 2032
- Table 28: Phillipes Enterprise Mobility Security Industry Revenue (Million) Forecast, by Application 2019 & 2032
- Table 29: Singapore Enterprise Mobility Security Industry Revenue (Million) Forecast, by Application 2019 & 2032
- Table 30: Thailandc Enterprise Mobility Security Industry Revenue (Million) Forecast, by Application 2019 & 2032
- Table 31: Rest of Asia Pacific Enterprise Mobility Security Industry Revenue (Million) Forecast, by Application 2019 & 2032
- Table 32: Global Enterprise Mobility Security Industry Revenue Million Forecast, by Country 2019 & 2032
- Table 33: Brazil Enterprise Mobility Security Industry Revenue (Million) Forecast, by Application 2019 & 2032
- Table 34: Argentina Enterprise Mobility Security Industry Revenue (Million) Forecast, by Application 2019 & 2032
- Table 35: Peru Enterprise Mobility Security Industry Revenue (Million) Forecast, by Application 2019 & 2032
- Table 36: Chile Enterprise Mobility Security Industry Revenue (Million) Forecast, by Application 2019 & 2032
- Table 37: Colombia Enterprise Mobility Security Industry Revenue (Million) Forecast, by Application 2019 & 2032
- Table 38: Ecuador Enterprise Mobility Security Industry Revenue (Million) Forecast, by Application 2019 & 2032
- Table 39: Venezuela Enterprise Mobility Security Industry Revenue (Million) Forecast, by Application 2019 & 2032
- Table 40: Rest of South America Enterprise Mobility Security Industry Revenue (Million) Forecast, by Application 2019 & 2032
- Table 41: Global Enterprise Mobility Security Industry Revenue Million Forecast, by Country 2019 & 2032
- Table 42: United States Enterprise Mobility Security Industry Revenue (Million) Forecast, by Application 2019 & 2032
- Table 43: Canada Enterprise Mobility Security Industry Revenue (Million) Forecast, by Application 2019 & 2032
- Table 44: Mexico Enterprise Mobility Security Industry Revenue (Million) Forecast, by Application 2019 & 2032
- Table 45: Global Enterprise Mobility Security Industry Revenue Million Forecast, by Country 2019 & 2032
- Table 46: United Arab Emirates Enterprise Mobility Security Industry Revenue (Million) Forecast, by Application 2019 & 2032
- Table 47: Saudi Arabia Enterprise Mobility Security Industry Revenue (Million) Forecast, by Application 2019 & 2032
- Table 48: South Africa Enterprise Mobility Security Industry Revenue (Million) Forecast, by Application 2019 & 2032
- Table 49: Rest of Middle East and Africa Enterprise Mobility Security Industry Revenue (Million) Forecast, by Application 2019 & 2032
- Table 50: Global Enterprise Mobility Security Industry Revenue Million Forecast, by Device 2019 & 2032
- Table 51: Global Enterprise Mobility Security Industry Revenue Million Forecast, by End-User 2019 & 2032
- Table 52: Global Enterprise Mobility Security Industry Revenue Million Forecast, by Country 2019 & 2032
- Table 53: Global Enterprise Mobility Security Industry Revenue Million Forecast, by Device 2019 & 2032
- Table 54: Global Enterprise Mobility Security Industry Revenue Million Forecast, by End-User 2019 & 2032
- Table 55: Global Enterprise Mobility Security Industry Revenue Million Forecast, by Country 2019 & 2032
- Table 56: Global Enterprise Mobility Security Industry Revenue Million Forecast, by Device 2019 & 2032
- Table 57: Global Enterprise Mobility Security Industry Revenue Million Forecast, by End-User 2019 & 2032
- Table 58: Global Enterprise Mobility Security Industry Revenue Million Forecast, by Country 2019 & 2032
- Table 59: Global Enterprise Mobility Security Industry Revenue Million Forecast, by Device 2019 & 2032
- Table 60: Global Enterprise Mobility Security Industry Revenue Million Forecast, by End-User 2019 & 2032
- Table 61: Global Enterprise Mobility Security Industry Revenue Million Forecast, by Country 2019 & 2032
- Table 62: Global Enterprise Mobility Security Industry Revenue Million Forecast, by Device 2019 & 2032
- Table 63: Global Enterprise Mobility Security Industry Revenue Million Forecast, by End-User 2019 & 2032
- Table 64: Global Enterprise Mobility Security Industry Revenue Million Forecast, by Country 2019 & 2032
Frequently Asked Questions
1. What is the projected Compound Annual Growth Rate (CAGR) of the Enterprise Mobility Security Industry?
The projected CAGR is approximately 11.70%.
2. Which companies are prominent players in the Enterprise Mobility Security Industry?
Key companies in the market include Honeywell International Inc, Blackberry Limited, IBM Corporation, McAfee LLC, AirWatch, Cisco Systems Inc, Microsoft Corporation, Oracle Corporation, Symantec Corporation, Citrix Systems Inc, MobileIron, SAP SE.
3. What are the main segments of the Enterprise Mobility Security Industry?
The market segments include Device, End-User.
4. Can you provide details about the market size?
The market size is estimated to be USD 1.21 Million as of 2022.
5. What are some drivers contributing to market growth?
Industrial Internet of Things (IIoT) has Accelerated the Use-cases in the Market; Increasing Implementation of the BYOD Concept.
6. What are the notable trends driving market growth?
Banking/Insurance Industry to Hold Significant Market Share.
7. Are there any restraints impacting market growth?
Security Vulnerability for Manufacturing Vendors is Discouraging the Market Growth.; Government Regulations and Infrastructure Maintenance act as Market Challenges.
8. Can you provide examples of recent developments in the market?
October 2022: Mobliciti provides enterprise mobility, security, and wireless connectivity solutions. Kocho, a UK-based provider of managed services in cyber security, identity management, and cloud transition, acquired Mobliciti. By incorporating strategic mobile management and security capabilities, the partnership would enable Kocho's service offering and customers of both businesses to access a comprehensive lineup to accelerate the pace of their digital transformation activities.
9. What pricing options are available for accessing the report?
Pricing options include single-user, multi-user, and enterprise licenses priced at USD 4750, USD 5250, and USD 8750 respectively.
10. Is the market size provided in terms of value or volume?
The market size is provided in terms of value, measured in Million.
11. Are there any specific market keywords associated with the report?
Yes, the market keyword associated with the report is "Enterprise Mobility Security Industry," which aids in identifying and referencing the specific market segment covered.
12. How do I determine which pricing option suits my needs best?
The pricing options vary based on user requirements and access needs. Individual users may opt for single-user licenses, while businesses requiring broader access may choose multi-user or enterprise licenses for cost-effective access to the report.
13. Are there any additional resources or data provided in the Enterprise Mobility Security Industry report?
While the report offers comprehensive insights, it's advisable to review the specific contents or supplementary materials provided to ascertain if additional resources or data are available.
14. How can I stay updated on further developments or reports in the Enterprise Mobility Security Industry?
To stay informed about further developments, trends, and reports in the Enterprise Mobility Security Industry, consider subscribing to industry newsletters, following relevant companies and organizations, or regularly checking reputable industry news sources and publications.
Methodology
Step 1 - Identification of Relevant Samples Size from Population Database


Step 2 - Approaches for Defining Global Market Size (Value, Volume* & Price*)

Note*: In applicable scenarios
Step 3 - Data Sources
Primary Research
- Web Analytics
- Survey Reports
- Research Institute
- Latest Research Reports
- Opinion Leaders
Secondary Research
- Annual Reports
- White Paper
- Latest Press Release
- Industry Association
- Paid Database
- Investor Presentations

Step 4 - Data Triangulation
Involves using different sources of information in order to increase the validity of a study
These sources are likely to be stakeholders in a program - participants, other researchers, program staff, other community members, and so on.
Then we put all data in single framework & apply various statistical tools to find out the dynamic on the market.
During the analysis stage, feedback from the stakeholder groups would be compared to determine areas of agreement as well as areas of divergence
