

Key Insights
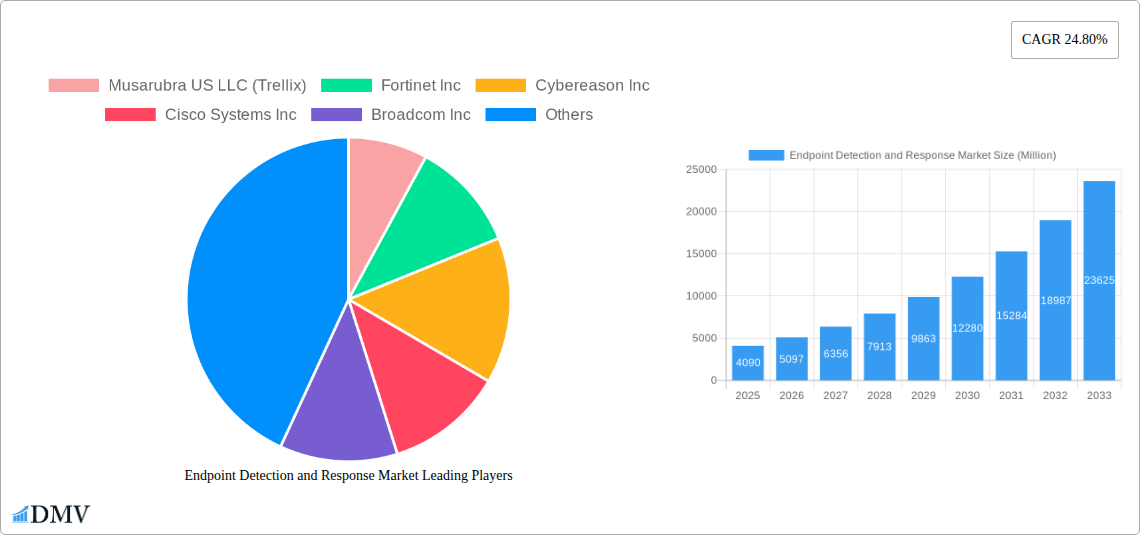
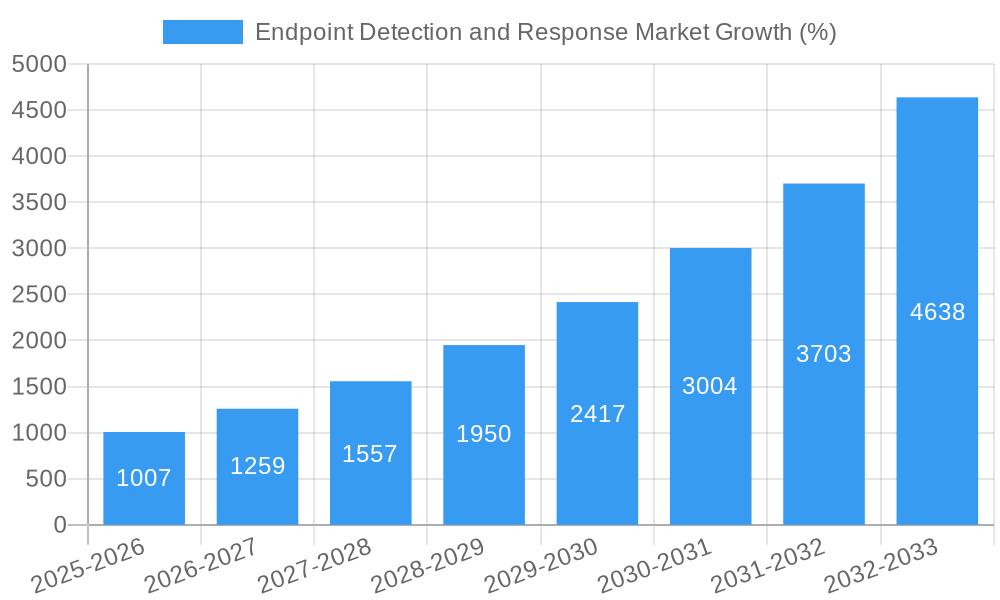
The Endpoint Detection and Response (EDR) market is experiencing robust growth, projected to reach \$4.09 billion in 2025 and exhibiting a Compound Annual Growth Rate (CAGR) of 24.80% from 2025 to 2033. This expansion is fueled by the increasing sophistication of cyber threats, the rising adoption of cloud-based solutions, and the growing need for comprehensive endpoint security across various industries. The proliferation of remote work models and the increasing reliance on mobile devices have further accelerated the demand for effective EDR solutions. Key drivers include the need to enhance threat detection and response capabilities, improve incident response times, and comply with stringent data security regulations. The market is segmented by component (solutions and services), deployment type (cloud-based and on-premise), solution type (workstations, mobile devices, servers, point-of-sale terminals), organization size (SMEs and large enterprises), and end-user industry (BFSI, IT and Telecom, Manufacturing, Healthcare, Retail, and others). The competitive landscape is characterized by established players like Trellix, Fortinet, Cybereason, Cisco, and CrowdStrike, alongside emerging innovators offering specialized solutions.
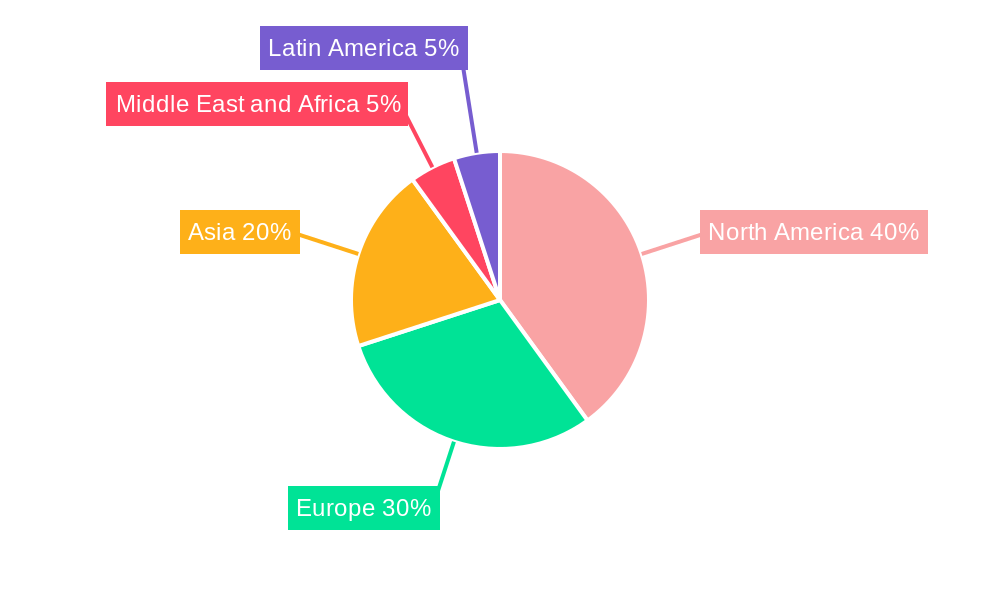
The significant growth trajectory of the EDR market is expected to continue throughout the forecast period, driven by factors such as the increasing adoption of artificial intelligence and machine learning in threat detection, the rise of extended detection and response (XDR) solutions, and the growing focus on proactive security measures. While factors such as the high cost of implementation and the complexity of integrating EDR solutions into existing security infrastructures pose challenges, the overall market outlook remains positive. The substantial investments in cybersecurity by organizations across various sectors are expected to fuel further market expansion, particularly in regions like North America, Europe, and Asia-Pacific, which are expected to dominate market share due to higher technological adoption and awareness.
Endpoint Detection and Response Market: A Comprehensive Report (2019-2033)
This insightful report provides a comprehensive analysis of the Endpoint Detection and Response (EDR) market, offering a detailed overview of its current state, future trajectory, and key players. Covering the period from 2019 to 2033, with 2025 as the base and estimated year, this report is an essential resource for stakeholders seeking to understand and capitalize on the opportunities within this rapidly evolving sector. The market is projected to reach xx Million by 2033, demonstrating substantial growth potential.
Endpoint Detection and Response Market Composition & Trends
This section delves into the intricate composition of the EDR market, examining market concentration, innovation drivers, regulatory influences, substitute products, end-user profiles, and merger & acquisition (M&A) activities. The market exhibits a moderately concentrated landscape, with key players holding significant market share. For instance, CrowdStrike Inc. holds an estimated xx% market share in 2025, followed by Palo Alto Networks Inc. with xx% and Fortinet Inc. with xx%. However, the market is also characterized by a dynamic competitive environment with continuous innovation driving the introduction of new solutions.
- Market Concentration: Moderate, with top players holding significant, but not dominant, shares.
- Innovation Catalysts: AI, machine learning, automation, and cloud integration are key drivers.
- Regulatory Landscape: GDPR, CCPA, and other data privacy regulations influence market dynamics. Compliance requirements drive adoption.
- Substitute Products: Traditional antivirus solutions and security information and event management (SIEM) systems offer partial overlap.
- End-User Profiles: Large enterprises dominate, followed by SMEs, with varying adoption rates based on industry and security maturity.
- M&A Activities: The EDR market has witnessed significant M&A activity in recent years, with deal values totaling approximately xx Million in 2024. This activity reflects consolidation and expansion strategies by major players.
Endpoint Detection and Response Market Industry Evolution
The EDR market has experienced substantial growth fueled by the increasing sophistication of cyber threats and the rising adoption of cloud-based solutions. From 2019 to 2024, the market witnessed a Compound Annual Growth Rate (CAGR) of xx%, driven primarily by the escalating need for robust endpoint security. The shift toward cloud-based deployments, fueled by enhanced scalability and cost-effectiveness, has accelerated market expansion. Furthermore, increasing awareness of advanced persistent threats (APTs) and ransomware attacks has propelled the demand for advanced EDR solutions. Technological advancements, such as AI and machine learning, have further enhanced the effectiveness of EDR solutions, enabling faster threat detection and response. Consumer demand for integrated security solutions, simplified management, and enhanced visibility into endpoint activity has also significantly impacted market dynamics. The predicted CAGR for the forecast period (2025-2033) is xx%, indicating continued market expansion.
Leading Regions, Countries, or Segments in Endpoint Detection and Response Market
North America currently holds the largest market share in the EDR sector, driven by high technological adoption, stringent regulatory frameworks, and a large number of enterprises. However, the Asia-Pacific region is projected to exhibit significant growth in the coming years.
- By Component: Solutions currently hold a larger market share than services, but services are growing rapidly.
- By Deployment Type: Cloud-based deployments are experiencing faster growth than on-premise solutions, reflecting the increasing preference for scalability and cost efficiency.
- By Solution Type: Workstations dominate the solution type segment, followed by Servers and Mobile Devices. The Point of Sale Terminals segment is showing steady growth.
- By Organization Size: Large enterprises are the primary adopters due to their higher security budgets and increased vulnerability to cyberattacks.
- By End-user Industry: BFSI, IT & Telecom, and Healthcare are leading sectors due to their stringent security requirements and substantial data assets.
Key drivers for these segments include increased investment in cybersecurity infrastructure, supportive regulatory environments, and a rising awareness of the financial and reputational consequences of cyber breaches.
Endpoint Detection and Response Market Product Innovations
Recent innovations in EDR focus on leveraging AI and machine learning to enhance threat detection and response capabilities. This includes advancements in behavioral analysis, threat hunting, and automated remediation. Many vendors offer integrated platforms combining EDR with other security solutions, such as Security Information and Event Management (SIEM) and Extended Detection and Response (XDR), delivering comprehensive security ecosystems. Unique selling propositions revolve around speed of detection, accuracy of alerts, ease of use, and integration capabilities.
Propelling Factors for Endpoint Detection and Response Market Growth
The EDR market's expansion is driven by several factors: the escalating frequency and sophistication of cyberattacks, the growing adoption of cloud computing, and the increasing demand for automated security solutions. Stringent government regulations regarding data protection, like GDPR and CCPA, further incentivize the adoption of robust EDR solutions. The rising adoption of IoT devices and the increasing reliance on mobile and remote work also contribute to market growth.
Obstacles in the Endpoint Detection and Response Market
Despite significant growth, the EDR market faces challenges, including the high cost of implementation and maintenance, complexity in integration with existing security systems, and the persistent skills gap in cybersecurity expertise. Competition among vendors is fierce, leading to price pressures and the need for continuous innovation. Supply chain disruptions can also impact the availability of EDR solutions, potentially hindering market expansion.
Future Opportunities in Endpoint Detection and Response Market
Future growth opportunities lie in expanding into emerging markets, particularly in developing economies. Further development and adoption of XDR solutions offer significant market potential. The integration of EDR with other security layers, including network security and cloud security, will further enhance its value proposition. Focus on improving user experience and enhancing ease of management will also drive market expansion.
Major Players in the Endpoint Detection and Response Market Ecosystem
- Musarubra US LLC (Trellix)
- Fortinet Inc
- Cybereason Inc
- Cisco Systems Inc
- Broadcom Inc
- Sophos Ltd
- Open Text Corporation
- CrowdStrike Inc
- Fortra LLC
- Palo Alto Networks Inc
- Deep Instinct Ltd
Key Developments in Endpoint Detection and Response Market Industry
- October 2023: HarfangLab secures EUR 25 Million in Series A funding, boosting European expansion and potentially contributing to market growth.
- August 2023: Fortinet wins Google Cloud Technology Partner of the Year Award for Security, highlighting the effectiveness of its FortiEDR solution and potentially driving future market growth.
Strategic Endpoint Detection and Response Market Forecast
The EDR market is poised for continued growth, driven by technological advancements, increasing cyber threats, and expanding adoption across various industries. Future opportunities include the integration of AI and automation, the expansion into new markets, and the development of advanced threat hunting capabilities. This will lead to increased market penetration and higher adoption rates, fueling significant market expansion in the coming years.
Endpoint Detection and Response Market Segmentation
-
1. Component
- 1.1. Solutions
- 1.2. Services
-
2. Deployment Type
- 2.1. Cloud-based
- 2.2. On-premise
-
3. Solution Type
- 3.1. Workstations
- 3.2. Mobile Devices
- 3.3. Servers
- 3.4. Point of Sale Terminals
-
4. Organization Size
- 4.1. Small And Medium Enterprises (SMES)
- 4.2. Large Enterprises
-
5. End-user Industry
- 5.1. BFSI
- 5.2. IT and Telecom
- 5.3. Manufacturing
- 5.4. Healthcare
- 5.5. Retail
- 5.6. Other End-user Industries
Endpoint Detection and Response Market Segmentation By Geography
-
1. North America
- 1.1. United States
- 1.2. Canada
-
2. Europe
- 2.1. Germany
- 2.2. United Kingdom
- 2.3. France
-
3. Asia
- 3.1. China
- 3.2. Japan
- 3.3. India
- 4. Australia and New Zealand
- 5. Middle East and Africa
- 6. Latin America
Endpoint Detection and Response Market REPORT HIGHLIGHTS
| Aspects | Details |
|---|---|
| Study Period | 2019-2033 |
| Base Year | 2024 |
| Estimated Year | 2025 |
| Forecast Period | 2025-2033 |
| Historical Period | 2019-2024 |
| Growth Rate | CAGR of 24.80% from 2019-2033 |
| Segmentation |
|
Table of Contents
- 1. Introduction
- 1.1. Research Scope
- 1.2. Market Segmentation
- 1.3. Research Methodology
- 1.4. Definitions and Assumptions
- 2. Executive Summary
- 2.1. Introduction
- 3. Market Dynamics
- 3.1. Introduction
- 3.2. Market Drivers
- 3.2.1. Increasing Expansion of Enterprise Mobility; Bring your Own Device (BYOD) Adoption and Increased Remote Working
- 3.3. Market Restrains
- 3.3.1. Limited Development in the Field of Low-Voltage Fuses and Unorganized Aftermarket in the Fuse Market
- 3.4. Market Trends
- 3.4.1. Small and Medium Enterprises (SMEs) to Witness Major Growth
- 4. Market Factor Analysis
- 4.1. Porters Five Forces
- 4.2. Supply/Value Chain
- 4.3. PESTEL analysis
- 4.4. Market Entropy
- 4.5. Patent/Trademark Analysis
- 5. Global Endpoint Detection and Response Market Analysis, Insights and Forecast, 2019-2031
- 5.1. Market Analysis, Insights and Forecast - by Component
- 5.1.1. Solutions
- 5.1.2. Services
- 5.2. Market Analysis, Insights and Forecast - by Deployment Type
- 5.2.1. Cloud-based
- 5.2.2. On-premise
- 5.3. Market Analysis, Insights and Forecast - by Solution Type
- 5.3.1. Workstations
- 5.3.2. Mobile Devices
- 5.3.3. Servers
- 5.3.4. Point of Sale Terminals
- 5.4. Market Analysis, Insights and Forecast - by Organization Size
- 5.4.1. Small And Medium Enterprises (SMES)
- 5.4.2. Large Enterprises
- 5.5. Market Analysis, Insights and Forecast - by End-user Industry
- 5.5.1. BFSI
- 5.5.2. IT and Telecom
- 5.5.3. Manufacturing
- 5.5.4. Healthcare
- 5.5.5. Retail
- 5.5.6. Other End-user Industries
- 5.6. Market Analysis, Insights and Forecast - by Region
- 5.6.1. North America
- 5.6.2. Europe
- 5.6.3. Asia
- 5.6.4. Australia and New Zealand
- 5.6.5. Middle East and Africa
- 5.6.6. Latin America
- 5.1. Market Analysis, Insights and Forecast - by Component
- 6. North America Endpoint Detection and Response Market Analysis, Insights and Forecast, 2019-2031
- 6.1. Market Analysis, Insights and Forecast - by Component
- 6.1.1. Solutions
- 6.1.2. Services
- 6.2. Market Analysis, Insights and Forecast - by Deployment Type
- 6.2.1. Cloud-based
- 6.2.2. On-premise
- 6.3. Market Analysis, Insights and Forecast - by Solution Type
- 6.3.1. Workstations
- 6.3.2. Mobile Devices
- 6.3.3. Servers
- 6.3.4. Point of Sale Terminals
- 6.4. Market Analysis, Insights and Forecast - by Organization Size
- 6.4.1. Small And Medium Enterprises (SMES)
- 6.4.2. Large Enterprises
- 6.5. Market Analysis, Insights and Forecast - by End-user Industry
- 6.5.1. BFSI
- 6.5.2. IT and Telecom
- 6.5.3. Manufacturing
- 6.5.4. Healthcare
- 6.5.5. Retail
- 6.5.6. Other End-user Industries
- 6.1. Market Analysis, Insights and Forecast - by Component
- 7. Europe Endpoint Detection and Response Market Analysis, Insights and Forecast, 2019-2031
- 7.1. Market Analysis, Insights and Forecast - by Component
- 7.1.1. Solutions
- 7.1.2. Services
- 7.2. Market Analysis, Insights and Forecast - by Deployment Type
- 7.2.1. Cloud-based
- 7.2.2. On-premise
- 7.3. Market Analysis, Insights and Forecast - by Solution Type
- 7.3.1. Workstations
- 7.3.2. Mobile Devices
- 7.3.3. Servers
- 7.3.4. Point of Sale Terminals
- 7.4. Market Analysis, Insights and Forecast - by Organization Size
- 7.4.1. Small And Medium Enterprises (SMES)
- 7.4.2. Large Enterprises
- 7.5. Market Analysis, Insights and Forecast - by End-user Industry
- 7.5.1. BFSI
- 7.5.2. IT and Telecom
- 7.5.3. Manufacturing
- 7.5.4. Healthcare
- 7.5.5. Retail
- 7.5.6. Other End-user Industries
- 7.1. Market Analysis, Insights and Forecast - by Component
- 8. Asia Endpoint Detection and Response Market Analysis, Insights and Forecast, 2019-2031
- 8.1. Market Analysis, Insights and Forecast - by Component
- 8.1.1. Solutions
- 8.1.2. Services
- 8.2. Market Analysis, Insights and Forecast - by Deployment Type
- 8.2.1. Cloud-based
- 8.2.2. On-premise
- 8.3. Market Analysis, Insights and Forecast - by Solution Type
- 8.3.1. Workstations
- 8.3.2. Mobile Devices
- 8.3.3. Servers
- 8.3.4. Point of Sale Terminals
- 8.4. Market Analysis, Insights and Forecast - by Organization Size
- 8.4.1. Small And Medium Enterprises (SMES)
- 8.4.2. Large Enterprises
- 8.5. Market Analysis, Insights and Forecast - by End-user Industry
- 8.5.1. BFSI
- 8.5.2. IT and Telecom
- 8.5.3. Manufacturing
- 8.5.4. Healthcare
- 8.5.5. Retail
- 8.5.6. Other End-user Industries
- 8.1. Market Analysis, Insights and Forecast - by Component
- 9. Australia and New Zealand Endpoint Detection and Response Market Analysis, Insights and Forecast, 2019-2031
- 9.1. Market Analysis, Insights and Forecast - by Component
- 9.1.1. Solutions
- 9.1.2. Services
- 9.2. Market Analysis, Insights and Forecast - by Deployment Type
- 9.2.1. Cloud-based
- 9.2.2. On-premise
- 9.3. Market Analysis, Insights and Forecast - by Solution Type
- 9.3.1. Workstations
- 9.3.2. Mobile Devices
- 9.3.3. Servers
- 9.3.4. Point of Sale Terminals
- 9.4. Market Analysis, Insights and Forecast - by Organization Size
- 9.4.1. Small And Medium Enterprises (SMES)
- 9.4.2. Large Enterprises
- 9.5. Market Analysis, Insights and Forecast - by End-user Industry
- 9.5.1. BFSI
- 9.5.2. IT and Telecom
- 9.5.3. Manufacturing
- 9.5.4. Healthcare
- 9.5.5. Retail
- 9.5.6. Other End-user Industries
- 9.1. Market Analysis, Insights and Forecast - by Component
- 10. Middle East and Africa Endpoint Detection and Response Market Analysis, Insights and Forecast, 2019-2031
- 10.1. Market Analysis, Insights and Forecast - by Component
- 10.1.1. Solutions
- 10.1.2. Services
- 10.2. Market Analysis, Insights and Forecast - by Deployment Type
- 10.2.1. Cloud-based
- 10.2.2. On-premise
- 10.3. Market Analysis, Insights and Forecast - by Solution Type
- 10.3.1. Workstations
- 10.3.2. Mobile Devices
- 10.3.3. Servers
- 10.3.4. Point of Sale Terminals
- 10.4. Market Analysis, Insights and Forecast - by Organization Size
- 10.4.1. Small And Medium Enterprises (SMES)
- 10.4.2. Large Enterprises
- 10.5. Market Analysis, Insights and Forecast - by End-user Industry
- 10.5.1. BFSI
- 10.5.2. IT and Telecom
- 10.5.3. Manufacturing
- 10.5.4. Healthcare
- 10.5.5. Retail
- 10.5.6. Other End-user Industries
- 10.1. Market Analysis, Insights and Forecast - by Component
- 11. Latin America Endpoint Detection and Response Market Analysis, Insights and Forecast, 2019-2031
- 11.1. Market Analysis, Insights and Forecast - by Component
- 11.1.1. Solutions
- 11.1.2. Services
- 11.2. Market Analysis, Insights and Forecast - by Deployment Type
- 11.2.1. Cloud-based
- 11.2.2. On-premise
- 11.3. Market Analysis, Insights and Forecast - by Solution Type
- 11.3.1. Workstations
- 11.3.2. Mobile Devices
- 11.3.3. Servers
- 11.3.4. Point of Sale Terminals
- 11.4. Market Analysis, Insights and Forecast - by Organization Size
- 11.4.1. Small And Medium Enterprises (SMES)
- 11.4.2. Large Enterprises
- 11.5. Market Analysis, Insights and Forecast - by End-user Industry
- 11.5.1. BFSI
- 11.5.2. IT and Telecom
- 11.5.3. Manufacturing
- 11.5.4. Healthcare
- 11.5.5. Retail
- 11.5.6. Other End-user Industries
- 11.1. Market Analysis, Insights and Forecast - by Component
- 12. North America Endpoint Detection and Response Market Analysis, Insights and Forecast, 2019-2031
- 12.1. Market Analysis, Insights and Forecast - By Country/Sub-region
- 12.1.1 United States
- 12.1.2 Canada
- 13. Europe Endpoint Detection and Response Market Analysis, Insights and Forecast, 2019-2031
- 13.1. Market Analysis, Insights and Forecast - By Country/Sub-region
- 13.1.1 Germany
- 13.1.2 United Kingdom
- 13.1.3 France
- 14. Asia Endpoint Detection and Response Market Analysis, Insights and Forecast, 2019-2031
- 14.1. Market Analysis, Insights and Forecast - By Country/Sub-region
- 14.1.1 China
- 14.1.2 Japan
- 14.1.3 India
- 14.1.4 Australia and New Zealand
- 15. Middle East and Africa Endpoint Detection and Response Market Analysis, Insights and Forecast, 2019-2031
- 15.1. Market Analysis, Insights and Forecast - By Country/Sub-region
- 15.1.1.
- 16. Latin America Endpoint Detection and Response Market Analysis, Insights and Forecast, 2019-2031
- 16.1. Market Analysis, Insights and Forecast - By Country/Sub-region
- 16.1.1.
- 17. Competitive Analysis
- 17.1. Global Market Share Analysis 2024
- 17.2. Company Profiles
- 17.2.1 Musarubra US LLC (Trellix)
- 17.2.1.1. Overview
- 17.2.1.2. Products
- 17.2.1.3. SWOT Analysis
- 17.2.1.4. Recent Developments
- 17.2.1.5. Financials (Based on Availability)
- 17.2.2 Fortinet Inc
- 17.2.2.1. Overview
- 17.2.2.2. Products
- 17.2.2.3. SWOT Analysis
- 17.2.2.4. Recent Developments
- 17.2.2.5. Financials (Based on Availability)
- 17.2.3 Cybereason Inc
- 17.2.3.1. Overview
- 17.2.3.2. Products
- 17.2.3.3. SWOT Analysis
- 17.2.3.4. Recent Developments
- 17.2.3.5. Financials (Based on Availability)
- 17.2.4 Cisco Systems Inc
- 17.2.4.1. Overview
- 17.2.4.2. Products
- 17.2.4.3. SWOT Analysis
- 17.2.4.4. Recent Developments
- 17.2.4.5. Financials (Based on Availability)
- 17.2.5 Broadcom Inc
- 17.2.5.1. Overview
- 17.2.5.2. Products
- 17.2.5.3. SWOT Analysis
- 17.2.5.4. Recent Developments
- 17.2.5.5. Financials (Based on Availability)
- 17.2.6 Sophos Ltd
- 17.2.6.1. Overview
- 17.2.6.2. Products
- 17.2.6.3. SWOT Analysis
- 17.2.6.4. Recent Developments
- 17.2.6.5. Financials (Based on Availability)
- 17.2.7 Open Text Corporation
- 17.2.7.1. Overview
- 17.2.7.2. Products
- 17.2.7.3. SWOT Analysis
- 17.2.7.4. Recent Developments
- 17.2.7.5. Financials (Based on Availability)
- 17.2.8 CrowdStrike Inc
- 17.2.8.1. Overview
- 17.2.8.2. Products
- 17.2.8.3. SWOT Analysis
- 17.2.8.4. Recent Developments
- 17.2.8.5. Financials (Based on Availability)
- 17.2.9 Fortra LLC
- 17.2.9.1. Overview
- 17.2.9.2. Products
- 17.2.9.3. SWOT Analysis
- 17.2.9.4. Recent Developments
- 17.2.9.5. Financials (Based on Availability)
- 17.2.10 Palo Alto Networks Inc
- 17.2.10.1. Overview
- 17.2.10.2. Products
- 17.2.10.3. SWOT Analysis
- 17.2.10.4. Recent Developments
- 17.2.10.5. Financials (Based on Availability)
- 17.2.11 Deep Instinct Ltd
- 17.2.11.1. Overview
- 17.2.11.2. Products
- 17.2.11.3. SWOT Analysis
- 17.2.11.4. Recent Developments
- 17.2.11.5. Financials (Based on Availability)
- 17.2.1 Musarubra US LLC (Trellix)
List of Figures
- Figure 1: Global Endpoint Detection and Response Market Revenue Breakdown (Million, %) by Region 2024 & 2032
- Figure 2: North America Endpoint Detection and Response Market Revenue (Million), by Country 2024 & 2032
- Figure 3: North America Endpoint Detection and Response Market Revenue Share (%), by Country 2024 & 2032
- Figure 4: Europe Endpoint Detection and Response Market Revenue (Million), by Country 2024 & 2032
- Figure 5: Europe Endpoint Detection and Response Market Revenue Share (%), by Country 2024 & 2032
- Figure 6: Asia Endpoint Detection and Response Market Revenue (Million), by Country 2024 & 2032
- Figure 7: Asia Endpoint Detection and Response Market Revenue Share (%), by Country 2024 & 2032
- Figure 8: Middle East and Africa Endpoint Detection and Response Market Revenue (Million), by Country 2024 & 2032
- Figure 9: Middle East and Africa Endpoint Detection and Response Market Revenue Share (%), by Country 2024 & 2032
- Figure 10: Latin America Endpoint Detection and Response Market Revenue (Million), by Country 2024 & 2032
- Figure 11: Latin America Endpoint Detection and Response Market Revenue Share (%), by Country 2024 & 2032
- Figure 12: North America Endpoint Detection and Response Market Revenue (Million), by Component 2024 & 2032
- Figure 13: North America Endpoint Detection and Response Market Revenue Share (%), by Component 2024 & 2032
- Figure 14: North America Endpoint Detection and Response Market Revenue (Million), by Deployment Type 2024 & 2032
- Figure 15: North America Endpoint Detection and Response Market Revenue Share (%), by Deployment Type 2024 & 2032
- Figure 16: North America Endpoint Detection and Response Market Revenue (Million), by Solution Type 2024 & 2032
- Figure 17: North America Endpoint Detection and Response Market Revenue Share (%), by Solution Type 2024 & 2032
- Figure 18: North America Endpoint Detection and Response Market Revenue (Million), by Organization Size 2024 & 2032
- Figure 19: North America Endpoint Detection and Response Market Revenue Share (%), by Organization Size 2024 & 2032
- Figure 20: North America Endpoint Detection and Response Market Revenue (Million), by End-user Industry 2024 & 2032
- Figure 21: North America Endpoint Detection and Response Market Revenue Share (%), by End-user Industry 2024 & 2032
- Figure 22: North America Endpoint Detection and Response Market Revenue (Million), by Country 2024 & 2032
- Figure 23: North America Endpoint Detection and Response Market Revenue Share (%), by Country 2024 & 2032
- Figure 24: Europe Endpoint Detection and Response Market Revenue (Million), by Component 2024 & 2032
- Figure 25: Europe Endpoint Detection and Response Market Revenue Share (%), by Component 2024 & 2032
- Figure 26: Europe Endpoint Detection and Response Market Revenue (Million), by Deployment Type 2024 & 2032
- Figure 27: Europe Endpoint Detection and Response Market Revenue Share (%), by Deployment Type 2024 & 2032
- Figure 28: Europe Endpoint Detection and Response Market Revenue (Million), by Solution Type 2024 & 2032
- Figure 29: Europe Endpoint Detection and Response Market Revenue Share (%), by Solution Type 2024 & 2032
- Figure 30: Europe Endpoint Detection and Response Market Revenue (Million), by Organization Size 2024 & 2032
- Figure 31: Europe Endpoint Detection and Response Market Revenue Share (%), by Organization Size 2024 & 2032
- Figure 32: Europe Endpoint Detection and Response Market Revenue (Million), by End-user Industry 2024 & 2032
- Figure 33: Europe Endpoint Detection and Response Market Revenue Share (%), by End-user Industry 2024 & 2032
- Figure 34: Europe Endpoint Detection and Response Market Revenue (Million), by Country 2024 & 2032
- Figure 35: Europe Endpoint Detection and Response Market Revenue Share (%), by Country 2024 & 2032
- Figure 36: Asia Endpoint Detection and Response Market Revenue (Million), by Component 2024 & 2032
- Figure 37: Asia Endpoint Detection and Response Market Revenue Share (%), by Component 2024 & 2032
- Figure 38: Asia Endpoint Detection and Response Market Revenue (Million), by Deployment Type 2024 & 2032
- Figure 39: Asia Endpoint Detection and Response Market Revenue Share (%), by Deployment Type 2024 & 2032
- Figure 40: Asia Endpoint Detection and Response Market Revenue (Million), by Solution Type 2024 & 2032
- Figure 41: Asia Endpoint Detection and Response Market Revenue Share (%), by Solution Type 2024 & 2032
- Figure 42: Asia Endpoint Detection and Response Market Revenue (Million), by Organization Size 2024 & 2032
- Figure 43: Asia Endpoint Detection and Response Market Revenue Share (%), by Organization Size 2024 & 2032
- Figure 44: Asia Endpoint Detection and Response Market Revenue (Million), by End-user Industry 2024 & 2032
- Figure 45: Asia Endpoint Detection and Response Market Revenue Share (%), by End-user Industry 2024 & 2032
- Figure 46: Asia Endpoint Detection and Response Market Revenue (Million), by Country 2024 & 2032
- Figure 47: Asia Endpoint Detection and Response Market Revenue Share (%), by Country 2024 & 2032
- Figure 48: Australia and New Zealand Endpoint Detection and Response Market Revenue (Million), by Component 2024 & 2032
- Figure 49: Australia and New Zealand Endpoint Detection and Response Market Revenue Share (%), by Component 2024 & 2032
- Figure 50: Australia and New Zealand Endpoint Detection and Response Market Revenue (Million), by Deployment Type 2024 & 2032
- Figure 51: Australia and New Zealand Endpoint Detection and Response Market Revenue Share (%), by Deployment Type 2024 & 2032
- Figure 52: Australia and New Zealand Endpoint Detection and Response Market Revenue (Million), by Solution Type 2024 & 2032
- Figure 53: Australia and New Zealand Endpoint Detection and Response Market Revenue Share (%), by Solution Type 2024 & 2032
- Figure 54: Australia and New Zealand Endpoint Detection and Response Market Revenue (Million), by Organization Size 2024 & 2032
- Figure 55: Australia and New Zealand Endpoint Detection and Response Market Revenue Share (%), by Organization Size 2024 & 2032
- Figure 56: Australia and New Zealand Endpoint Detection and Response Market Revenue (Million), by End-user Industry 2024 & 2032
- Figure 57: Australia and New Zealand Endpoint Detection and Response Market Revenue Share (%), by End-user Industry 2024 & 2032
- Figure 58: Australia and New Zealand Endpoint Detection and Response Market Revenue (Million), by Country 2024 & 2032
- Figure 59: Australia and New Zealand Endpoint Detection and Response Market Revenue Share (%), by Country 2024 & 2032
- Figure 60: Middle East and Africa Endpoint Detection and Response Market Revenue (Million), by Component 2024 & 2032
- Figure 61: Middle East and Africa Endpoint Detection and Response Market Revenue Share (%), by Component 2024 & 2032
- Figure 62: Middle East and Africa Endpoint Detection and Response Market Revenue (Million), by Deployment Type 2024 & 2032
- Figure 63: Middle East and Africa Endpoint Detection and Response Market Revenue Share (%), by Deployment Type 2024 & 2032
- Figure 64: Middle East and Africa Endpoint Detection and Response Market Revenue (Million), by Solution Type 2024 & 2032
- Figure 65: Middle East and Africa Endpoint Detection and Response Market Revenue Share (%), by Solution Type 2024 & 2032
- Figure 66: Middle East and Africa Endpoint Detection and Response Market Revenue (Million), by Organization Size 2024 & 2032
- Figure 67: Middle East and Africa Endpoint Detection and Response Market Revenue Share (%), by Organization Size 2024 & 2032
- Figure 68: Middle East and Africa Endpoint Detection and Response Market Revenue (Million), by End-user Industry 2024 & 2032
- Figure 69: Middle East and Africa Endpoint Detection and Response Market Revenue Share (%), by End-user Industry 2024 & 2032
- Figure 70: Middle East and Africa Endpoint Detection and Response Market Revenue (Million), by Country 2024 & 2032
- Figure 71: Middle East and Africa Endpoint Detection and Response Market Revenue Share (%), by Country 2024 & 2032
- Figure 72: Latin America Endpoint Detection and Response Market Revenue (Million), by Component 2024 & 2032
- Figure 73: Latin America Endpoint Detection and Response Market Revenue Share (%), by Component 2024 & 2032
- Figure 74: Latin America Endpoint Detection and Response Market Revenue (Million), by Deployment Type 2024 & 2032
- Figure 75: Latin America Endpoint Detection and Response Market Revenue Share (%), by Deployment Type 2024 & 2032
- Figure 76: Latin America Endpoint Detection and Response Market Revenue (Million), by Solution Type 2024 & 2032
- Figure 77: Latin America Endpoint Detection and Response Market Revenue Share (%), by Solution Type 2024 & 2032
- Figure 78: Latin America Endpoint Detection and Response Market Revenue (Million), by Organization Size 2024 & 2032
- Figure 79: Latin America Endpoint Detection and Response Market Revenue Share (%), by Organization Size 2024 & 2032
- Figure 80: Latin America Endpoint Detection and Response Market Revenue (Million), by End-user Industry 2024 & 2032
- Figure 81: Latin America Endpoint Detection and Response Market Revenue Share (%), by End-user Industry 2024 & 2032
- Figure 82: Latin America Endpoint Detection and Response Market Revenue (Million), by Country 2024 & 2032
- Figure 83: Latin America Endpoint Detection and Response Market Revenue Share (%), by Country 2024 & 2032
List of Tables
- Table 1: Global Endpoint Detection and Response Market Revenue Million Forecast, by Region 2019 & 2032
- Table 2: Global Endpoint Detection and Response Market Revenue Million Forecast, by Component 2019 & 2032
- Table 3: Global Endpoint Detection and Response Market Revenue Million Forecast, by Deployment Type 2019 & 2032
- Table 4: Global Endpoint Detection and Response Market Revenue Million Forecast, by Solution Type 2019 & 2032
- Table 5: Global Endpoint Detection and Response Market Revenue Million Forecast, by Organization Size 2019 & 2032
- Table 6: Global Endpoint Detection and Response Market Revenue Million Forecast, by End-user Industry 2019 & 2032
- Table 7: Global Endpoint Detection and Response Market Revenue Million Forecast, by Region 2019 & 2032
- Table 8: Global Endpoint Detection and Response Market Revenue Million Forecast, by Country 2019 & 2032
- Table 9: United States Endpoint Detection and Response Market Revenue (Million) Forecast, by Application 2019 & 2032
- Table 10: Canada Endpoint Detection and Response Market Revenue (Million) Forecast, by Application 2019 & 2032
- Table 11: Global Endpoint Detection and Response Market Revenue Million Forecast, by Country 2019 & 2032
- Table 12: Germany Endpoint Detection and Response Market Revenue (Million) Forecast, by Application 2019 & 2032
- Table 13: United Kingdom Endpoint Detection and Response Market Revenue (Million) Forecast, by Application 2019 & 2032
- Table 14: France Endpoint Detection and Response Market Revenue (Million) Forecast, by Application 2019 & 2032
- Table 15: Global Endpoint Detection and Response Market Revenue Million Forecast, by Country 2019 & 2032
- Table 16: China Endpoint Detection and Response Market Revenue (Million) Forecast, by Application 2019 & 2032
- Table 17: Japan Endpoint Detection and Response Market Revenue (Million) Forecast, by Application 2019 & 2032
- Table 18: India Endpoint Detection and Response Market Revenue (Million) Forecast, by Application 2019 & 2032
- Table 19: Australia and New Zealand Endpoint Detection and Response Market Revenue (Million) Forecast, by Application 2019 & 2032
- Table 20: Global Endpoint Detection and Response Market Revenue Million Forecast, by Country 2019 & 2032
- Table 21: Endpoint Detection and Response Market Revenue (Million) Forecast, by Application 2019 & 2032
- Table 22: Global Endpoint Detection and Response Market Revenue Million Forecast, by Country 2019 & 2032
- Table 23: Endpoint Detection and Response Market Revenue (Million) Forecast, by Application 2019 & 2032
- Table 24: Global Endpoint Detection and Response Market Revenue Million Forecast, by Component 2019 & 2032
- Table 25: Global Endpoint Detection and Response Market Revenue Million Forecast, by Deployment Type 2019 & 2032
- Table 26: Global Endpoint Detection and Response Market Revenue Million Forecast, by Solution Type 2019 & 2032
- Table 27: Global Endpoint Detection and Response Market Revenue Million Forecast, by Organization Size 2019 & 2032
- Table 28: Global Endpoint Detection and Response Market Revenue Million Forecast, by End-user Industry 2019 & 2032
- Table 29: Global Endpoint Detection and Response Market Revenue Million Forecast, by Country 2019 & 2032
- Table 30: United States Endpoint Detection and Response Market Revenue (Million) Forecast, by Application 2019 & 2032
- Table 31: Canada Endpoint Detection and Response Market Revenue (Million) Forecast, by Application 2019 & 2032
- Table 32: Global Endpoint Detection and Response Market Revenue Million Forecast, by Component 2019 & 2032
- Table 33: Global Endpoint Detection and Response Market Revenue Million Forecast, by Deployment Type 2019 & 2032
- Table 34: Global Endpoint Detection and Response Market Revenue Million Forecast, by Solution Type 2019 & 2032
- Table 35: Global Endpoint Detection and Response Market Revenue Million Forecast, by Organization Size 2019 & 2032
- Table 36: Global Endpoint Detection and Response Market Revenue Million Forecast, by End-user Industry 2019 & 2032
- Table 37: Global Endpoint Detection and Response Market Revenue Million Forecast, by Country 2019 & 2032
- Table 38: Germany Endpoint Detection and Response Market Revenue (Million) Forecast, by Application 2019 & 2032
- Table 39: United Kingdom Endpoint Detection and Response Market Revenue (Million) Forecast, by Application 2019 & 2032
- Table 40: France Endpoint Detection and Response Market Revenue (Million) Forecast, by Application 2019 & 2032
- Table 41: Global Endpoint Detection and Response Market Revenue Million Forecast, by Component 2019 & 2032
- Table 42: Global Endpoint Detection and Response Market Revenue Million Forecast, by Deployment Type 2019 & 2032
- Table 43: Global Endpoint Detection and Response Market Revenue Million Forecast, by Solution Type 2019 & 2032
- Table 44: Global Endpoint Detection and Response Market Revenue Million Forecast, by Organization Size 2019 & 2032
- Table 45: Global Endpoint Detection and Response Market Revenue Million Forecast, by End-user Industry 2019 & 2032
- Table 46: Global Endpoint Detection and Response Market Revenue Million Forecast, by Country 2019 & 2032
- Table 47: China Endpoint Detection and Response Market Revenue (Million) Forecast, by Application 2019 & 2032
- Table 48: Japan Endpoint Detection and Response Market Revenue (Million) Forecast, by Application 2019 & 2032
- Table 49: India Endpoint Detection and Response Market Revenue (Million) Forecast, by Application 2019 & 2032
- Table 50: Global Endpoint Detection and Response Market Revenue Million Forecast, by Component 2019 & 2032
- Table 51: Global Endpoint Detection and Response Market Revenue Million Forecast, by Deployment Type 2019 & 2032
- Table 52: Global Endpoint Detection and Response Market Revenue Million Forecast, by Solution Type 2019 & 2032
- Table 53: Global Endpoint Detection and Response Market Revenue Million Forecast, by Organization Size 2019 & 2032
- Table 54: Global Endpoint Detection and Response Market Revenue Million Forecast, by End-user Industry 2019 & 2032
- Table 55: Global Endpoint Detection and Response Market Revenue Million Forecast, by Country 2019 & 2032
- Table 56: Global Endpoint Detection and Response Market Revenue Million Forecast, by Component 2019 & 2032
- Table 57: Global Endpoint Detection and Response Market Revenue Million Forecast, by Deployment Type 2019 & 2032
- Table 58: Global Endpoint Detection and Response Market Revenue Million Forecast, by Solution Type 2019 & 2032
- Table 59: Global Endpoint Detection and Response Market Revenue Million Forecast, by Organization Size 2019 & 2032
- Table 60: Global Endpoint Detection and Response Market Revenue Million Forecast, by End-user Industry 2019 & 2032
- Table 61: Global Endpoint Detection and Response Market Revenue Million Forecast, by Country 2019 & 2032
- Table 62: Global Endpoint Detection and Response Market Revenue Million Forecast, by Component 2019 & 2032
- Table 63: Global Endpoint Detection and Response Market Revenue Million Forecast, by Deployment Type 2019 & 2032
- Table 64: Global Endpoint Detection and Response Market Revenue Million Forecast, by Solution Type 2019 & 2032
- Table 65: Global Endpoint Detection and Response Market Revenue Million Forecast, by Organization Size 2019 & 2032
- Table 66: Global Endpoint Detection and Response Market Revenue Million Forecast, by End-user Industry 2019 & 2032
- Table 67: Global Endpoint Detection and Response Market Revenue Million Forecast, by Country 2019 & 2032
Frequently Asked Questions
1. What is the projected Compound Annual Growth Rate (CAGR) of the Endpoint Detection and Response Market?
The projected CAGR is approximately 24.80%.
2. Which companies are prominent players in the Endpoint Detection and Response Market?
Key companies in the market include Musarubra US LLC (Trellix), Fortinet Inc, Cybereason Inc, Cisco Systems Inc, Broadcom Inc, Sophos Ltd, Open Text Corporation, CrowdStrike Inc, Fortra LLC, Palo Alto Networks Inc, Deep Instinct Ltd.
3. What are the main segments of the Endpoint Detection and Response Market?
The market segments include Component, Deployment Type, Solution Type, Organization Size, End-user Industry.
4. Can you provide details about the market size?
The market size is estimated to be USD 4.09 Million as of 2022.
5. What are some drivers contributing to market growth?
Increasing Expansion of Enterprise Mobility; Bring your Own Device (BYOD) Adoption and Increased Remote Working.
6. What are the notable trends driving market growth?
Small and Medium Enterprises (SMEs) to Witness Major Growth.
7. Are there any restraints impacting market growth?
Limited Development in the Field of Low-Voltage Fuses and Unorganized Aftermarket in the Fuse Market.
8. Can you provide examples of recent developments in the market?
October 2023: HarfangLab, a French cybersecurity company offering endpoint detection and response (EDR) solutions to enhance the identification and neutralization of cyberattacks against companies, has closed a EUR 25 million Series A funding round, which would be used to accelerate HarfangLab's business expansion in Europe, and can support the market growth.
9. What pricing options are available for accessing the report?
Pricing options include single-user, multi-user, and enterprise licenses priced at USD 4750, USD 5250, and USD 8750 respectively.
10. Is the market size provided in terms of value or volume?
The market size is provided in terms of value, measured in Million.
11. Are there any specific market keywords associated with the report?
Yes, the market keyword associated with the report is "Endpoint Detection and Response Market," which aids in identifying and referencing the specific market segment covered.
12. How do I determine which pricing option suits my needs best?
The pricing options vary based on user requirements and access needs. Individual users may opt for single-user licenses, while businesses requiring broader access may choose multi-user or enterprise licenses for cost-effective access to the report.
13. Are there any additional resources or data provided in the Endpoint Detection and Response Market report?
While the report offers comprehensive insights, it's advisable to review the specific contents or supplementary materials provided to ascertain if additional resources or data are available.
14. How can I stay updated on further developments or reports in the Endpoint Detection and Response Market?
To stay informed about further developments, trends, and reports in the Endpoint Detection and Response Market, consider subscribing to industry newsletters, following relevant companies and organizations, or regularly checking reputable industry news sources and publications.
Methodology
Step 1 - Identification of Relevant Samples Size from Population Database


Step 2 - Approaches for Defining Global Market Size (Value, Volume* & Price*)

Note*: In applicable scenarios
Step 3 - Data Sources
Primary Research
- Web Analytics
- Survey Reports
- Research Institute
- Latest Research Reports
- Opinion Leaders
Secondary Research
- Annual Reports
- White Paper
- Latest Press Release
- Industry Association
- Paid Database
- Investor Presentations

Step 4 - Data Triangulation
Involves using different sources of information in order to increase the validity of a study
These sources are likely to be stakeholders in a program - participants, other researchers, program staff, other community members, and so on.
Then we put all data in single framework & apply various statistical tools to find out the dynamic on the market.
During the analysis stage, feedback from the stakeholder groups would be compared to determine areas of agreement as well as areas of divergence
