

Key Insights
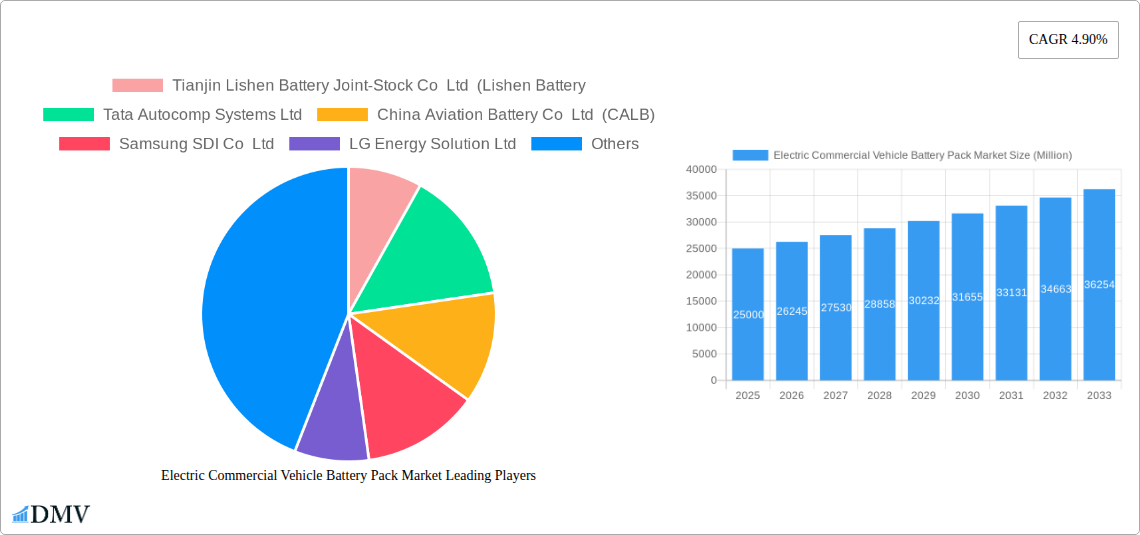
The Electric Commercial Vehicle (ECV) battery pack market is experiencing robust growth, driven by stringent emission regulations globally, increasing fuel costs, and the rising adoption of sustainable transportation solutions. The market's Compound Annual Growth Rate (CAGR) of 4.90% from 2019 to 2024 suggests a significant expansion, projected to continue through 2033. Several factors contribute to this growth, including advancements in battery technology, leading to increased energy density, longer lifespan, and reduced costs. The shift towards Battery Electric Vehicles (BEVs) within the commercial vehicle segment is a key driver, surpassing Plug-in Hybrid Electric Vehicles (PHEVs) in market share due to their greater range and environmental benefits. Different battery chemistries, including Lithium Iron Phosphate (LFP), Nickel Cobalt Aluminum (NCA), Nickel Cobalt Manganese (NCM), and Nickel Manganese Cobalt (NMC), cater to diverse performance and cost requirements, with LFP gaining traction for its cost-effectiveness and safety profile. The market is further segmented by battery capacity (kWh), form factor (cylindrical, pouch, prismatic), manufacturing methods, and component materials (anode, cathode, electrolyte, separator). Leading players like CATL, BYD, LG Energy Solution, and Panasonic are heavily invested in research and development, driving innovation and competition within this dynamic market. Different vehicle types, including buses, light commercial vehicles (LCVs), and medium & heavy-duty trucks (M&HDTs) contribute to the market's diversification, with each segment exhibiting unique battery pack requirements based on payload, range, and operational conditions.
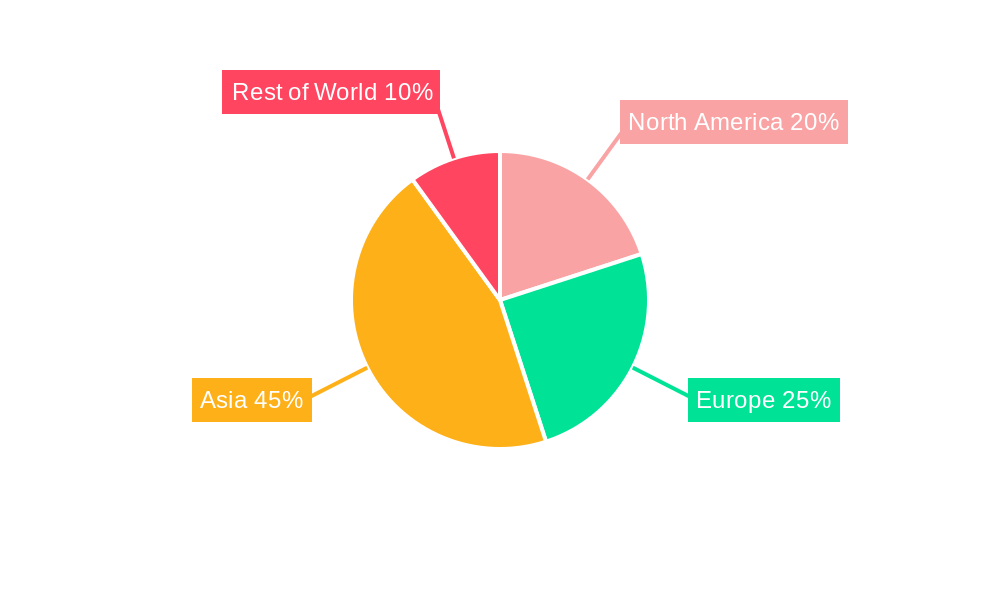
The geographic distribution of the ECV battery pack market is likely to reflect existing automotive manufacturing hubs and government policies supporting electric vehicle adoption. Regions with strong EV infrastructure and supportive regulations will witness faster growth. While precise regional data is unavailable, it's reasonable to anticipate that Asia, particularly China, will maintain a dominant market share due to its large manufacturing base and substantial government incentives for electric vehicles. Europe and North America are also expected to demonstrate significant growth, driven by ambitious emission reduction targets and increasing consumer demand for eco-friendly commercial vehicles. The continued development of charging infrastructure and advancements in battery technology are poised to further accelerate market expansion in the coming years. Competition among battery manufacturers will intensify, necessitating continuous innovation and cost optimization strategies for sustained success in this rapidly evolving landscape.
Electric Commercial Vehicle Battery Pack Market: A Comprehensive Report (2019-2033)
This insightful report provides a detailed analysis of the Electric Commercial Vehicle Battery Pack Market, offering crucial insights for stakeholders seeking to navigate this rapidly evolving landscape. The study period covers 2019-2033, with 2025 serving as the base and estimated year. The market is segmented by propulsion type (BEV, PHEV), battery chemistry (LFP, NCA, NCM, NMC, Others), capacity (Less than 15 kWh, 15 kWh to 40 kWh, 40 kWh to 80 kWh, Above 80 kWh), battery form (Cylindrical, Pouch, Prismatic), production method (Laser, Wire), component (Anode, Cathode, Electrolyte, Separator), material type (Cobalt, Lithium, Manganese, Natural Graphite, Nickel, Other Materials), and body type (Bus, LCV, M&HDT). Key players such as Tianjin Lishen Battery Joint-Stock Co Ltd (Lishen Battery), Tata Autocomp Systems Ltd, China Aviation Battery Co Ltd (CALB), Samsung SDI Co Ltd, LG Energy Solution Ltd, A123 Systems LLC, Guoxuan High-tech Co Ltd, Farasis Energy (Ganzhou) Co Ltd, Contemporary Amperex Technology Co Ltd (CATL), BYD Company Ltd, Sunwoda Electric Vehicle Battery Co Ltd (Sunwoda), SK Innovation Co Ltd, EVE Energy Co Ltd, and Panasonic Holdings Corporation are analyzed in detail. The market is projected to reach xx Million by 2033.
Electric Commercial Vehicle Battery Pack Market Market Composition & Trends
The Electric Commercial Vehicle Battery Pack market is experiencing significant growth, driven by stringent emission regulations and the increasing adoption of electric commercial vehicles across various sectors. Market concentration is moderate, with a few major players holding significant market share, while several smaller companies are also contributing. Innovation is fueled by advancements in battery chemistry, cell design, and thermal management systems. Regulatory landscapes vary across regions, influencing adoption rates and investment decisions. Substitute products, such as alternative fuel vehicles, pose a competitive challenge, although the cost-effectiveness and environmental benefits of electric vehicles are becoming increasingly prominent. End-user profiles include logistics companies, public transportation authorities, and various industrial sectors. M&A activities are frequent, with deal values in the range of xx Million to xx Million, reflecting the strategic importance of securing battery supply chains and technological expertise.
- Market Share Distribution: CATL and BYD hold a significant portion of the market, followed by LG Energy Solution and others. The exact figures are detailed in the full report.
- M&A Deal Values: Recent transactions indicate increasing consolidation within the market, especially in segments like LFP battery technology.
- Innovation Catalysts: Government incentives, R&D investments, and the push towards sustainability are key drivers.
- Regulatory Landscape: Stringent emission standards in key markets are pushing adoption forward, while subsidies and tax breaks further encourage growth.
Electric Commercial Vehicle Battery Pack Market Industry Evolution
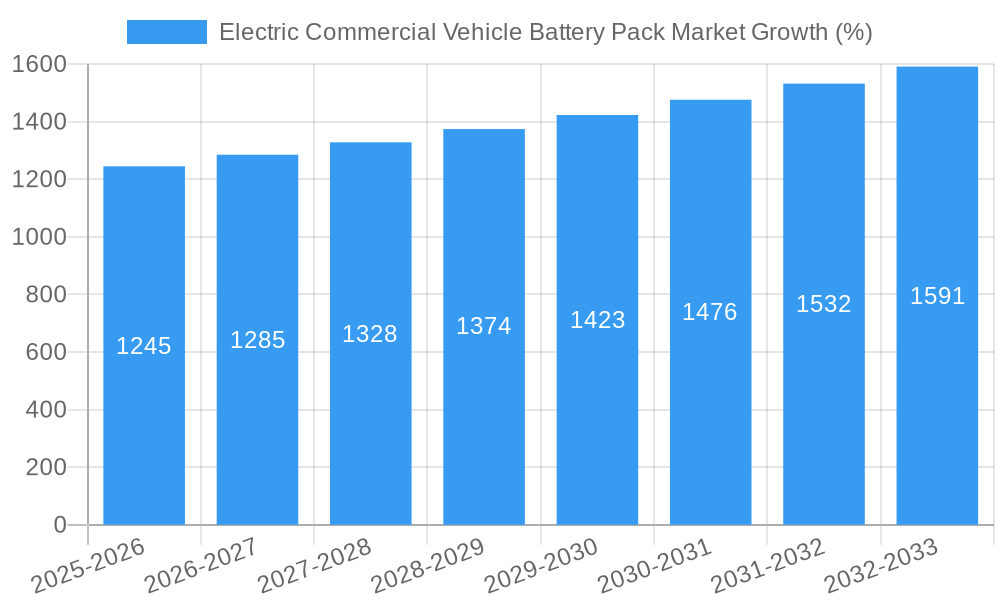
The Electric Commercial Vehicle Battery Pack market has witnessed exponential growth over the historical period (2019-2024), expanding at a CAGR of xx%. This growth trajectory is expected to continue throughout the forecast period (2025-2033), driven by several factors. Technological advancements, including improvements in energy density, charging speed, and battery lifespan, are enhancing the appeal of electric commercial vehicles. Shifting consumer demands, particularly a greater emphasis on environmental sustainability and reduced operating costs, are also playing a significant role. The increasing affordability of electric commercial vehicles is further stimulating market growth. Adoption rates are growing rapidly, with a significant increase in the number of electric buses and light commercial vehicles deployed globally. Furthermore, the development of advanced battery management systems (BMS) and fast-charging infrastructure is accelerating market expansion. The market is expected to surpass xx Million in revenue by 2033.
Leading Regions, Countries, or Segments in Electric Commercial Vehicle Battery Pack Market
China currently dominates the Electric Commercial Vehicle Battery Pack market, driven by robust government support, a large domestic market for electric vehicles, and a well-established battery manufacturing ecosystem. Europe and North America are also significant markets exhibiting strong growth. Within the segments, the BEV segment is experiencing the most rapid growth, surpassing the PHEV segment. LFP battery chemistry holds the largest market share currently, though NCM and NMC are gaining traction due to their higher energy density. The 40 kWh to 80 kWh capacity range holds the largest market share, followed by the Above 80 kWh segment as higher capacity packs become more prevalent in larger commercial vehicles. Prismatic battery form factor is leading the market for its higher energy density and scalability, while the Wire method holds dominance due to higher efficiency. The Cathode component is crucial for battery performance and is witnessing higher growth compared to other components. Lithium is the dominant material used in batteries, followed by Cobalt and Manganese. The Bus body type has the highest market share, driven by increasing adoption of electric buses in public transportation.
- Key Drivers:
- China's dominance: Strong government support, substantial manufacturing capacity, and a large domestic market are crucial factors.
- European and North American Growth: Stringent emission regulations and increasing consumer awareness of sustainability are fueling adoption.
- Technological Advancements: Improvements in battery chemistry, energy density, and charging times are driving market expansion.
- Investment Trends: Significant investments in battery manufacturing facilities and R&D activities are supporting growth.
Electric Commercial Vehicle Battery Pack Market Product Innovations
Recent innovations focus on improving energy density, extending battery lifespan, and enhancing safety features. New battery chemistries, such as solid-state batteries, are emerging as promising alternatives to traditional lithium-ion batteries. Advancements in battery thermal management systems are improving performance and safety in extreme temperature conditions. The integration of advanced battery management systems (BMS) is optimizing battery performance, extending lifespan, and enhancing safety. These innovations are driving higher adoption of electric commercial vehicles by ensuring improved performance and reliability.
Propelling Factors for Electric Commercial Vehicle Battery Pack Market Growth
Technological advancements in battery technology, such as improved energy density and charging speed, are a major growth driver. Government regulations promoting the adoption of electric vehicles, including subsidies and emission standards, are also significantly impacting market growth. Economic factors such as decreasing battery costs and lower operating costs compared to conventional vehicles are further boosting market expansion. The growing awareness of environmental concerns and the need for sustainable transportation solutions is driving the transition to electric commercial vehicles.
Obstacles in the Electric Commercial Vehicle Battery Pack Market Market
Supply chain disruptions, particularly for critical raw materials like lithium and cobalt, pose a significant challenge. The high initial cost of electric commercial vehicles compared to conventional vehicles can act as a barrier to adoption, especially for smaller businesses. Regulatory uncertainty and inconsistencies across different regions can hinder the deployment of electric vehicles and charging infrastructure. Intense competition among battery manufacturers and electric vehicle manufacturers further creates challenges.
Future Opportunities in Electric Commercial Vehicle Battery Pack Market
The emergence of new battery technologies, such as solid-state batteries, presents significant growth opportunities. Expanding into new markets, particularly in developing countries with growing transportation needs, offers immense potential. The increasing demand for last-mile delivery solutions and the growth of e-commerce are also creating opportunities for electric commercial vehicles. The development of advanced battery management systems (BMS) and integrated battery solutions also present opportunities.
Major Players in the Electric Commercial Vehicle Battery Pack Ecosystem
- Tianjin Lishen Battery Joint-Stock Co Ltd (Lishen Battery)
- Tata Autocomp Systems Ltd
- China Aviation Battery Co Ltd (CALB)
- Samsung SDI Co Ltd
- LG Energy Solution Ltd
- A123 Systems LLC
- Guoxuan High-tech Co Ltd
- Farasis Energy (Ganzhou) Co Ltd
- Contemporary Amperex Technology Co Ltd (CATL)
- BYD Company Ltd
- Sunwoda Electric Vehicle Battery Co Ltd (Sunwoda)
- SK Innovation Co Ltd
- EVE Energy Co Ltd
- Panasonic Holdings Corporation
Key Developments in Electric Commercial Vehicle Battery Pack Market Industry
- February 2023: LG Energy Solution announced a 50% increase in investment to 10 trillion won, expanding its global production capacity to 300 GWh. This significantly increases their market presence and capacity to meet the growing demand.
- February 2023: LG Energy Solution launched the world's first battery passport, promoting sustainability and traceability within the battery value chain. This initiative enhances consumer confidence and promotes ethical sourcing.
- February 2023: LG Energy Solution signed a multi-year contract with Freudenberg e-Power Systems for the supply of 19 GWh of lithium-ion battery cell modules. This strategic partnership secures a major supply agreement and further expands LG's market reach.
Strategic Electric Commercial Vehicle Battery Pack Market Market Forecast
The Electric Commercial Vehicle Battery Pack market is poised for continued strong growth, driven by technological advancements, supportive government policies, and increasing environmental awareness. Future opportunities lie in the development and adoption of next-generation battery technologies, expansion into new markets, and the integration of smart battery management systems. The market is expected to experience significant expansion, with continued growth expected across all major segments.
Electric Commercial Vehicle Battery Pack Market Segmentation
-
1. Body Type
- 1.1. Bus
- 1.2. LCV
- 1.3. M&HDT
-
2. Propulsion Type
- 2.1. BEV
- 2.2. PHEV
-
3. Battery Chemistry
- 3.1. LFP
- 3.2. NCA
- 3.3. NCM
- 3.4. NMC
- 3.5. Others
-
4. Capacity
- 4.1. 15 kWh to 40 kWh
- 4.2. 40 kWh to 80 kWh
- 4.3. Above 80 kWh
- 4.4. Less than 15 kWh
-
5. Battery Form
- 5.1. Cylindrical
- 5.2. Pouch
- 5.3. Prismatic
-
6. Method
- 6.1. Laser
- 6.2. Wire
-
7. Component
- 7.1. Anode
- 7.2. Cathode
- 7.3. Electrolyte
- 7.4. Separator
-
8. Material Type
- 8.1. Cobalt
- 8.2. Lithium
- 8.3. Manganese
- 8.4. Natural Graphite
- 8.5. Nickel
- 8.6. Other Materials
Electric Commercial Vehicle Battery Pack Market Segmentation By Geography
-
1. North America
- 1.1. United States
- 1.2. Canada
- 1.3. Mexico
-
2. South America
- 2.1. Brazil
- 2.2. Argentina
- 2.3. Rest of South America
-
3. Europe
- 3.1. United Kingdom
- 3.2. Germany
- 3.3. France
- 3.4. Italy
- 3.5. Spain
- 3.6. Russia
- 3.7. Benelux
- 3.8. Nordics
- 3.9. Rest of Europe
-
4. Middle East & Africa
- 4.1. Turkey
- 4.2. Israel
- 4.3. GCC
- 4.4. North Africa
- 4.5. South Africa
- 4.6. Rest of Middle East & Africa
-
5. Asia Pacific
- 5.1. China
- 5.2. India
- 5.3. Japan
- 5.4. South Korea
- 5.5. ASEAN
- 5.6. Oceania
- 5.7. Rest of Asia Pacific
Electric Commercial Vehicle Battery Pack Market REPORT HIGHLIGHTS
| Aspects | Details |
|---|---|
| Study Period | 2019-2033 |
| Base Year | 2024 |
| Estimated Year | 2025 |
| Forecast Period | 2025-2033 |
| Historical Period | 2019-2024 |
| Growth Rate | CAGR of 4.90% from 2019-2033 |
| Segmentation |
|
Table of Contents
- 1. Introduction
- 1.1. Research Scope
- 1.2. Market Segmentation
- 1.3. Research Methodology
- 1.4. Definitions and Assumptions
- 2. Executive Summary
- 2.1. Introduction
- 3. Market Dynamics
- 3.1. Introduction
- 3.2. Market Drivers
- 3.2.1. The Rise of Trade Agreements Between Nations; Increasing Volume of International Trade
- 3.3. Market Restrains
- 3.3.1. Surge in Fuel Costs Affecting the Market
- 3.4. Market Trends
- 3.4.1. OTHER KEY INDUSTRY TRENDS COVERED IN THE REPORT
- 4. Market Factor Analysis
- 4.1. Porters Five Forces
- 4.2. Supply/Value Chain
- 4.3. PESTEL analysis
- 4.4. Market Entropy
- 4.5. Patent/Trademark Analysis
- 5. Global Electric Commercial Vehicle Battery Pack Market Analysis, Insights and Forecast, 2019-2031
- 5.1. Market Analysis, Insights and Forecast - by Body Type
- 5.1.1. Bus
- 5.1.2. LCV
- 5.1.3. M&HDT
- 5.2. Market Analysis, Insights and Forecast - by Propulsion Type
- 5.2.1. BEV
- 5.2.2. PHEV
- 5.3. Market Analysis, Insights and Forecast - by Battery Chemistry
- 5.3.1. LFP
- 5.3.2. NCA
- 5.3.3. NCM
- 5.3.4. NMC
- 5.3.5. Others
- 5.4. Market Analysis, Insights and Forecast - by Capacity
- 5.4.1. 15 kWh to 40 kWh
- 5.4.2. 40 kWh to 80 kWh
- 5.4.3. Above 80 kWh
- 5.4.4. Less than 15 kWh
- 5.5. Market Analysis, Insights and Forecast - by Battery Form
- 5.5.1. Cylindrical
- 5.5.2. Pouch
- 5.5.3. Prismatic
- 5.6. Market Analysis, Insights and Forecast - by Method
- 5.6.1. Laser
- 5.6.2. Wire
- 5.7. Market Analysis, Insights and Forecast - by Component
- 5.7.1. Anode
- 5.7.2. Cathode
- 5.7.3. Electrolyte
- 5.7.4. Separator
- 5.8. Market Analysis, Insights and Forecast - by Material Type
- 5.8.1. Cobalt
- 5.8.2. Lithium
- 5.8.3. Manganese
- 5.8.4. Natural Graphite
- 5.8.5. Nickel
- 5.8.6. Other Materials
- 5.9. Market Analysis, Insights and Forecast - by Region
- 5.9.1. North America
- 5.9.2. South America
- 5.9.3. Europe
- 5.9.4. Middle East & Africa
- 5.9.5. Asia Pacific
- 5.1. Market Analysis, Insights and Forecast - by Body Type
- 6. North America Electric Commercial Vehicle Battery Pack Market Analysis, Insights and Forecast, 2019-2031
- 6.1. Market Analysis, Insights and Forecast - by Body Type
- 6.1.1. Bus
- 6.1.2. LCV
- 6.1.3. M&HDT
- 6.2. Market Analysis, Insights and Forecast - by Propulsion Type
- 6.2.1. BEV
- 6.2.2. PHEV
- 6.3. Market Analysis, Insights and Forecast - by Battery Chemistry
- 6.3.1. LFP
- 6.3.2. NCA
- 6.3.3. NCM
- 6.3.4. NMC
- 6.3.5. Others
- 6.4. Market Analysis, Insights and Forecast - by Capacity
- 6.4.1. 15 kWh to 40 kWh
- 6.4.2. 40 kWh to 80 kWh
- 6.4.3. Above 80 kWh
- 6.4.4. Less than 15 kWh
- 6.5. Market Analysis, Insights and Forecast - by Battery Form
- 6.5.1. Cylindrical
- 6.5.2. Pouch
- 6.5.3. Prismatic
- 6.6. Market Analysis, Insights and Forecast - by Method
- 6.6.1. Laser
- 6.6.2. Wire
- 6.7. Market Analysis, Insights and Forecast - by Component
- 6.7.1. Anode
- 6.7.2. Cathode
- 6.7.3. Electrolyte
- 6.7.4. Separator
- 6.8. Market Analysis, Insights and Forecast - by Material Type
- 6.8.1. Cobalt
- 6.8.2. Lithium
- 6.8.3. Manganese
- 6.8.4. Natural Graphite
- 6.8.5. Nickel
- 6.8.6. Other Materials
- 6.1. Market Analysis, Insights and Forecast - by Body Type
- 7. South America Electric Commercial Vehicle Battery Pack Market Analysis, Insights and Forecast, 2019-2031
- 7.1. Market Analysis, Insights and Forecast - by Body Type
- 7.1.1. Bus
- 7.1.2. LCV
- 7.1.3. M&HDT
- 7.2. Market Analysis, Insights and Forecast - by Propulsion Type
- 7.2.1. BEV
- 7.2.2. PHEV
- 7.3. Market Analysis, Insights and Forecast - by Battery Chemistry
- 7.3.1. LFP
- 7.3.2. NCA
- 7.3.3. NCM
- 7.3.4. NMC
- 7.3.5. Others
- 7.4. Market Analysis, Insights and Forecast - by Capacity
- 7.4.1. 15 kWh to 40 kWh
- 7.4.2. 40 kWh to 80 kWh
- 7.4.3. Above 80 kWh
- 7.4.4. Less than 15 kWh
- 7.5. Market Analysis, Insights and Forecast - by Battery Form
- 7.5.1. Cylindrical
- 7.5.2. Pouch
- 7.5.3. Prismatic
- 7.6. Market Analysis, Insights and Forecast - by Method
- 7.6.1. Laser
- 7.6.2. Wire
- 7.7. Market Analysis, Insights and Forecast - by Component
- 7.7.1. Anode
- 7.7.2. Cathode
- 7.7.3. Electrolyte
- 7.7.4. Separator
- 7.8. Market Analysis, Insights and Forecast - by Material Type
- 7.8.1. Cobalt
- 7.8.2. Lithium
- 7.8.3. Manganese
- 7.8.4. Natural Graphite
- 7.8.5. Nickel
- 7.8.6. Other Materials
- 7.1. Market Analysis, Insights and Forecast - by Body Type
- 8. Europe Electric Commercial Vehicle Battery Pack Market Analysis, Insights and Forecast, 2019-2031
- 8.1. Market Analysis, Insights and Forecast - by Body Type
- 8.1.1. Bus
- 8.1.2. LCV
- 8.1.3. M&HDT
- 8.2. Market Analysis, Insights and Forecast - by Propulsion Type
- 8.2.1. BEV
- 8.2.2. PHEV
- 8.3. Market Analysis, Insights and Forecast - by Battery Chemistry
- 8.3.1. LFP
- 8.3.2. NCA
- 8.3.3. NCM
- 8.3.4. NMC
- 8.3.5. Others
- 8.4. Market Analysis, Insights and Forecast - by Capacity
- 8.4.1. 15 kWh to 40 kWh
- 8.4.2. 40 kWh to 80 kWh
- 8.4.3. Above 80 kWh
- 8.4.4. Less than 15 kWh
- 8.5. Market Analysis, Insights and Forecast - by Battery Form
- 8.5.1. Cylindrical
- 8.5.2. Pouch
- 8.5.3. Prismatic
- 8.6. Market Analysis, Insights and Forecast - by Method
- 8.6.1. Laser
- 8.6.2. Wire
- 8.7. Market Analysis, Insights and Forecast - by Component
- 8.7.1. Anode
- 8.7.2. Cathode
- 8.7.3. Electrolyte
- 8.7.4. Separator
- 8.8. Market Analysis, Insights and Forecast - by Material Type
- 8.8.1. Cobalt
- 8.8.2. Lithium
- 8.8.3. Manganese
- 8.8.4. Natural Graphite
- 8.8.5. Nickel
- 8.8.6. Other Materials
- 8.1. Market Analysis, Insights and Forecast - by Body Type
- 9. Middle East & Africa Electric Commercial Vehicle Battery Pack Market Analysis, Insights and Forecast, 2019-2031
- 9.1. Market Analysis, Insights and Forecast - by Body Type
- 9.1.1. Bus
- 9.1.2. LCV
- 9.1.3. M&HDT
- 9.2. Market Analysis, Insights and Forecast - by Propulsion Type
- 9.2.1. BEV
- 9.2.2. PHEV
- 9.3. Market Analysis, Insights and Forecast - by Battery Chemistry
- 9.3.1. LFP
- 9.3.2. NCA
- 9.3.3. NCM
- 9.3.4. NMC
- 9.3.5. Others
- 9.4. Market Analysis, Insights and Forecast - by Capacity
- 9.4.1. 15 kWh to 40 kWh
- 9.4.2. 40 kWh to 80 kWh
- 9.4.3. Above 80 kWh
- 9.4.4. Less than 15 kWh
- 9.5. Market Analysis, Insights and Forecast - by Battery Form
- 9.5.1. Cylindrical
- 9.5.2. Pouch
- 9.5.3. Prismatic
- 9.6. Market Analysis, Insights and Forecast - by Method
- 9.6.1. Laser
- 9.6.2. Wire
- 9.7. Market Analysis, Insights and Forecast - by Component
- 9.7.1. Anode
- 9.7.2. Cathode
- 9.7.3. Electrolyte
- 9.7.4. Separator
- 9.8. Market Analysis, Insights and Forecast - by Material Type
- 9.8.1. Cobalt
- 9.8.2. Lithium
- 9.8.3. Manganese
- 9.8.4. Natural Graphite
- 9.8.5. Nickel
- 9.8.6. Other Materials
- 9.1. Market Analysis, Insights and Forecast - by Body Type
- 10. Asia Pacific Electric Commercial Vehicle Battery Pack Market Analysis, Insights and Forecast, 2019-2031
- 10.1. Market Analysis, Insights and Forecast - by Body Type
- 10.1.1. Bus
- 10.1.2. LCV
- 10.1.3. M&HDT
- 10.2. Market Analysis, Insights and Forecast - by Propulsion Type
- 10.2.1. BEV
- 10.2.2. PHEV
- 10.3. Market Analysis, Insights and Forecast - by Battery Chemistry
- 10.3.1. LFP
- 10.3.2. NCA
- 10.3.3. NCM
- 10.3.4. NMC
- 10.3.5. Others
- 10.4. Market Analysis, Insights and Forecast - by Capacity
- 10.4.1. 15 kWh to 40 kWh
- 10.4.2. 40 kWh to 80 kWh
- 10.4.3. Above 80 kWh
- 10.4.4. Less than 15 kWh
- 10.5. Market Analysis, Insights and Forecast - by Battery Form
- 10.5.1. Cylindrical
- 10.5.2. Pouch
- 10.5.3. Prismatic
- 10.6. Market Analysis, Insights and Forecast - by Method
- 10.6.1. Laser
- 10.6.2. Wire
- 10.7. Market Analysis, Insights and Forecast - by Component
- 10.7.1. Anode
- 10.7.2. Cathode
- 10.7.3. Electrolyte
- 10.7.4. Separator
- 10.8. Market Analysis, Insights and Forecast - by Material Type
- 10.8.1. Cobalt
- 10.8.2. Lithium
- 10.8.3. Manganese
- 10.8.4. Natural Graphite
- 10.8.5. Nickel
- 10.8.6. Other Materials
- 10.1. Market Analysis, Insights and Forecast - by Body Type
- 11. Competitive Analysis
- 11.1. Global Market Share Analysis 2024
- 11.2. Company Profiles
- 11.2.1 Tianjin Lishen Battery Joint-Stock Co Ltd (Lishen Battery
- 11.2.1.1. Overview
- 11.2.1.2. Products
- 11.2.1.3. SWOT Analysis
- 11.2.1.4. Recent Developments
- 11.2.1.5. Financials (Based on Availability)
- 11.2.2 Tata Autocomp Systems Ltd
- 11.2.2.1. Overview
- 11.2.2.2. Products
- 11.2.2.3. SWOT Analysis
- 11.2.2.4. Recent Developments
- 11.2.2.5. Financials (Based on Availability)
- 11.2.3 China Aviation Battery Co Ltd (CALB)
- 11.2.3.1. Overview
- 11.2.3.2. Products
- 11.2.3.3. SWOT Analysis
- 11.2.3.4. Recent Developments
- 11.2.3.5. Financials (Based on Availability)
- 11.2.4 Samsung SDI Co Ltd
- 11.2.4.1. Overview
- 11.2.4.2. Products
- 11.2.4.3. SWOT Analysis
- 11.2.4.4. Recent Developments
- 11.2.4.5. Financials (Based on Availability)
- 11.2.5 LG Energy Solution Ltd
- 11.2.5.1. Overview
- 11.2.5.2. Products
- 11.2.5.3. SWOT Analysis
- 11.2.5.4. Recent Developments
- 11.2.5.5. Financials (Based on Availability)
- 11.2.6 A123 Systems LLC
- 11.2.6.1. Overview
- 11.2.6.2. Products
- 11.2.6.3. SWOT Analysis
- 11.2.6.4. Recent Developments
- 11.2.6.5. Financials (Based on Availability)
- 11.2.7 Guoxuan High-tech Co Ltd
- 11.2.7.1. Overview
- 11.2.7.2. Products
- 11.2.7.3. SWOT Analysis
- 11.2.7.4. Recent Developments
- 11.2.7.5. Financials (Based on Availability)
- 11.2.8 Farasis Energy (Ganzhou) Co Ltd
- 11.2.8.1. Overview
- 11.2.8.2. Products
- 11.2.8.3. SWOT Analysis
- 11.2.8.4. Recent Developments
- 11.2.8.5. Financials (Based on Availability)
- 11.2.9 Contemporary Amperex Technology Co Ltd (CATL)
- 11.2.9.1. Overview
- 11.2.9.2. Products
- 11.2.9.3. SWOT Analysis
- 11.2.9.4. Recent Developments
- 11.2.9.5. Financials (Based on Availability)
- 11.2.10 BYD Company Ltd
- 11.2.10.1. Overview
- 11.2.10.2. Products
- 11.2.10.3. SWOT Analysis
- 11.2.10.4. Recent Developments
- 11.2.10.5. Financials (Based on Availability)
- 11.2.11 Sunwoda Electric Vehicle Battery Co Ltd (Sunwoda)
- 11.2.11.1. Overview
- 11.2.11.2. Products
- 11.2.11.3. SWOT Analysis
- 11.2.11.4. Recent Developments
- 11.2.11.5. Financials (Based on Availability)
- 11.2.12 SK Innovation Co Ltd
- 11.2.12.1. Overview
- 11.2.12.2. Products
- 11.2.12.3. SWOT Analysis
- 11.2.12.4. Recent Developments
- 11.2.12.5. Financials (Based on Availability)
- 11.2.13 EVE Energy Co Ltd
- 11.2.13.1. Overview
- 11.2.13.2. Products
- 11.2.13.3. SWOT Analysis
- 11.2.13.4. Recent Developments
- 11.2.13.5. Financials (Based on Availability)
- 11.2.14 Panasonic Holdings Corporation
- 11.2.14.1. Overview
- 11.2.14.2. Products
- 11.2.14.3. SWOT Analysis
- 11.2.14.4. Recent Developments
- 11.2.14.5. Financials (Based on Availability)
- 11.2.1 Tianjin Lishen Battery Joint-Stock Co Ltd (Lishen Battery
List of Figures
- Figure 1: Global Electric Commercial Vehicle Battery Pack Market Revenue Breakdown (Million, %) by Region 2024 & 2032
- Figure 2: North America Electric Commercial Vehicle Battery Pack Market Revenue (Million), by Body Type 2024 & 2032
- Figure 3: North America Electric Commercial Vehicle Battery Pack Market Revenue Share (%), by Body Type 2024 & 2032
- Figure 4: North America Electric Commercial Vehicle Battery Pack Market Revenue (Million), by Propulsion Type 2024 & 2032
- Figure 5: North America Electric Commercial Vehicle Battery Pack Market Revenue Share (%), by Propulsion Type 2024 & 2032
- Figure 6: North America Electric Commercial Vehicle Battery Pack Market Revenue (Million), by Battery Chemistry 2024 & 2032
- Figure 7: North America Electric Commercial Vehicle Battery Pack Market Revenue Share (%), by Battery Chemistry 2024 & 2032
- Figure 8: North America Electric Commercial Vehicle Battery Pack Market Revenue (Million), by Capacity 2024 & 2032
- Figure 9: North America Electric Commercial Vehicle Battery Pack Market Revenue Share (%), by Capacity 2024 & 2032
- Figure 10: North America Electric Commercial Vehicle Battery Pack Market Revenue (Million), by Battery Form 2024 & 2032
- Figure 11: North America Electric Commercial Vehicle Battery Pack Market Revenue Share (%), by Battery Form 2024 & 2032
- Figure 12: North America Electric Commercial Vehicle Battery Pack Market Revenue (Million), by Method 2024 & 2032
- Figure 13: North America Electric Commercial Vehicle Battery Pack Market Revenue Share (%), by Method 2024 & 2032
- Figure 14: North America Electric Commercial Vehicle Battery Pack Market Revenue (Million), by Component 2024 & 2032
- Figure 15: North America Electric Commercial Vehicle Battery Pack Market Revenue Share (%), by Component 2024 & 2032
- Figure 16: North America Electric Commercial Vehicle Battery Pack Market Revenue (Million), by Material Type 2024 & 2032
- Figure 17: North America Electric Commercial Vehicle Battery Pack Market Revenue Share (%), by Material Type 2024 & 2032
- Figure 18: North America Electric Commercial Vehicle Battery Pack Market Revenue (Million), by Country 2024 & 2032
- Figure 19: North America Electric Commercial Vehicle Battery Pack Market Revenue Share (%), by Country 2024 & 2032
- Figure 20: South America Electric Commercial Vehicle Battery Pack Market Revenue (Million), by Body Type 2024 & 2032
- Figure 21: South America Electric Commercial Vehicle Battery Pack Market Revenue Share (%), by Body Type 2024 & 2032
- Figure 22: South America Electric Commercial Vehicle Battery Pack Market Revenue (Million), by Propulsion Type 2024 & 2032
- Figure 23: South America Electric Commercial Vehicle Battery Pack Market Revenue Share (%), by Propulsion Type 2024 & 2032
- Figure 24: South America Electric Commercial Vehicle Battery Pack Market Revenue (Million), by Battery Chemistry 2024 & 2032
- Figure 25: South America Electric Commercial Vehicle Battery Pack Market Revenue Share (%), by Battery Chemistry 2024 & 2032
- Figure 26: South America Electric Commercial Vehicle Battery Pack Market Revenue (Million), by Capacity 2024 & 2032
- Figure 27: South America Electric Commercial Vehicle Battery Pack Market Revenue Share (%), by Capacity 2024 & 2032
- Figure 28: South America Electric Commercial Vehicle Battery Pack Market Revenue (Million), by Battery Form 2024 & 2032
- Figure 29: South America Electric Commercial Vehicle Battery Pack Market Revenue Share (%), by Battery Form 2024 & 2032
- Figure 30: South America Electric Commercial Vehicle Battery Pack Market Revenue (Million), by Method 2024 & 2032
- Figure 31: South America Electric Commercial Vehicle Battery Pack Market Revenue Share (%), by Method 2024 & 2032
- Figure 32: South America Electric Commercial Vehicle Battery Pack Market Revenue (Million), by Component 2024 & 2032
- Figure 33: South America Electric Commercial Vehicle Battery Pack Market Revenue Share (%), by Component 2024 & 2032
- Figure 34: South America Electric Commercial Vehicle Battery Pack Market Revenue (Million), by Material Type 2024 & 2032
- Figure 35: South America Electric Commercial Vehicle Battery Pack Market Revenue Share (%), by Material Type 2024 & 2032
- Figure 36: South America Electric Commercial Vehicle Battery Pack Market Revenue (Million), by Country 2024 & 2032
- Figure 37: South America Electric Commercial Vehicle Battery Pack Market Revenue Share (%), by Country 2024 & 2032
- Figure 38: Europe Electric Commercial Vehicle Battery Pack Market Revenue (Million), by Body Type 2024 & 2032
- Figure 39: Europe Electric Commercial Vehicle Battery Pack Market Revenue Share (%), by Body Type 2024 & 2032
- Figure 40: Europe Electric Commercial Vehicle Battery Pack Market Revenue (Million), by Propulsion Type 2024 & 2032
- Figure 41: Europe Electric Commercial Vehicle Battery Pack Market Revenue Share (%), by Propulsion Type 2024 & 2032
- Figure 42: Europe Electric Commercial Vehicle Battery Pack Market Revenue (Million), by Battery Chemistry 2024 & 2032
- Figure 43: Europe Electric Commercial Vehicle Battery Pack Market Revenue Share (%), by Battery Chemistry 2024 & 2032
- Figure 44: Europe Electric Commercial Vehicle Battery Pack Market Revenue (Million), by Capacity 2024 & 2032
- Figure 45: Europe Electric Commercial Vehicle Battery Pack Market Revenue Share (%), by Capacity 2024 & 2032
- Figure 46: Europe Electric Commercial Vehicle Battery Pack Market Revenue (Million), by Battery Form 2024 & 2032
- Figure 47: Europe Electric Commercial Vehicle Battery Pack Market Revenue Share (%), by Battery Form 2024 & 2032
- Figure 48: Europe Electric Commercial Vehicle Battery Pack Market Revenue (Million), by Method 2024 & 2032
- Figure 49: Europe Electric Commercial Vehicle Battery Pack Market Revenue Share (%), by Method 2024 & 2032
- Figure 50: Europe Electric Commercial Vehicle Battery Pack Market Revenue (Million), by Component 2024 & 2032
- Figure 51: Europe Electric Commercial Vehicle Battery Pack Market Revenue Share (%), by Component 2024 & 2032
- Figure 52: Europe Electric Commercial Vehicle Battery Pack Market Revenue (Million), by Material Type 2024 & 2032
- Figure 53: Europe Electric Commercial Vehicle Battery Pack Market Revenue Share (%), by Material Type 2024 & 2032
- Figure 54: Europe Electric Commercial Vehicle Battery Pack Market Revenue (Million), by Country 2024 & 2032
- Figure 55: Europe Electric Commercial Vehicle Battery Pack Market Revenue Share (%), by Country 2024 & 2032
- Figure 56: Middle East & Africa Electric Commercial Vehicle Battery Pack Market Revenue (Million), by Body Type 2024 & 2032
- Figure 57: Middle East & Africa Electric Commercial Vehicle Battery Pack Market Revenue Share (%), by Body Type 2024 & 2032
- Figure 58: Middle East & Africa Electric Commercial Vehicle Battery Pack Market Revenue (Million), by Propulsion Type 2024 & 2032
- Figure 59: Middle East & Africa Electric Commercial Vehicle Battery Pack Market Revenue Share (%), by Propulsion Type 2024 & 2032
- Figure 60: Middle East & Africa Electric Commercial Vehicle Battery Pack Market Revenue (Million), by Battery Chemistry 2024 & 2032
- Figure 61: Middle East & Africa Electric Commercial Vehicle Battery Pack Market Revenue Share (%), by Battery Chemistry 2024 & 2032
- Figure 62: Middle East & Africa Electric Commercial Vehicle Battery Pack Market Revenue (Million), by Capacity 2024 & 2032
- Figure 63: Middle East & Africa Electric Commercial Vehicle Battery Pack Market Revenue Share (%), by Capacity 2024 & 2032
- Figure 64: Middle East & Africa Electric Commercial Vehicle Battery Pack Market Revenue (Million), by Battery Form 2024 & 2032
- Figure 65: Middle East & Africa Electric Commercial Vehicle Battery Pack Market Revenue Share (%), by Battery Form 2024 & 2032
- Figure 66: Middle East & Africa Electric Commercial Vehicle Battery Pack Market Revenue (Million), by Method 2024 & 2032
- Figure 67: Middle East & Africa Electric Commercial Vehicle Battery Pack Market Revenue Share (%), by Method 2024 & 2032
- Figure 68: Middle East & Africa Electric Commercial Vehicle Battery Pack Market Revenue (Million), by Component 2024 & 2032
- Figure 69: Middle East & Africa Electric Commercial Vehicle Battery Pack Market Revenue Share (%), by Component 2024 & 2032
- Figure 70: Middle East & Africa Electric Commercial Vehicle Battery Pack Market Revenue (Million), by Material Type 2024 & 2032
- Figure 71: Middle East & Africa Electric Commercial Vehicle Battery Pack Market Revenue Share (%), by Material Type 2024 & 2032
- Figure 72: Middle East & Africa Electric Commercial Vehicle Battery Pack Market Revenue (Million), by Country 2024 & 2032
- Figure 73: Middle East & Africa Electric Commercial Vehicle Battery Pack Market Revenue Share (%), by Country 2024 & 2032
- Figure 74: Asia Pacific Electric Commercial Vehicle Battery Pack Market Revenue (Million), by Body Type 2024 & 2032
- Figure 75: Asia Pacific Electric Commercial Vehicle Battery Pack Market Revenue Share (%), by Body Type 2024 & 2032
- Figure 76: Asia Pacific Electric Commercial Vehicle Battery Pack Market Revenue (Million), by Propulsion Type 2024 & 2032
- Figure 77: Asia Pacific Electric Commercial Vehicle Battery Pack Market Revenue Share (%), by Propulsion Type 2024 & 2032
- Figure 78: Asia Pacific Electric Commercial Vehicle Battery Pack Market Revenue (Million), by Battery Chemistry 2024 & 2032
- Figure 79: Asia Pacific Electric Commercial Vehicle Battery Pack Market Revenue Share (%), by Battery Chemistry 2024 & 2032
- Figure 80: Asia Pacific Electric Commercial Vehicle Battery Pack Market Revenue (Million), by Capacity 2024 & 2032
- Figure 81: Asia Pacific Electric Commercial Vehicle Battery Pack Market Revenue Share (%), by Capacity 2024 & 2032
- Figure 82: Asia Pacific Electric Commercial Vehicle Battery Pack Market Revenue (Million), by Battery Form 2024 & 2032
- Figure 83: Asia Pacific Electric Commercial Vehicle Battery Pack Market Revenue Share (%), by Battery Form 2024 & 2032
- Figure 84: Asia Pacific Electric Commercial Vehicle Battery Pack Market Revenue (Million), by Method 2024 & 2032
- Figure 85: Asia Pacific Electric Commercial Vehicle Battery Pack Market Revenue Share (%), by Method 2024 & 2032
- Figure 86: Asia Pacific Electric Commercial Vehicle Battery Pack Market Revenue (Million), by Component 2024 & 2032
- Figure 87: Asia Pacific Electric Commercial Vehicle Battery Pack Market Revenue Share (%), by Component 2024 & 2032
- Figure 88: Asia Pacific Electric Commercial Vehicle Battery Pack Market Revenue (Million), by Material Type 2024 & 2032
- Figure 89: Asia Pacific Electric Commercial Vehicle Battery Pack Market Revenue Share (%), by Material Type 2024 & 2032
- Figure 90: Asia Pacific Electric Commercial Vehicle Battery Pack Market Revenue (Million), by Country 2024 & 2032
- Figure 91: Asia Pacific Electric Commercial Vehicle Battery Pack Market Revenue Share (%), by Country 2024 & 2032
List of Tables
- Table 1: Global Electric Commercial Vehicle Battery Pack Market Revenue Million Forecast, by Region 2019 & 2032
- Table 2: Global Electric Commercial Vehicle Battery Pack Market Revenue Million Forecast, by Body Type 2019 & 2032
- Table 3: Global Electric Commercial Vehicle Battery Pack Market Revenue Million Forecast, by Propulsion Type 2019 & 2032
- Table 4: Global Electric Commercial Vehicle Battery Pack Market Revenue Million Forecast, by Battery Chemistry 2019 & 2032
- Table 5: Global Electric Commercial Vehicle Battery Pack Market Revenue Million Forecast, by Capacity 2019 & 2032
- Table 6: Global Electric Commercial Vehicle Battery Pack Market Revenue Million Forecast, by Battery Form 2019 & 2032
- Table 7: Global Electric Commercial Vehicle Battery Pack Market Revenue Million Forecast, by Method 2019 & 2032
- Table 8: Global Electric Commercial Vehicle Battery Pack Market Revenue Million Forecast, by Component 2019 & 2032
- Table 9: Global Electric Commercial Vehicle Battery Pack Market Revenue Million Forecast, by Material Type 2019 & 2032
- Table 10: Global Electric Commercial Vehicle Battery Pack Market Revenue Million Forecast, by Region 2019 & 2032
- Table 11: Global Electric Commercial Vehicle Battery Pack Market Revenue Million Forecast, by Body Type 2019 & 2032
- Table 12: Global Electric Commercial Vehicle Battery Pack Market Revenue Million Forecast, by Propulsion Type 2019 & 2032
- Table 13: Global Electric Commercial Vehicle Battery Pack Market Revenue Million Forecast, by Battery Chemistry 2019 & 2032
- Table 14: Global Electric Commercial Vehicle Battery Pack Market Revenue Million Forecast, by Capacity 2019 & 2032
- Table 15: Global Electric Commercial Vehicle Battery Pack Market Revenue Million Forecast, by Battery Form 2019 & 2032
- Table 16: Global Electric Commercial Vehicle Battery Pack Market Revenue Million Forecast, by Method 2019 & 2032
- Table 17: Global Electric Commercial Vehicle Battery Pack Market Revenue Million Forecast, by Component 2019 & 2032
- Table 18: Global Electric Commercial Vehicle Battery Pack Market Revenue Million Forecast, by Material Type 2019 & 2032
- Table 19: Global Electric Commercial Vehicle Battery Pack Market Revenue Million Forecast, by Country 2019 & 2032
- Table 20: United States Electric Commercial Vehicle Battery Pack Market Revenue (Million) Forecast, by Application 2019 & 2032
- Table 21: Canada Electric Commercial Vehicle Battery Pack Market Revenue (Million) Forecast, by Application 2019 & 2032
- Table 22: Mexico Electric Commercial Vehicle Battery Pack Market Revenue (Million) Forecast, by Application 2019 & 2032
- Table 23: Global Electric Commercial Vehicle Battery Pack Market Revenue Million Forecast, by Body Type 2019 & 2032
- Table 24: Global Electric Commercial Vehicle Battery Pack Market Revenue Million Forecast, by Propulsion Type 2019 & 2032
- Table 25: Global Electric Commercial Vehicle Battery Pack Market Revenue Million Forecast, by Battery Chemistry 2019 & 2032
- Table 26: Global Electric Commercial Vehicle Battery Pack Market Revenue Million Forecast, by Capacity 2019 & 2032
- Table 27: Global Electric Commercial Vehicle Battery Pack Market Revenue Million Forecast, by Battery Form 2019 & 2032
- Table 28: Global Electric Commercial Vehicle Battery Pack Market Revenue Million Forecast, by Method 2019 & 2032
- Table 29: Global Electric Commercial Vehicle Battery Pack Market Revenue Million Forecast, by Component 2019 & 2032
- Table 30: Global Electric Commercial Vehicle Battery Pack Market Revenue Million Forecast, by Material Type 2019 & 2032
- Table 31: Global Electric Commercial Vehicle Battery Pack Market Revenue Million Forecast, by Country 2019 & 2032
- Table 32: Brazil Electric Commercial Vehicle Battery Pack Market Revenue (Million) Forecast, by Application 2019 & 2032
- Table 33: Argentina Electric Commercial Vehicle Battery Pack Market Revenue (Million) Forecast, by Application 2019 & 2032
- Table 34: Rest of South America Electric Commercial Vehicle Battery Pack Market Revenue (Million) Forecast, by Application 2019 & 2032
- Table 35: Global Electric Commercial Vehicle Battery Pack Market Revenue Million Forecast, by Body Type 2019 & 2032
- Table 36: Global Electric Commercial Vehicle Battery Pack Market Revenue Million Forecast, by Propulsion Type 2019 & 2032
- Table 37: Global Electric Commercial Vehicle Battery Pack Market Revenue Million Forecast, by Battery Chemistry 2019 & 2032
- Table 38: Global Electric Commercial Vehicle Battery Pack Market Revenue Million Forecast, by Capacity 2019 & 2032
- Table 39: Global Electric Commercial Vehicle Battery Pack Market Revenue Million Forecast, by Battery Form 2019 & 2032
- Table 40: Global Electric Commercial Vehicle Battery Pack Market Revenue Million Forecast, by Method 2019 & 2032
- Table 41: Global Electric Commercial Vehicle Battery Pack Market Revenue Million Forecast, by Component 2019 & 2032
- Table 42: Global Electric Commercial Vehicle Battery Pack Market Revenue Million Forecast, by Material Type 2019 & 2032
- Table 43: Global Electric Commercial Vehicle Battery Pack Market Revenue Million Forecast, by Country 2019 & 2032
- Table 44: United Kingdom Electric Commercial Vehicle Battery Pack Market Revenue (Million) Forecast, by Application 2019 & 2032
- Table 45: Germany Electric Commercial Vehicle Battery Pack Market Revenue (Million) Forecast, by Application 2019 & 2032
- Table 46: France Electric Commercial Vehicle Battery Pack Market Revenue (Million) Forecast, by Application 2019 & 2032
- Table 47: Italy Electric Commercial Vehicle Battery Pack Market Revenue (Million) Forecast, by Application 2019 & 2032
- Table 48: Spain Electric Commercial Vehicle Battery Pack Market Revenue (Million) Forecast, by Application 2019 & 2032
- Table 49: Russia Electric Commercial Vehicle Battery Pack Market Revenue (Million) Forecast, by Application 2019 & 2032
- Table 50: Benelux Electric Commercial Vehicle Battery Pack Market Revenue (Million) Forecast, by Application 2019 & 2032
- Table 51: Nordics Electric Commercial Vehicle Battery Pack Market Revenue (Million) Forecast, by Application 2019 & 2032
- Table 52: Rest of Europe Electric Commercial Vehicle Battery Pack Market Revenue (Million) Forecast, by Application 2019 & 2032
- Table 53: Global Electric Commercial Vehicle Battery Pack Market Revenue Million Forecast, by Body Type 2019 & 2032
- Table 54: Global Electric Commercial Vehicle Battery Pack Market Revenue Million Forecast, by Propulsion Type 2019 & 2032
- Table 55: Global Electric Commercial Vehicle Battery Pack Market Revenue Million Forecast, by Battery Chemistry 2019 & 2032
- Table 56: Global Electric Commercial Vehicle Battery Pack Market Revenue Million Forecast, by Capacity 2019 & 2032
- Table 57: Global Electric Commercial Vehicle Battery Pack Market Revenue Million Forecast, by Battery Form 2019 & 2032
- Table 58: Global Electric Commercial Vehicle Battery Pack Market Revenue Million Forecast, by Method 2019 & 2032
- Table 59: Global Electric Commercial Vehicle Battery Pack Market Revenue Million Forecast, by Component 2019 & 2032
- Table 60: Global Electric Commercial Vehicle Battery Pack Market Revenue Million Forecast, by Material Type 2019 & 2032
- Table 61: Global Electric Commercial Vehicle Battery Pack Market Revenue Million Forecast, by Country 2019 & 2032
- Table 62: Turkey Electric Commercial Vehicle Battery Pack Market Revenue (Million) Forecast, by Application 2019 & 2032
- Table 63: Israel Electric Commercial Vehicle Battery Pack Market Revenue (Million) Forecast, by Application 2019 & 2032
- Table 64: GCC Electric Commercial Vehicle Battery Pack Market Revenue (Million) Forecast, by Application 2019 & 2032
- Table 65: North Africa Electric Commercial Vehicle Battery Pack Market Revenue (Million) Forecast, by Application 2019 & 2032
- Table 66: South Africa Electric Commercial Vehicle Battery Pack Market Revenue (Million) Forecast, by Application 2019 & 2032
- Table 67: Rest of Middle East & Africa Electric Commercial Vehicle Battery Pack Market Revenue (Million) Forecast, by Application 2019 & 2032
- Table 68: Global Electric Commercial Vehicle Battery Pack Market Revenue Million Forecast, by Body Type 2019 & 2032
- Table 69: Global Electric Commercial Vehicle Battery Pack Market Revenue Million Forecast, by Propulsion Type 2019 & 2032
- Table 70: Global Electric Commercial Vehicle Battery Pack Market Revenue Million Forecast, by Battery Chemistry 2019 & 2032
- Table 71: Global Electric Commercial Vehicle Battery Pack Market Revenue Million Forecast, by Capacity 2019 & 2032
- Table 72: Global Electric Commercial Vehicle Battery Pack Market Revenue Million Forecast, by Battery Form 2019 & 2032
- Table 73: Global Electric Commercial Vehicle Battery Pack Market Revenue Million Forecast, by Method 2019 & 2032
- Table 74: Global Electric Commercial Vehicle Battery Pack Market Revenue Million Forecast, by Component 2019 & 2032
- Table 75: Global Electric Commercial Vehicle Battery Pack Market Revenue Million Forecast, by Material Type 2019 & 2032
- Table 76: Global Electric Commercial Vehicle Battery Pack Market Revenue Million Forecast, by Country 2019 & 2032
- Table 77: China Electric Commercial Vehicle Battery Pack Market Revenue (Million) Forecast, by Application 2019 & 2032
- Table 78: India Electric Commercial Vehicle Battery Pack Market Revenue (Million) Forecast, by Application 2019 & 2032
- Table 79: Japan Electric Commercial Vehicle Battery Pack Market Revenue (Million) Forecast, by Application 2019 & 2032
- Table 80: South Korea Electric Commercial Vehicle Battery Pack Market Revenue (Million) Forecast, by Application 2019 & 2032
- Table 81: ASEAN Electric Commercial Vehicle Battery Pack Market Revenue (Million) Forecast, by Application 2019 & 2032
- Table 82: Oceania Electric Commercial Vehicle Battery Pack Market Revenue (Million) Forecast, by Application 2019 & 2032
- Table 83: Rest of Asia Pacific Electric Commercial Vehicle Battery Pack Market Revenue (Million) Forecast, by Application 2019 & 2032
Frequently Asked Questions
1. What is the projected Compound Annual Growth Rate (CAGR) of the Electric Commercial Vehicle Battery Pack Market?
The projected CAGR is approximately 4.90%.
2. Which companies are prominent players in the Electric Commercial Vehicle Battery Pack Market?
Key companies in the market include Tianjin Lishen Battery Joint-Stock Co Ltd (Lishen Battery, Tata Autocomp Systems Ltd, China Aviation Battery Co Ltd (CALB), Samsung SDI Co Ltd, LG Energy Solution Ltd, A123 Systems LLC, Guoxuan High-tech Co Ltd, Farasis Energy (Ganzhou) Co Ltd, Contemporary Amperex Technology Co Ltd (CATL), BYD Company Ltd, Sunwoda Electric Vehicle Battery Co Ltd (Sunwoda), SK Innovation Co Ltd, EVE Energy Co Ltd, Panasonic Holdings Corporation.
3. What are the main segments of the Electric Commercial Vehicle Battery Pack Market?
The market segments include Body Type, Propulsion Type, Battery Chemistry, Capacity, Battery Form, Method, Component, Material Type.
4. Can you provide details about the market size?
The market size is estimated to be USD XX Million as of 2022.
5. What are some drivers contributing to market growth?
The Rise of Trade Agreements Between Nations; Increasing Volume of International Trade.
6. What are the notable trends driving market growth?
OTHER KEY INDUSTRY TRENDS COVERED IN THE REPORT.
7. Are there any restraints impacting market growth?
Surge in Fuel Costs Affecting the Market.
8. Can you provide examples of recent developments in the market?
February 2023: LG Energy Solution will invest 10 trillion won this year, up 50 percent from 6.3 trillion won a year ago, and expand its global production capacity by 50 percent to 300 gigawatt hours (GWh).February 2023: LG Energy Solution is unlocking more sustainable battery value chain with the world's first battery passport.February 2023: LG Energy Solution and Freudenberg e-Power Systems have signed a multi-year contract for the supply of lithium-ion battery cell modules with a total capacity of 19 GWh.
9. What pricing options are available for accessing the report?
Pricing options include single-user, multi-user, and enterprise licenses priced at USD 3800, USD 4500, and USD 5800 respectively.
10. Is the market size provided in terms of value or volume?
The market size is provided in terms of value, measured in Million.
11. Are there any specific market keywords associated with the report?
Yes, the market keyword associated with the report is "Electric Commercial Vehicle Battery Pack Market," which aids in identifying and referencing the specific market segment covered.
12. How do I determine which pricing option suits my needs best?
The pricing options vary based on user requirements and access needs. Individual users may opt for single-user licenses, while businesses requiring broader access may choose multi-user or enterprise licenses for cost-effective access to the report.
13. Are there any additional resources or data provided in the Electric Commercial Vehicle Battery Pack Market report?
While the report offers comprehensive insights, it's advisable to review the specific contents or supplementary materials provided to ascertain if additional resources or data are available.
14. How can I stay updated on further developments or reports in the Electric Commercial Vehicle Battery Pack Market?
To stay informed about further developments, trends, and reports in the Electric Commercial Vehicle Battery Pack Market, consider subscribing to industry newsletters, following relevant companies and organizations, or regularly checking reputable industry news sources and publications.
Methodology
Step 1 - Identification of Relevant Samples Size from Population Database


Step 2 - Approaches for Defining Global Market Size (Value, Volume* & Price*)

Note*: In applicable scenarios
Step 3 - Data Sources
Primary Research
- Web Analytics
- Survey Reports
- Research Institute
- Latest Research Reports
- Opinion Leaders
Secondary Research
- Annual Reports
- White Paper
- Latest Press Release
- Industry Association
- Paid Database
- Investor Presentations

Step 4 - Data Triangulation
Involves using different sources of information in order to increase the validity of a study
These sources are likely to be stakeholders in a program - participants, other researchers, program staff, other community members, and so on.
Then we put all data in single framework & apply various statistical tools to find out the dynamic on the market.
During the analysis stage, feedback from the stakeholder groups would be compared to determine areas of agreement as well as areas of divergence
