


Key Insights
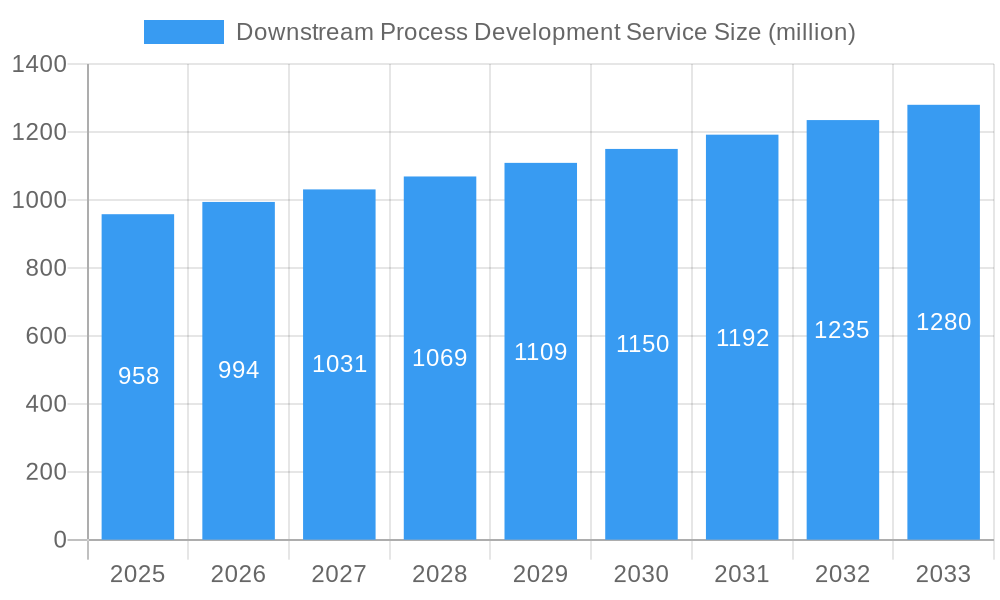
The global Downstream Process Development Service market is poised for substantial growth, projected to reach approximately $958 million in 2025 with a Compound Annual Growth Rate (CAGR) of 3.8% through 2033. This expansion is primarily fueled by the escalating demand for advanced biopharmaceuticals, including antibody drugs and recombinant proteins, which necessitate sophisticated purification and separation processes. The increasing complexity of these biological molecules, coupled with stringent regulatory requirements for product purity and efficacy, drives significant investment in specialized downstream processing expertise. Furthermore, the growing pipeline of biologics in clinical development globally is creating a sustained need for robust and scalable downstream solutions. Companies are increasingly outsourcing these critical development stages to specialized service providers who offer expertise, state-of-the-art technology, and a streamlined approach to navigate the intricate challenges of bioprocessing. This trend is further amplified by the continuous innovation in purification technologies, such as chromatography and filtration, which are essential for achieving high yields and the desired quality attributes of therapeutic proteins.
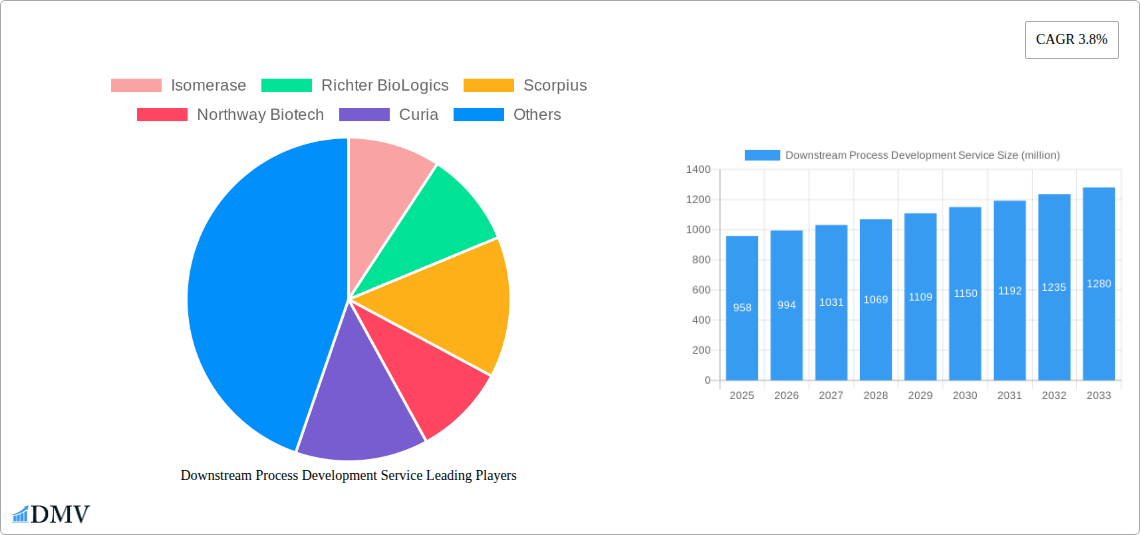
Downstream Process Development Service Market Size (In Million)

The market's trajectory is further shaped by key trends such as the adoption of single-use technologies, continuous manufacturing processes, and advanced analytics for process monitoring and control. These advancements aim to improve efficiency, reduce costs, and accelerate the time-to-market for biologics. However, the market also faces certain restraints, including the high cost of advanced downstream processing equipment and the shortage of skilled personnel with specialized expertise in bioprocess development. Despite these challenges, strategic collaborations, mergers, and acquisitions among market players are anticipated to foster innovation and market consolidation. Geographically, North America and Europe are expected to lead the market, owing to the presence of a well-established biopharmaceutical industry, significant R&D investments, and supportive regulatory frameworks. The Asia Pacific region, particularly China and India, is also emerging as a significant growth hub, driven by increasing investments in biomanufacturing capabilities and a growing domestic demand for biopharmaceuticals.
Downstream Process Development Service Company Market Share
Here's an SEO-optimized and insightful report description for Downstream Process Development Service, crafted without placeholders and ready for immediate use.
Downstream Process Development Service Market Composition & Trends
The global Downstream Process Development Service market is a dynamic and rapidly evolving landscape, characterized by robust innovation and a steady influx of investment. Market concentration is moderate, with a blend of established Contract Development and Manufacturing Organizations (CDMOs) and specialized service providers. Key innovation catalysts include the increasing complexity of biologics, the demand for personalized medicine, and advancements in chromatography, filtration, and single-use technologies. Regulatory landscapes, particularly stringent FDA and EMA guidelines, significantly shape market entry and operational strategies, driving the need for high-quality, validated processes.
- Market Share Distribution: The market share is fragmented, with leading players like Curia, Rentschler Biopharma, and Northway Biotech holding significant, though not dominant, positions. smaller, agile players are carving out niches, particularly in specialized recombinant protein purification.
- M&A Activities: Mergers and acquisitions are a significant trend, with deal values often in the tens to hundreds of millions. For instance, a notable acquisition in the historical period involved a major CDMO acquiring a specialized purification technology firm for an estimated value of $150 million, aiming to expand its service portfolio.
- Substitute Products: While direct substitutes for comprehensive downstream process development are limited, the advancement of in-vitro diagnostic technologies and cell-free protein synthesis systems can influence the demand for certain types of downstream processing for novel therapeutics.
- End-User Profiles: Key end-users include biopharmaceutical companies developing antibody drugs and recombinant proteins, as well as academic research institutions requiring highly purified biologics for preclinical and clinical studies.
- Regulatory Landscapes: Adherence to Good Manufacturing Practices (GMP) and rigorous validation protocols are paramount. Emerging regulations around biosimil development also present both opportunities and challenges, demanding precise and reproducible downstream processes.
Downstream Process Development Service Industry Evolution
The downstream process development service industry has witnessed remarkable growth and transformation driven by the burgeoning biopharmaceutical sector and the escalating demand for sophisticated therapeutic modalities. Over the study period (2019–2033), the market has expanded significantly, with the base year (2025) serving as a crucial benchmark for current industry standing. Historical data from 2019–2024 indicates a compound annual growth rate (CAGR) of approximately 12.5%, fueled by increasing investments in biologics and the outsourcing trend among pharmaceutical companies. This growth trajectory is projected to continue, with forecasts indicating a CAGR of 13.2% during the forecast period (2025–2033).
Technological advancements have been pivotal in shaping this evolution. Innovations in chromatography resins, membrane filtration technologies (such as tangential flow filtration – TFF), and single-use systems have drastically improved efficiency, yield, and purity, while also reducing the risk of cross-contamination and shortening development timelines. The development of continuous manufacturing processes for biologics is also gaining traction, necessitating corresponding advancements in downstream processing. Shifting consumer demands, particularly the preference for more targeted and potent therapies like antibody-drug conjugates (ADCs) and bispecific antibodies, has further spurred the need for highly specialized and robust downstream development services. These complex molecules often require tailored purification strategies to ensure their efficacy and safety. The increasing prevalence of chronic diseases globally and the subsequent rise in the development of biologic drugs have created a sustained demand for these services. Furthermore, the growing emphasis on cost-effectiveness and faster time-to-market for new therapies has encouraged biopharmaceutical companies to leverage external expertise from specialized downstream process development service providers. The estimated market size in 2025 is projected to be around $8.5 billion, with significant contributions from purification process development services.
Leading Regions, Countries, or Segments in Downstream Process Development Service
North America, led by the United States, currently dominates the global Downstream Process Development Service market. This regional supremacy is attributed to a confluence of factors, including a highly developed biopharmaceutical ecosystem, substantial government and private investment in biotechnology research and development, and the presence of a significant number of leading pharmaceutical and biotechnology companies. The region's robust regulatory framework, while stringent, fosters innovation and demands high standards in process development, aligning perfectly with the services offered by leading CDMOs.
Dominant Region: North America
- Key Drivers:
- High R&D Expenditure: Substantial investments in biopharmaceutical research and development by both established companies and emerging biotech startups.
- Favorable Regulatory Environment: A well-established and predictable regulatory pathway for drug approval by the FDA, encouraging extensive process development.
- Presence of Major Biopharma Hubs: Concentration of major pharmaceutical and biotechnology companies in regions like Boston, San Francisco, and San Diego.
- Outsourcing Trends: A strong culture of outsourcing drug development and manufacturing activities to specialized service providers.
- Technological Advancements: Early adoption and development of cutting-edge downstream processing technologies.
- In-depth Analysis: The United States, in particular, benefits from a high volume of clinical trials and a rapid pace of drug discovery. The presence of key players like Curia, BOC Sciences, and Excellence SA further solidifies its leadership. Investment trends in this region are consistently high, with estimated R&D spending in the biopharmaceutical sector exceeding $90 billion annually. Regulatory support, while demanding, provides a clear roadmap for process validation and commercialization, reducing uncertainty for developers.
- Key Drivers:
Dominant Segment by Application: Antibody Drugs
- Key Drivers:
- Therapeutic Efficacy: Antibody drugs have demonstrated exceptional efficacy in treating a wide range of diseases, driving their continued development.
- Growing Market Demand: The global market for antibody-based therapeutics is projected to reach hundreds of billions of dollars in the coming years.
- Complex Manufacturing Requirements: The intricate nature of monoclonal antibodies necessitates sophisticated and highly controlled downstream processing for optimal purity and yield.
- In-depth Analysis: Antibody drugs, including monoclonal antibodies (mAbs) and antibody-drug conjugates (ADCs), represent the largest and fastest-growing application segment for downstream process development services. The development of these complex biologics requires specialized purification techniques to achieve the necessary purity levels. The estimated market for antibody drugs alone is projected to be in the realm of $150 billion by 2025, significantly driving demand for downstream expertise. Companies like Isomerase and VIVEbiotech are at the forefront of developing novel antibody therapeutics, necessitating advanced downstream solutions.
- Key Drivers:
Dominant Segment by Type: Purification Process Development
- Key Drivers:
- Product Purity Requirements: Ensuring the removal of impurities, host cell proteins, DNA, and endotoxins is critical for drug safety and efficacy.
- Yield Optimization: Maximizing the recovery of the target protein is essential for economic viability.
- Scalability: Developing processes that can be scaled from laboratory bench to commercial manufacturing.
- In-depth Analysis: Purification process development is the cornerstone of downstream processing. It encompasses a series of steps, including chromatography (affinity, ion-exchange, hydrophobic interaction), filtration (tangential flow filtration, sterile filtration), and precipitation, aimed at isolating and purifying the target molecule to stringent quality standards. The estimated investment in purification technologies and services is projected to reach approximately $7 billion in 2025. The demand for highly efficient and scalable purification strategies for antibody drugs and recombinant proteins is a primary growth driver for this segment.
- Key Drivers:
Downstream Process Development Service Product Innovations
Recent product innovations in downstream process development services are revolutionizing biopharmaceutical manufacturing. Advances in continuous chromatography systems, such as simulated moving bed (SMB) chromatography, offer significant improvements in throughput and efficiency, reducing buffer consumption and operational costs, with some systems achieving throughput improvements of up to 30%. The development of novel affinity ligands and chromatography resins with enhanced binding capacities and selectivity is another key innovation, allowing for more efficient capture of target molecules. Furthermore, the integration of single-use technologies, including disposable chromatography columns and filtration modules, is gaining traction, offering flexibility, reduced cleaning validation efforts, and minimized risk of cross-contamination, with an estimated market adoption rate increasing by 15% annually.
Propelling Factors for Downstream Process Development Service Growth
The downstream process development service market is propelled by several key factors. The escalating complexity of biologic drugs, including bispecific antibodies and gene therapies, necessitates highly specialized purification and separation expertise. The global increase in biopharmaceutical R&D expenditure, estimated to exceed $100 billion annually, directly translates into a higher demand for outsourced process development services. Furthermore, the growing trend of biopharmaceutical companies outsourcing non-core activities to specialized CDMOs to reduce capital expenditure and accelerate time-to-market is a significant growth driver. Regulatory bodies' increasing emphasis on product quality and patient safety also mandates robust and well-validated downstream processes, further boosting the demand for expert services.
Obstacles in the Downstream Process Development Service Market
Despite robust growth, the downstream process development service market faces several obstacles. The stringent and evolving regulatory landscape can create challenges, requiring constant adaptation and investment in compliance, with an estimated 5% increase in regulatory submission complexity annually. The high cost of advanced purification technologies and equipment can be a barrier for smaller companies. Supply chain disruptions, particularly for critical raw materials and single-use components, can lead to project delays and increased costs, with some disruptions leading to an average delay of 4-6 weeks. Intense competition among CDMOs can also put pressure on pricing and profit margins, requiring companies to differentiate through specialized expertise and superior service quality.
Future Opportunities in Downstream Process Development Service
Emerging opportunities in the downstream process development service market are abundant. The growing pipeline of cell and gene therapies presents a significant untapped market, requiring novel and highly specialized downstream processing techniques. The development of continuous bioprocessing and integrated downstream platforms offers substantial efficiency gains and cost reductions. Expansion into emerging markets in Asia-Pacific and Latin America, driven by growing biopharmaceutical investments, presents new avenues for growth. Furthermore, the increasing demand for biosimil development, requiring robust and cost-effective purification strategies, opens up considerable market potential.
Major Players in the Downstream Process Development Service Ecosystem
- Isomerase
- Richter BioLogics
- Scorpius
- Northway Biotech
- Curia
- Excellence SA
- FyoniBio
- BOC Sciences
- Bioentia
- Rentschler Biopharma
- VIVEbiotech
- Kemp Proteins
Key Developments in Downstream Process Development Service Industry
- January 2023: Curia announced the expansion of its biologics development and manufacturing capabilities with a new facility, significantly increasing its downstream processing capacity.
- October 2022: Northway Biotech unveiled a new proprietary platform for recombinant protein purification, promising higher yields and reduced costs.
- June 2022: Rentschler Biopharma reported successful development of a scalable downstream process for a complex bispecific antibody, demonstrating advanced capabilities.
- March 2022: Excellenc SA entered into a strategic partnership with a leading biopharma company to provide comprehensive downstream process development for a novel antibody drug.
- December 2021: BOC Sciences launched a new suite of advanced chromatography resins designed for high-resolution purification of therapeutic proteins.
Strategic Downstream Process Development Service Market Forecast
The strategic forecast for the Downstream Process Development Service market indicates continued robust growth driven by innovation and market demand. Key growth catalysts include the expanding pipeline of complex biologics, particularly antibody drugs and recombinant proteins, necessitating sophisticated purification and separation strategies. The ongoing trend of outsourcing by biopharmaceutical companies, aiming to streamline development and reduce costs, will further fuel market expansion. Investments in advanced technologies like continuous bioprocessing and single-use systems are expected to drive efficiency and capacity. The increasing focus on biosimilar development also presents a significant opportunity, requiring cost-effective and reproducible downstream solutions. The market is poised for substantial growth, with an estimated market size of over $15 billion by 2033.
Downstream Process Development Service Segmentation
-
1. Application
- 1.1. Antibody Drugs
- 1.2. Recombinant Proteins
- 1.3. Others
-
2. Type
- 2.1. Purification Process Development
- 2.2. Separation Process Development
- 2.3. Others
Downstream Process Development Service Segmentation By Geography
-
1. North America
- 1.1. United States
- 1.2. Canada
- 1.3. Mexico
-
2. South America
- 2.1. Brazil
- 2.2. Argentina
- 2.3. Rest of South America
-
3. Europe
- 3.1. United Kingdom
- 3.2. Germany
- 3.3. France
- 3.4. Italy
- 3.5. Spain
- 3.6. Russia
- 3.7. Benelux
- 3.8. Nordics
- 3.9. Rest of Europe
-
4. Middle East & Africa
- 4.1. Turkey
- 4.2. Israel
- 4.3. GCC
- 4.4. North Africa
- 4.5. South Africa
- 4.6. Rest of Middle East & Africa
-
5. Asia Pacific
- 5.1. China
- 5.2. India
- 5.3. Japan
- 5.4. South Korea
- 5.5. ASEAN
- 5.6. Oceania
- 5.7. Rest of Asia Pacific
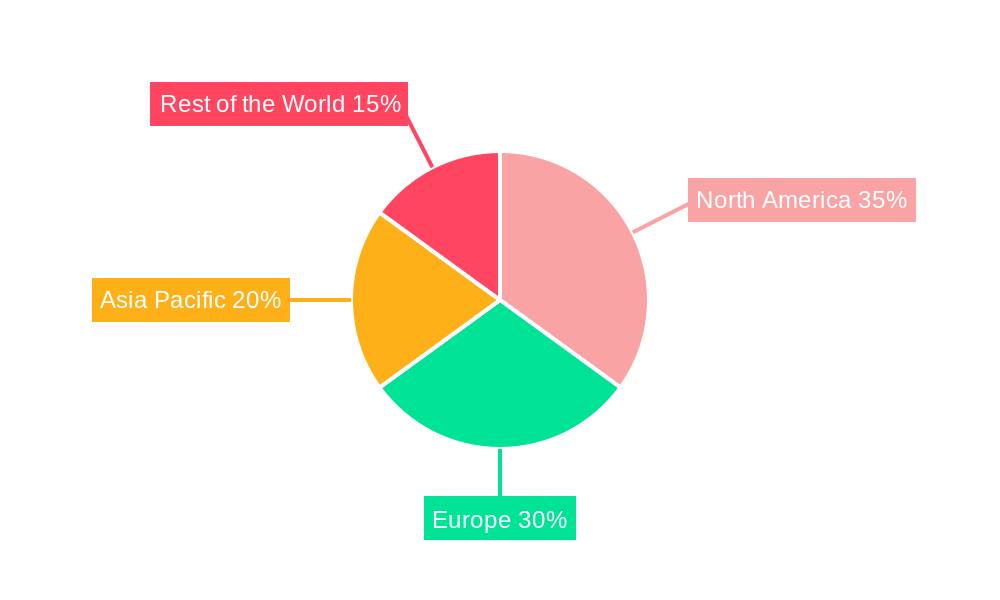
Downstream Process Development Service Regional Market Share
Geographic Coverage of Downstream Process Development Service
Downstream Process Development Service REPORT HIGHLIGHTS
| Aspects | Details |
|---|---|
| Study Period | 2020-2034 |
| Base Year | 2025 |
| Estimated Year | 2026 |
| Forecast Period | 2026-2034 |
| Historical Period | 2020-2025 |
| Growth Rate | CAGR of 3.8% from 2020-2034 |
| Segmentation |
|
Table of Contents
- 1. Introduction
- 1.1. Research Scope
- 1.2. Market Segmentation
- 1.3. Research Objective
- 1.4. Definitions and Assumptions
- 2. Executive Summary
- 2.1. Market Snapshot
- 3. Market Dynamics
- 3.1. Market Drivers
- 3.2. Market Restrains
- 3.3. Market Trends
- 3.4. Market Opportunities
- 4. Market Factor Analysis
- 4.1. Porters Five Forces
- 4.1.1. Bargaining Power of Suppliers
- 4.1.2. Bargaining Power of Buyers
- 4.1.3. Threat of New Entrants
- 4.1.4. Threat of Substitutes
- 4.1.5. Competitive Rivalry
- 4.2. PESTEL analysis
- 4.3. BCG Analysis
- 4.3.1. Stars (High Growth, High Market Share)
- 4.3.2. Cash Cows (Low Growth, High Market Share)
- 4.3.3. Question Mark (High Growth, Low Market Share)
- 4.3.4. Dogs (Low Growth, Low Market Share)
- 4.4. Ansoff Matrix Analysis
- 4.5. Supply Chain Analysis
- 4.6. Regulatory Landscape
- 4.7. Current Market Potential and Opportunity Assessment (TAM–SAM–SOM Framework)
- 4.8. DMV Analyst Note
- 4.1. Porters Five Forces
- 5. Market Analysis, Insights and Forecast 2021-2033
- 5.1. Market Analysis, Insights and Forecast - by Application
- 5.1.1. Antibody Drugs
- 5.1.2. Recombinant Proteins
- 5.1.3. Others
- 5.2. Market Analysis, Insights and Forecast - by Type
- 5.2.1. Purification Process Development
- 5.2.2. Separation Process Development
- 5.2.3. Others
- 5.3. Market Analysis, Insights and Forecast - by Region
- 5.3.1. North America
- 5.3.2. South America
- 5.3.3. Europe
- 5.3.4. Middle East & Africa
- 5.3.5. Asia Pacific
- 5.1. Market Analysis, Insights and Forecast - by Application
- 6. Global Downstream Process Development Service Analysis, Insights and Forecast, 2021-2033
- 6.1. Market Analysis, Insights and Forecast - by Application
- 6.1.1. Antibody Drugs
- 6.1.2. Recombinant Proteins
- 6.1.3. Others
- 6.2. Market Analysis, Insights and Forecast - by Type
- 6.2.1. Purification Process Development
- 6.2.2. Separation Process Development
- 6.2.3. Others
- 6.1. Market Analysis, Insights and Forecast - by Application
- 7. North America Downstream Process Development Service Analysis, Insights and Forecast, 2020-2032
- 7.1. Market Analysis, Insights and Forecast - by Application
- 7.1.1. Antibody Drugs
- 7.1.2. Recombinant Proteins
- 7.1.3. Others
- 7.2. Market Analysis, Insights and Forecast - by Type
- 7.2.1. Purification Process Development
- 7.2.2. Separation Process Development
- 7.2.3. Others
- 7.1. Market Analysis, Insights and Forecast - by Application
- 8. South America Downstream Process Development Service Analysis, Insights and Forecast, 2020-2032
- 8.1. Market Analysis, Insights and Forecast - by Application
- 8.1.1. Antibody Drugs
- 8.1.2. Recombinant Proteins
- 8.1.3. Others
- 8.2. Market Analysis, Insights and Forecast - by Type
- 8.2.1. Purification Process Development
- 8.2.2. Separation Process Development
- 8.2.3. Others
- 8.1. Market Analysis, Insights and Forecast - by Application
- 9. Europe Downstream Process Development Service Analysis, Insights and Forecast, 2020-2032
- 9.1. Market Analysis, Insights and Forecast - by Application
- 9.1.1. Antibody Drugs
- 9.1.2. Recombinant Proteins
- 9.1.3. Others
- 9.2. Market Analysis, Insights and Forecast - by Type
- 9.2.1. Purification Process Development
- 9.2.2. Separation Process Development
- 9.2.3. Others
- 9.1. Market Analysis, Insights and Forecast - by Application
- 10. Middle East & Africa Downstream Process Development Service Analysis, Insights and Forecast, 2020-2032
- 10.1. Market Analysis, Insights and Forecast - by Application
- 10.1.1. Antibody Drugs
- 10.1.2. Recombinant Proteins
- 10.1.3. Others
- 10.2. Market Analysis, Insights and Forecast - by Type
- 10.2.1. Purification Process Development
- 10.2.2. Separation Process Development
- 10.2.3. Others
- 10.1. Market Analysis, Insights and Forecast - by Application
- 11. Asia Pacific Downstream Process Development Service Analysis, Insights and Forecast, 2020-2032
- 11.1. Market Analysis, Insights and Forecast - by Application
- 11.1.1. Antibody Drugs
- 11.1.2. Recombinant Proteins
- 11.1.3. Others
- 11.2. Market Analysis, Insights and Forecast - by Type
- 11.2.1. Purification Process Development
- 11.2.2. Separation Process Development
- 11.2.3. Others
- 11.1. Market Analysis, Insights and Forecast - by Application
- 12. Competitive Analysis
- 12.1. Company Profiles
- 12.1.1 Isomerase
- 12.1.1.1. Company Overview
- 12.1.1.2. Products
- 12.1.1.3. Company Financials
- 12.1.1.4. SWOT Analysis
- 12.1.2 Richter BioLogics
- 12.1.2.1. Company Overview
- 12.1.2.2. Products
- 12.1.2.3. Company Financials
- 12.1.2.4. SWOT Analysis
- 12.1.3 Scorpius
- 12.1.3.1. Company Overview
- 12.1.3.2. Products
- 12.1.3.3. Company Financials
- 12.1.3.4. SWOT Analysis
- 12.1.4 Northway Biotech
- 12.1.4.1. Company Overview
- 12.1.4.2. Products
- 12.1.4.3. Company Financials
- 12.1.4.4. SWOT Analysis
- 12.1.5 Curia
- 12.1.5.1. Company Overview
- 12.1.5.2. Products
- 12.1.5.3. Company Financials
- 12.1.5.4. SWOT Analysis
- 12.1.6 ExcellGene SA
- 12.1.6.1. Company Overview
- 12.1.6.2. Products
- 12.1.6.3. Company Financials
- 12.1.6.4. SWOT Analysis
- 12.1.7 FyoniBio
- 12.1.7.1. Company Overview
- 12.1.7.2. Products
- 12.1.7.3. Company Financials
- 12.1.7.4. SWOT Analysis
- 12.1.8 BOC Sciences
- 12.1.8.1. Company Overview
- 12.1.8.2. Products
- 12.1.8.3. Company Financials
- 12.1.8.4. SWOT Analysis
- 12.1.9 Bioentia
- 12.1.9.1. Company Overview
- 12.1.9.2. Products
- 12.1.9.3. Company Financials
- 12.1.9.4. SWOT Analysis
- 12.1.10 Rentschler Biopharma
- 12.1.10.1. Company Overview
- 12.1.10.2. Products
- 12.1.10.3. Company Financials
- 12.1.10.4. SWOT Analysis
- 12.1.11 VIVEbiotech
- 12.1.11.1. Company Overview
- 12.1.11.2. Products
- 12.1.11.3. Company Financials
- 12.1.11.4. SWOT Analysis
- 12.1.12 Kemp Proteins
- 12.1.12.1. Company Overview
- 12.1.12.2. Products
- 12.1.12.3. Company Financials
- 12.1.12.4. SWOT Analysis
- 12.1.1 Isomerase
- 12.2. Market Entropy
- 12.2.1 Company's Key Areas Served
- 12.2.2 Recent Developments
- 12.3. Company Market Share Analysis 2025
- 12.3.1 Top 5 Companies Market Share Analysis
- 12.3.2 Top 3 Companies Market Share Analysis
- 12.4. List of Potential Customers
- 13. Research Methodology
List of Figures
- Figure 1: Global Downstream Process Development Service Revenue Breakdown (million, %) by Region 2025 & 2033
- Figure 2: North America Downstream Process Development Service Revenue (million), by Application 2025 & 2033
- Figure 3: North America Downstream Process Development Service Revenue Share (%), by Application 2025 & 2033
- Figure 4: North America Downstream Process Development Service Revenue (million), by Type 2025 & 2033
- Figure 5: North America Downstream Process Development Service Revenue Share (%), by Type 2025 & 2033
- Figure 6: North America Downstream Process Development Service Revenue (million), by Country 2025 & 2033
- Figure 7: North America Downstream Process Development Service Revenue Share (%), by Country 2025 & 2033
- Figure 8: South America Downstream Process Development Service Revenue (million), by Application 2025 & 2033
- Figure 9: South America Downstream Process Development Service Revenue Share (%), by Application 2025 & 2033
- Figure 10: South America Downstream Process Development Service Revenue (million), by Type 2025 & 2033
- Figure 11: South America Downstream Process Development Service Revenue Share (%), by Type 2025 & 2033
- Figure 12: South America Downstream Process Development Service Revenue (million), by Country 2025 & 2033
- Figure 13: South America Downstream Process Development Service Revenue Share (%), by Country 2025 & 2033
- Figure 14: Europe Downstream Process Development Service Revenue (million), by Application 2025 & 2033
- Figure 15: Europe Downstream Process Development Service Revenue Share (%), by Application 2025 & 2033
- Figure 16: Europe Downstream Process Development Service Revenue (million), by Type 2025 & 2033
- Figure 17: Europe Downstream Process Development Service Revenue Share (%), by Type 2025 & 2033
- Figure 18: Europe Downstream Process Development Service Revenue (million), by Country 2025 & 2033
- Figure 19: Europe Downstream Process Development Service Revenue Share (%), by Country 2025 & 2033
- Figure 20: Middle East & Africa Downstream Process Development Service Revenue (million), by Application 2025 & 2033
- Figure 21: Middle East & Africa Downstream Process Development Service Revenue Share (%), by Application 2025 & 2033
- Figure 22: Middle East & Africa Downstream Process Development Service Revenue (million), by Type 2025 & 2033
- Figure 23: Middle East & Africa Downstream Process Development Service Revenue Share (%), by Type 2025 & 2033
- Figure 24: Middle East & Africa Downstream Process Development Service Revenue (million), by Country 2025 & 2033
- Figure 25: Middle East & Africa Downstream Process Development Service Revenue Share (%), by Country 2025 & 2033
- Figure 26: Asia Pacific Downstream Process Development Service Revenue (million), by Application 2025 & 2033
- Figure 27: Asia Pacific Downstream Process Development Service Revenue Share (%), by Application 2025 & 2033
- Figure 28: Asia Pacific Downstream Process Development Service Revenue (million), by Type 2025 & 2033
- Figure 29: Asia Pacific Downstream Process Development Service Revenue Share (%), by Type 2025 & 2033
- Figure 30: Asia Pacific Downstream Process Development Service Revenue (million), by Country 2025 & 2033
- Figure 31: Asia Pacific Downstream Process Development Service Revenue Share (%), by Country 2025 & 2033
List of Tables
- Table 1: Global Downstream Process Development Service Revenue million Forecast, by Application 2020 & 2033
- Table 2: Global Downstream Process Development Service Revenue million Forecast, by Type 2020 & 2033
- Table 3: Global Downstream Process Development Service Revenue million Forecast, by Region 2020 & 2033
- Table 4: Global Downstream Process Development Service Revenue million Forecast, by Application 2020 & 2033
- Table 5: Global Downstream Process Development Service Revenue million Forecast, by Type 2020 & 2033
- Table 6: Global Downstream Process Development Service Revenue million Forecast, by Country 2020 & 2033
- Table 7: United States Downstream Process Development Service Revenue (million) Forecast, by Application 2020 & 2033
- Table 8: Canada Downstream Process Development Service Revenue (million) Forecast, by Application 2020 & 2033
- Table 9: Mexico Downstream Process Development Service Revenue (million) Forecast, by Application 2020 & 2033
- Table 10: Global Downstream Process Development Service Revenue million Forecast, by Application 2020 & 2033
- Table 11: Global Downstream Process Development Service Revenue million Forecast, by Type 2020 & 2033
- Table 12: Global Downstream Process Development Service Revenue million Forecast, by Country 2020 & 2033
- Table 13: Brazil Downstream Process Development Service Revenue (million) Forecast, by Application 2020 & 2033
- Table 14: Argentina Downstream Process Development Service Revenue (million) Forecast, by Application 2020 & 2033
- Table 15: Rest of South America Downstream Process Development Service Revenue (million) Forecast, by Application 2020 & 2033
- Table 16: Global Downstream Process Development Service Revenue million Forecast, by Application 2020 & 2033
- Table 17: Global Downstream Process Development Service Revenue million Forecast, by Type 2020 & 2033
- Table 18: Global Downstream Process Development Service Revenue million Forecast, by Country 2020 & 2033
- Table 19: United Kingdom Downstream Process Development Service Revenue (million) Forecast, by Application 2020 & 2033
- Table 20: Germany Downstream Process Development Service Revenue (million) Forecast, by Application 2020 & 2033
- Table 21: France Downstream Process Development Service Revenue (million) Forecast, by Application 2020 & 2033
- Table 22: Italy Downstream Process Development Service Revenue (million) Forecast, by Application 2020 & 2033
- Table 23: Spain Downstream Process Development Service Revenue (million) Forecast, by Application 2020 & 2033
- Table 24: Russia Downstream Process Development Service Revenue (million) Forecast, by Application 2020 & 2033
- Table 25: Benelux Downstream Process Development Service Revenue (million) Forecast, by Application 2020 & 2033
- Table 26: Nordics Downstream Process Development Service Revenue (million) Forecast, by Application 2020 & 2033
- Table 27: Rest of Europe Downstream Process Development Service Revenue (million) Forecast, by Application 2020 & 2033
- Table 28: Global Downstream Process Development Service Revenue million Forecast, by Application 2020 & 2033
- Table 29: Global Downstream Process Development Service Revenue million Forecast, by Type 2020 & 2033
- Table 30: Global Downstream Process Development Service Revenue million Forecast, by Country 2020 & 2033
- Table 31: Turkey Downstream Process Development Service Revenue (million) Forecast, by Application 2020 & 2033
- Table 32: Israel Downstream Process Development Service Revenue (million) Forecast, by Application 2020 & 2033
- Table 33: GCC Downstream Process Development Service Revenue (million) Forecast, by Application 2020 & 2033
- Table 34: North Africa Downstream Process Development Service Revenue (million) Forecast, by Application 2020 & 2033
- Table 35: South Africa Downstream Process Development Service Revenue (million) Forecast, by Application 2020 & 2033
- Table 36: Rest of Middle East & Africa Downstream Process Development Service Revenue (million) Forecast, by Application 2020 & 2033
- Table 37: Global Downstream Process Development Service Revenue million Forecast, by Application 2020 & 2033
- Table 38: Global Downstream Process Development Service Revenue million Forecast, by Type 2020 & 2033
- Table 39: Global Downstream Process Development Service Revenue million Forecast, by Country 2020 & 2033
- Table 40: China Downstream Process Development Service Revenue (million) Forecast, by Application 2020 & 2033
- Table 41: India Downstream Process Development Service Revenue (million) Forecast, by Application 2020 & 2033
- Table 42: Japan Downstream Process Development Service Revenue (million) Forecast, by Application 2020 & 2033
- Table 43: South Korea Downstream Process Development Service Revenue (million) Forecast, by Application 2020 & 2033
- Table 44: ASEAN Downstream Process Development Service Revenue (million) Forecast, by Application 2020 & 2033
- Table 45: Oceania Downstream Process Development Service Revenue (million) Forecast, by Application 2020 & 2033
- Table 46: Rest of Asia Pacific Downstream Process Development Service Revenue (million) Forecast, by Application 2020 & 2033
Frequently Asked Questions
1. What is the projected Compound Annual Growth Rate (CAGR) of the Downstream Process Development Service?
The projected CAGR is approximately 3.8%.
2. Which companies are prominent players in the Downstream Process Development Service?
Key companies in the market include Isomerase, Richter BioLogics, Scorpius, Northway Biotech, Curia, ExcellGene SA, FyoniBio, BOC Sciences, Bioentia, Rentschler Biopharma, VIVEbiotech, Kemp Proteins.
3. What are the main segments of the Downstream Process Development Service?
The market segments include Application, Type.
4. Can you provide details about the market size?
The market size is estimated to be USD 958 million as of 2022.
5. What are some drivers contributing to market growth?
N/A
6. What are the notable trends driving market growth?
N/A
7. Are there any restraints impacting market growth?
N/A
8. Can you provide examples of recent developments in the market?
N/A
9. What pricing options are available for accessing the report?
Pricing options include single-user, multi-user, and enterprise licenses priced at USD 4250.00, USD 6375.00, and USD 8500.00 respectively.
10. Is the market size provided in terms of value or volume?
The market size is provided in terms of value, measured in million.
11. Are there any specific market keywords associated with the report?
Yes, the market keyword associated with the report is "Downstream Process Development Service," which aids in identifying and referencing the specific market segment covered.
12. How do I determine which pricing option suits my needs best?
The pricing options vary based on user requirements and access needs. Individual users may opt for single-user licenses, while businesses requiring broader access may choose multi-user or enterprise licenses for cost-effective access to the report.
13. Are there any additional resources or data provided in the Downstream Process Development Service report?
While the report offers comprehensive insights, it's advisable to review the specific contents or supplementary materials provided to ascertain if additional resources or data are available.
14. How can I stay updated on further developments or reports in the Downstream Process Development Service?
To stay informed about further developments, trends, and reports in the Downstream Process Development Service, consider subscribing to industry newsletters, following relevant companies and organizations, or regularly checking reputable industry news sources and publications.
Methodology
Step 1 - Identification of Relevant Samples Size from Population Database



Step 2 - Approaches for Defining Global Market Size (Value, Volume* & Price*)

Note*: In applicable scenarios
Step 3 - Data Sources
Primary Research
- Web Analytics
- Survey Reports
- Research Institute
- Latest Research Reports
- Opinion Leaders
Secondary Research
- Annual Reports
- White Paper
- Latest Press Release
- Industry Association
- Paid Database
- Investor Presentations

Step 4 - Data Triangulation
Involves using different sources of information in order to increase the validity of a study
These sources are likely to be stakeholders in a program - participants, other researchers, program staff, other community members, and so on.
Then we put all data in single framework & apply various statistical tools to find out the dynamic on the market.
During the analysis stage, feedback from the stakeholder groups would be compared to determine areas of agreement as well as areas of divergence