

Key Insights
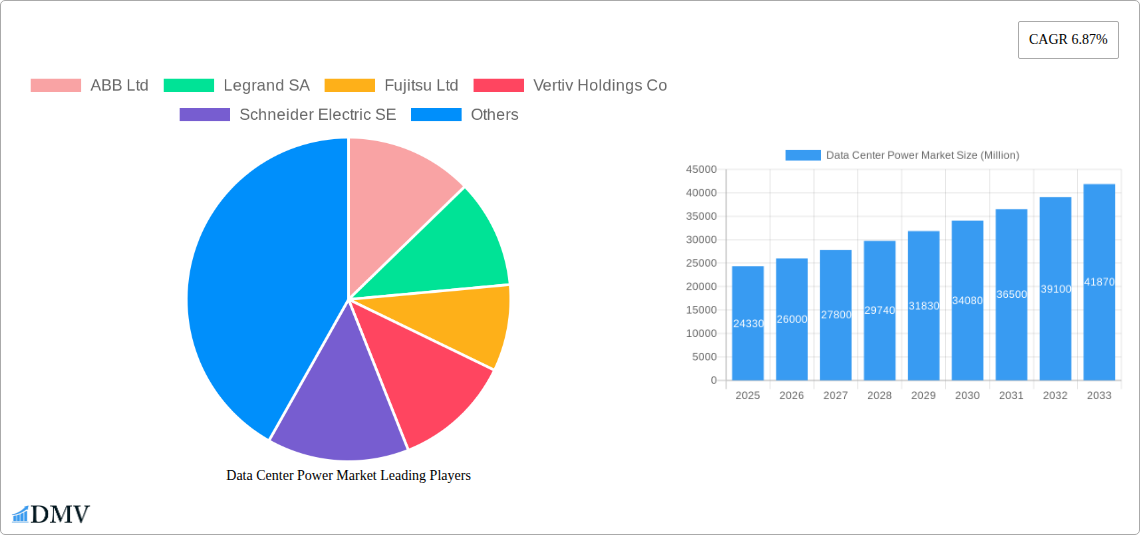
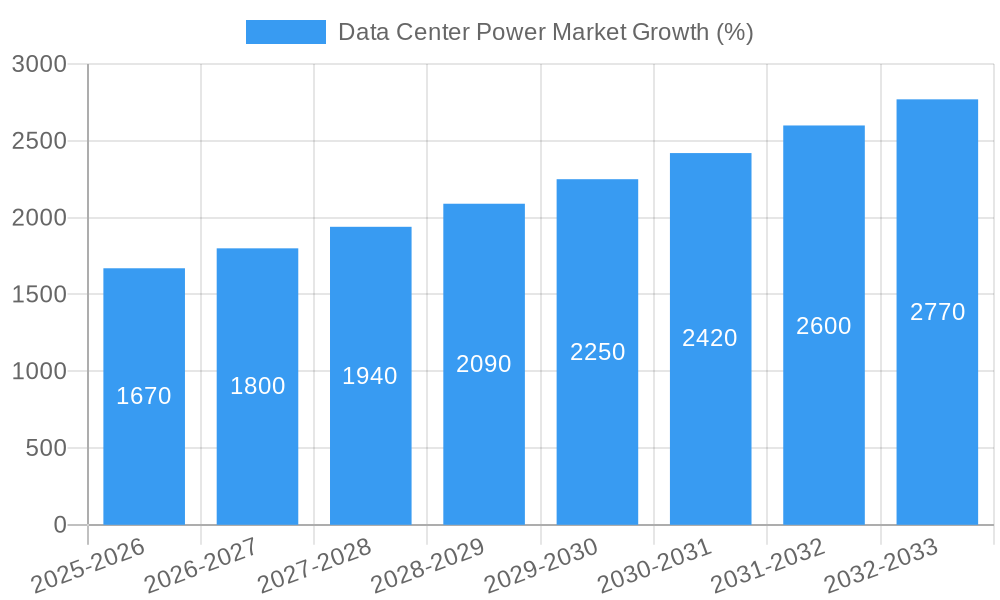
The Data Center Power market, valued at $24.33 billion in 2025, is experiencing robust growth, projected to expand at a Compound Annual Growth Rate (CAGR) of 6.87% from 2025 to 2033. This growth is fueled by several key factors. The increasing adoption of cloud computing and big data analytics necessitates higher power capacity within data centers, driving demand for efficient and reliable power solutions. Furthermore, the rising proliferation of edge computing, requiring distributed power infrastructure, significantly contributes to market expansion. The market is segmented by type (solutions and services), end-user application (information technology, manufacturing, BFSI, government, telecom, and others), and data center size (small and medium, and large). Competition is intense, with major players like ABB, Schneider Electric, and Vertiv vying for market share through technological innovation and strategic partnerships. Growth is expected to be particularly strong in the Asia-Pacific region, driven by rapid digital transformation and increasing infrastructure investments. The continued emphasis on sustainability and energy efficiency within data centers will shape future market developments, favoring solutions with reduced carbon footprint and improved energy management capabilities.
The restraints on market growth primarily involve the high initial investment costs associated with implementing advanced power solutions and the complexity of integrating these solutions into existing data center infrastructure. However, these challenges are being mitigated by the availability of financing options and the increasing expertise of system integrators. The market’s future trajectory will be significantly influenced by technological advancements, such as the development of more efficient power conversion technologies and the integration of renewable energy sources into data center power systems. Government regulations promoting energy efficiency and sustainable practices are also expected to further stimulate growth within the market. The ongoing evolution of data center design and architecture will necessitate ongoing innovation in power solutions, leading to a dynamic and competitive landscape throughout the forecast period.
Data Center Power Market: A Comprehensive Report (2019-2033)
This insightful report provides a detailed analysis of the Data Center Power Market, offering a comprehensive overview of market trends, leading players, technological advancements, and future growth prospects. With a study period spanning 2019-2033, a base year of 2025, and a forecast period of 2025-2033, this report is an essential resource for stakeholders seeking to understand and capitalize on opportunities within this dynamic market. The market is projected to reach xx Million by 2033.
Data Center Power Market Market Composition & Trends
The Data Center Power Market is experiencing robust growth driven by the exponential increase in data consumption and the expansion of cloud computing. Market concentration is moderate, with several key players holding significant market share, but a fragmented landscape also exists, particularly in niche segments. Innovation is a key catalyst, with continuous advancements in power distribution units (PDUs), uninterruptible power supplies (UPS), and cooling systems. Regulatory landscapes vary across geographies, influencing investment decisions and market access. Substitute products, such as alternative energy sources for data centers, are emerging but haven't yet significantly impacted the dominant technologies. End-user profiles are diverse, encompassing IT, manufacturing, BFSI (Banking, Financial Services, and Insurance), government, telecom, and other sectors. M&A activity is notable, with deal values exceeding xx Million in recent years, indicating consolidation and expansion strategies among leading players.
- Market Share Distribution (2024 Estimate): Schneider Electric SE (20%), Vertiv Holdings Co (15%), ABB Ltd (12%), Eaton Corporation (10%), Others (43%).
- M&A Deal Values (2019-2024): Total value exceeding xx Million.
Data Center Power Market Industry Evolution
The Data Center Power Market has witnessed a remarkable evolution, transitioning from traditional power solutions to highly efficient and intelligent systems. From 2019 to 2024, the market registered a Compound Annual Growth Rate (CAGR) of xx%, driven by factors such as the proliferation of edge data centers and the rising adoption of virtualization and cloud technologies. Technological advancements, such as the integration of AI and IoT in power management systems, have enhanced efficiency and reliability. Consumer demands are shifting towards sustainable and environmentally friendly solutions, pushing innovation in areas like renewable energy integration and energy-efficient cooling technologies. The market is expected to maintain a robust growth trajectory in the forecast period (2025-2033), with a projected CAGR of xx%, fueled by the continued growth of digitalization and the rising adoption of advanced data center technologies.
Leading Regions, Countries, or Segments in Data Center Power Market
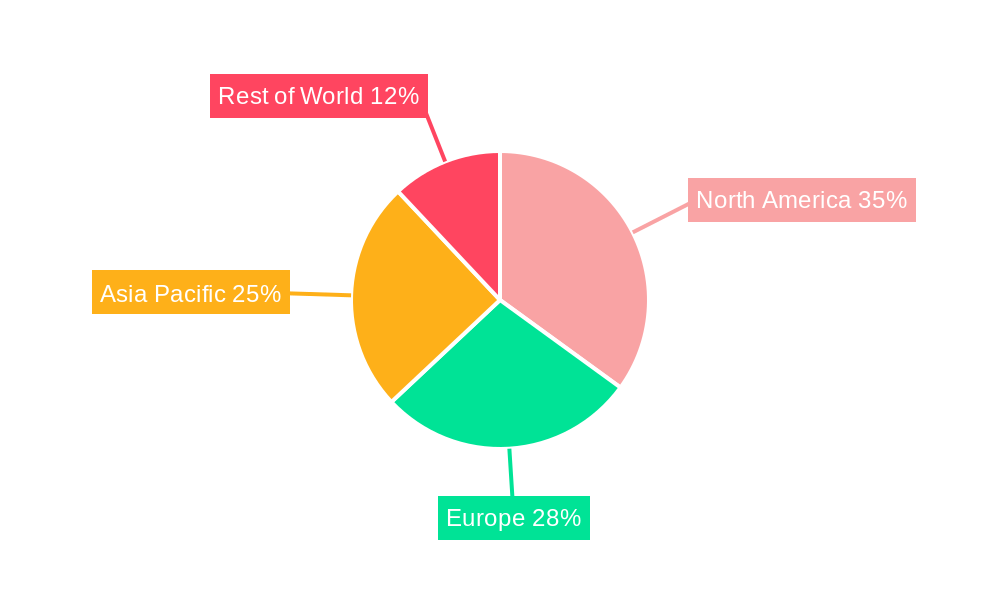
The North American region currently holds the largest market share, driven by substantial investments in data center infrastructure and a strong presence of key players. Within segments, the "Solutions" segment (including PDUs, UPS, and cooling systems) dominates, followed by "Services" which includes maintenance and support. In end-user applications, the Information Technology sector leads, followed by BFSI and Manufacturing. Large data centers represent a significant portion of the market due to their high power demands.
- Key Drivers for North America: High capital expenditure in data center infrastructure, robust IT sector growth, and supportive government policies.
- Key Drivers for Information Technology Segment: Growing cloud computing adoption, increasing data storage needs, and the expansion of hyperscale data centers.
- Key Drivers for Large Data Centers Segment: High power demands, economies of scale, and need for advanced power management solutions.
Data Center Power Market Product Innovations
Recent innovations focus on enhancing efficiency, reliability, and scalability. Modular data centers, like Vertiv SmartMod Max CW, offer flexible solutions for varying needs, while advancements in PDUs, such as ABB TruFit, prioritize adaptability and safety. These innovations are characterized by improved power density, intelligent control systems, and remote monitoring capabilities, optimizing performance and reducing operational costs.
Propelling Factors for Data Center Power Market Growth
Several factors fuel market growth: the exponential increase in data generation and consumption, the expansion of cloud computing and edge data centers, and rising demand for high-performance computing. Government initiatives promoting digital infrastructure and supportive regulatory frameworks also contribute significantly. Economic factors, such as increased investment in IT infrastructure and the growing adoption of digital transformation strategies by various industries, further propel market expansion.
Obstacles in the Data Center Power Market Market
The market faces challenges including supply chain disruptions, impacting the availability of critical components. Regulatory hurdles, particularly concerning environmental regulations and energy efficiency standards, can pose obstacles to market expansion. Intense competition among established players and the emergence of new entrants create pricing pressures and limit profit margins. These factors can collectively hinder market growth if not effectively managed.
Future Opportunities in Data Center Power Market
Emerging opportunities lie in the growth of edge computing, AI, and IoT, which drive demand for efficient and scalable power solutions. The increasing adoption of renewable energy sources in data centers presents opportunities for sustainable power solutions. Expansion into developing economies with growing digitalization presents significant untapped potential.
Major Players in the Data Center Power Market Ecosystem
- ABB Ltd
- Legrand SA
- Fujitsu Ltd
- Vertiv Holdings Co
- Schneider Electric SE
- Rittal GmbH & Co KG
- Schleifenbauer Products BV
- Cisco Technology Inc
- Black Box Corporatio
- PDU Experts UK Ltd
- Eaton Corporation
Key Developments in Data Center Power Market Industry
- November 2023: Vertiv launched Vertiv SmartMod Max CW, a prefabricated modular data center supporting up to 200kW IT load. This addresses the growing demand for scalable and customizable data center solutions, especially in edge computing.
- October 2023: ABB introduced the ABB TruFit power distribution unit, designed for rapid deployment and offering high configurability for 50-800 kVA applications. This responds to the increasing need for adaptable and reliable power solutions in fast-paced data center projects.
Strategic Data Center Power Market Market Forecast
The Data Center Power Market is poised for sustained growth, driven by the ongoing digital transformation across various sectors and the increasing demand for reliable and efficient power solutions. The adoption of innovative technologies, such as AI-powered power management systems and renewable energy integration, will further propel market expansion. New opportunities in edge computing and emerging markets will contribute to significant market growth in the coming years.
Data Center Power Market Segmentation
-
1. Type
-
1.1. Solutions
- 1.1.1. Power Distribution Unit
- 1.1.2. UPS
- 1.1.3. Busway
- 1.1.4. Other Solutions
-
1.2. Services
- 1.2.1. Consulting
- 1.2.2. System Integration
- 1.2.3. Professional Services
-
1.1. Solutions
-
2. End-user Application
- 2.1. Information Technology
- 2.2. Manufacturing
- 2.3. BFSI
- 2.4. Government
- 2.5. Telecom
- 2.6. Other End-user Applications
-
3. Data Center Size
- 3.1. Small and Medium
- 3.2. Large
Data Center Power Market Segmentation By Geography
- 1. North America
- 2. Europe
- 3. Asia
- 4. Australia and New Zealand
- 5. Latin America
- 6. Middle East and Africa
Data Center Power Market REPORT HIGHLIGHTS
| Aspects | Details |
|---|---|
| Study Period | 2019-2033 |
| Base Year | 2024 |
| Estimated Year | 2025 |
| Forecast Period | 2025-2033 |
| Historical Period | 2019-2024 |
| Growth Rate | CAGR of 6.87% from 2019-2033 |
| Segmentation |
|
Table of Contents
- 1. Introduction
- 1.1. Research Scope
- 1.2. Market Segmentation
- 1.3. Research Methodology
- 1.4. Definitions and Assumptions
- 2. Executive Summary
- 2.1. Introduction
- 3. Market Dynamics
- 3.1. Introduction
- 3.2. Market Drivers
- 3.2.1. Rising Adoption of Mega Data Centers and Cloud Computing; Increasing Demand to Reduce Operational Costs
- 3.3. Market Restrains
- 3.3.1. High Cost of Installation and Maintenance
- 3.4. Market Trends
- 3.4.1. UPS to be the Fastest Growing Solution Type
- 4. Market Factor Analysis
- 4.1. Porters Five Forces
- 4.2. Supply/Value Chain
- 4.3. PESTEL analysis
- 4.4. Market Entropy
- 4.5. Patent/Trademark Analysis
- 5. Global Data Center Power Market Analysis, Insights and Forecast, 2019-2031
- 5.1. Market Analysis, Insights and Forecast - by Type
- 5.1.1. Solutions
- 5.1.1.1. Power Distribution Unit
- 5.1.1.2. UPS
- 5.1.1.3. Busway
- 5.1.1.4. Other Solutions
- 5.1.2. Services
- 5.1.2.1. Consulting
- 5.1.2.2. System Integration
- 5.1.2.3. Professional Services
- 5.1.1. Solutions
- 5.2. Market Analysis, Insights and Forecast - by End-user Application
- 5.2.1. Information Technology
- 5.2.2. Manufacturing
- 5.2.3. BFSI
- 5.2.4. Government
- 5.2.5. Telecom
- 5.2.6. Other End-user Applications
- 5.3. Market Analysis, Insights and Forecast - by Data Center Size
- 5.3.1. Small and Medium
- 5.3.2. Large
- 5.4. Market Analysis, Insights and Forecast - by Region
- 5.4.1. North America
- 5.4.2. Europe
- 5.4.3. Asia
- 5.4.4. Australia and New Zealand
- 5.4.5. Latin America
- 5.4.6. Middle East and Africa
- 5.1. Market Analysis, Insights and Forecast - by Type
- 6. North America Data Center Power Market Analysis, Insights and Forecast, 2019-2031
- 6.1. Market Analysis, Insights and Forecast - by Type
- 6.1.1. Solutions
- 6.1.1.1. Power Distribution Unit
- 6.1.1.2. UPS
- 6.1.1.3. Busway
- 6.1.1.4. Other Solutions
- 6.1.2. Services
- 6.1.2.1. Consulting
- 6.1.2.2. System Integration
- 6.1.2.3. Professional Services
- 6.1.1. Solutions
- 6.2. Market Analysis, Insights and Forecast - by End-user Application
- 6.2.1. Information Technology
- 6.2.2. Manufacturing
- 6.2.3. BFSI
- 6.2.4. Government
- 6.2.5. Telecom
- 6.2.6. Other End-user Applications
- 6.3. Market Analysis, Insights and Forecast - by Data Center Size
- 6.3.1. Small and Medium
- 6.3.2. Large
- 6.1. Market Analysis, Insights and Forecast - by Type
- 7. Europe Data Center Power Market Analysis, Insights and Forecast, 2019-2031
- 7.1. Market Analysis, Insights and Forecast - by Type
- 7.1.1. Solutions
- 7.1.1.1. Power Distribution Unit
- 7.1.1.2. UPS
- 7.1.1.3. Busway
- 7.1.1.4. Other Solutions
- 7.1.2. Services
- 7.1.2.1. Consulting
- 7.1.2.2. System Integration
- 7.1.2.3. Professional Services
- 7.1.1. Solutions
- 7.2. Market Analysis, Insights and Forecast - by End-user Application
- 7.2.1. Information Technology
- 7.2.2. Manufacturing
- 7.2.3. BFSI
- 7.2.4. Government
- 7.2.5. Telecom
- 7.2.6. Other End-user Applications
- 7.3. Market Analysis, Insights and Forecast - by Data Center Size
- 7.3.1. Small and Medium
- 7.3.2. Large
- 7.1. Market Analysis, Insights and Forecast - by Type
- 8. Asia Data Center Power Market Analysis, Insights and Forecast, 2019-2031
- 8.1. Market Analysis, Insights and Forecast - by Type
- 8.1.1. Solutions
- 8.1.1.1. Power Distribution Unit
- 8.1.1.2. UPS
- 8.1.1.3. Busway
- 8.1.1.4. Other Solutions
- 8.1.2. Services
- 8.1.2.1. Consulting
- 8.1.2.2. System Integration
- 8.1.2.3. Professional Services
- 8.1.1. Solutions
- 8.2. Market Analysis, Insights and Forecast - by End-user Application
- 8.2.1. Information Technology
- 8.2.2. Manufacturing
- 8.2.3. BFSI
- 8.2.4. Government
- 8.2.5. Telecom
- 8.2.6. Other End-user Applications
- 8.3. Market Analysis, Insights and Forecast - by Data Center Size
- 8.3.1. Small and Medium
- 8.3.2. Large
- 8.1. Market Analysis, Insights and Forecast - by Type
- 9. Australia and New Zealand Data Center Power Market Analysis, Insights and Forecast, 2019-2031
- 9.1. Market Analysis, Insights and Forecast - by Type
- 9.1.1. Solutions
- 9.1.1.1. Power Distribution Unit
- 9.1.1.2. UPS
- 9.1.1.3. Busway
- 9.1.1.4. Other Solutions
- 9.1.2. Services
- 9.1.2.1. Consulting
- 9.1.2.2. System Integration
- 9.1.2.3. Professional Services
- 9.1.1. Solutions
- 9.2. Market Analysis, Insights and Forecast - by End-user Application
- 9.2.1. Information Technology
- 9.2.2. Manufacturing
- 9.2.3. BFSI
- 9.2.4. Government
- 9.2.5. Telecom
- 9.2.6. Other End-user Applications
- 9.3. Market Analysis, Insights and Forecast - by Data Center Size
- 9.3.1. Small and Medium
- 9.3.2. Large
- 9.1. Market Analysis, Insights and Forecast - by Type
- 10. Latin America Data Center Power Market Analysis, Insights and Forecast, 2019-2031
- 10.1. Market Analysis, Insights and Forecast - by Type
- 10.1.1. Solutions
- 10.1.1.1. Power Distribution Unit
- 10.1.1.2. UPS
- 10.1.1.3. Busway
- 10.1.1.4. Other Solutions
- 10.1.2. Services
- 10.1.2.1. Consulting
- 10.1.2.2. System Integration
- 10.1.2.3. Professional Services
- 10.1.1. Solutions
- 10.2. Market Analysis, Insights and Forecast - by End-user Application
- 10.2.1. Information Technology
- 10.2.2. Manufacturing
- 10.2.3. BFSI
- 10.2.4. Government
- 10.2.5. Telecom
- 10.2.6. Other End-user Applications
- 10.3. Market Analysis, Insights and Forecast - by Data Center Size
- 10.3.1. Small and Medium
- 10.3.2. Large
- 10.1. Market Analysis, Insights and Forecast - by Type
- 11. Middle East and Africa Data Center Power Market Analysis, Insights and Forecast, 2019-2031
- 11.1. Market Analysis, Insights and Forecast - by Type
- 11.1.1. Solutions
- 11.1.1.1. Power Distribution Unit
- 11.1.1.2. UPS
- 11.1.1.3. Busway
- 11.1.1.4. Other Solutions
- 11.1.2. Services
- 11.1.2.1. Consulting
- 11.1.2.2. System Integration
- 11.1.2.3. Professional Services
- 11.1.1. Solutions
- 11.2. Market Analysis, Insights and Forecast - by End-user Application
- 11.2.1. Information Technology
- 11.2.2. Manufacturing
- 11.2.3. BFSI
- 11.2.4. Government
- 11.2.5. Telecom
- 11.2.6. Other End-user Applications
- 11.3. Market Analysis, Insights and Forecast - by Data Center Size
- 11.3.1. Small and Medium
- 11.3.2. Large
- 11.1. Market Analysis, Insights and Forecast - by Type
- 12. North America Data Center Power Market Analysis, Insights and Forecast, 2019-2031
- 12.1. Market Analysis, Insights and Forecast - By Country/Sub-region
- 12.1.1.
- 13. Europe Data Center Power Market Analysis, Insights and Forecast, 2019-2031
- 13.1. Market Analysis, Insights and Forecast - By Country/Sub-region
- 13.1.1.
- 14. Asia Pacific Data Center Power Market Analysis, Insights and Forecast, 2019-2031
- 14.1. Market Analysis, Insights and Forecast - By Country/Sub-region
- 14.1.1.
- 15. Rest of the World Data Center Power Market Analysis, Insights and Forecast, 2019-2031
- 15.1. Market Analysis, Insights and Forecast - By Country/Sub-region
- 15.1.1.
- 16. Competitive Analysis
- 16.1. Global Market Share Analysis 2024
- 16.2. Company Profiles
- 16.2.1 ABB Ltd
- 16.2.1.1. Overview
- 16.2.1.2. Products
- 16.2.1.3. SWOT Analysis
- 16.2.1.4. Recent Developments
- 16.2.1.5. Financials (Based on Availability)
- 16.2.2 Legrand SA
- 16.2.2.1. Overview
- 16.2.2.2. Products
- 16.2.2.3. SWOT Analysis
- 16.2.2.4. Recent Developments
- 16.2.2.5. Financials (Based on Availability)
- 16.2.3 Fujitsu Ltd
- 16.2.3.1. Overview
- 16.2.3.2. Products
- 16.2.3.3. SWOT Analysis
- 16.2.3.4. Recent Developments
- 16.2.3.5. Financials (Based on Availability)
- 16.2.4 Vertiv Holdings Co
- 16.2.4.1. Overview
- 16.2.4.2. Products
- 16.2.4.3. SWOT Analysis
- 16.2.4.4. Recent Developments
- 16.2.4.5. Financials (Based on Availability)
- 16.2.5 Schneider Electric SE
- 16.2.5.1. Overview
- 16.2.5.2. Products
- 16.2.5.3. SWOT Analysis
- 16.2.5.4. Recent Developments
- 16.2.5.5. Financials (Based on Availability)
- 16.2.6 Rittal GmbH & Co KG
- 16.2.6.1. Overview
- 16.2.6.2. Products
- 16.2.6.3. SWOT Analysis
- 16.2.6.4. Recent Developments
- 16.2.6.5. Financials (Based on Availability)
- 16.2.7 Schleifenbauer Products BV
- 16.2.7.1. Overview
- 16.2.7.2. Products
- 16.2.7.3. SWOT Analysis
- 16.2.7.4. Recent Developments
- 16.2.7.5. Financials (Based on Availability)
- 16.2.8 Cisco Technology Inc
- 16.2.8.1. Overview
- 16.2.8.2. Products
- 16.2.8.3. SWOT Analysis
- 16.2.8.4. Recent Developments
- 16.2.8.5. Financials (Based on Availability)
- 16.2.9 Black Box Corporatio
- 16.2.9.1. Overview
- 16.2.9.2. Products
- 16.2.9.3. SWOT Analysis
- 16.2.9.4. Recent Developments
- 16.2.9.5. Financials (Based on Availability)
- 16.2.10 PDU Experts UK Ltd
- 16.2.10.1. Overview
- 16.2.10.2. Products
- 16.2.10.3. SWOT Analysis
- 16.2.10.4. Recent Developments
- 16.2.10.5. Financials (Based on Availability)
- 16.2.11 Eaton Corporation
- 16.2.11.1. Overview
- 16.2.11.2. Products
- 16.2.11.3. SWOT Analysis
- 16.2.11.4. Recent Developments
- 16.2.11.5. Financials (Based on Availability)
- 16.2.1 ABB Ltd
List of Figures
- Figure 1: Global Data Center Power Market Revenue Breakdown (Million, %) by Region 2024 & 2032
- Figure 2: North America Data Center Power Market Revenue (Million), by Country 2024 & 2032
- Figure 3: North America Data Center Power Market Revenue Share (%), by Country 2024 & 2032
- Figure 4: Europe Data Center Power Market Revenue (Million), by Country 2024 & 2032
- Figure 5: Europe Data Center Power Market Revenue Share (%), by Country 2024 & 2032
- Figure 6: Asia Pacific Data Center Power Market Revenue (Million), by Country 2024 & 2032
- Figure 7: Asia Pacific Data Center Power Market Revenue Share (%), by Country 2024 & 2032
- Figure 8: Rest of the World Data Center Power Market Revenue (Million), by Country 2024 & 2032
- Figure 9: Rest of the World Data Center Power Market Revenue Share (%), by Country 2024 & 2032
- Figure 10: North America Data Center Power Market Revenue (Million), by Type 2024 & 2032
- Figure 11: North America Data Center Power Market Revenue Share (%), by Type 2024 & 2032
- Figure 12: North America Data Center Power Market Revenue (Million), by End-user Application 2024 & 2032
- Figure 13: North America Data Center Power Market Revenue Share (%), by End-user Application 2024 & 2032
- Figure 14: North America Data Center Power Market Revenue (Million), by Data Center Size 2024 & 2032
- Figure 15: North America Data Center Power Market Revenue Share (%), by Data Center Size 2024 & 2032
- Figure 16: North America Data Center Power Market Revenue (Million), by Country 2024 & 2032
- Figure 17: North America Data Center Power Market Revenue Share (%), by Country 2024 & 2032
- Figure 18: Europe Data Center Power Market Revenue (Million), by Type 2024 & 2032
- Figure 19: Europe Data Center Power Market Revenue Share (%), by Type 2024 & 2032
- Figure 20: Europe Data Center Power Market Revenue (Million), by End-user Application 2024 & 2032
- Figure 21: Europe Data Center Power Market Revenue Share (%), by End-user Application 2024 & 2032
- Figure 22: Europe Data Center Power Market Revenue (Million), by Data Center Size 2024 & 2032
- Figure 23: Europe Data Center Power Market Revenue Share (%), by Data Center Size 2024 & 2032
- Figure 24: Europe Data Center Power Market Revenue (Million), by Country 2024 & 2032
- Figure 25: Europe Data Center Power Market Revenue Share (%), by Country 2024 & 2032
- Figure 26: Asia Data Center Power Market Revenue (Million), by Type 2024 & 2032
- Figure 27: Asia Data Center Power Market Revenue Share (%), by Type 2024 & 2032
- Figure 28: Asia Data Center Power Market Revenue (Million), by End-user Application 2024 & 2032
- Figure 29: Asia Data Center Power Market Revenue Share (%), by End-user Application 2024 & 2032
- Figure 30: Asia Data Center Power Market Revenue (Million), by Data Center Size 2024 & 2032
- Figure 31: Asia Data Center Power Market Revenue Share (%), by Data Center Size 2024 & 2032
- Figure 32: Asia Data Center Power Market Revenue (Million), by Country 2024 & 2032
- Figure 33: Asia Data Center Power Market Revenue Share (%), by Country 2024 & 2032
- Figure 34: Australia and New Zealand Data Center Power Market Revenue (Million), by Type 2024 & 2032
- Figure 35: Australia and New Zealand Data Center Power Market Revenue Share (%), by Type 2024 & 2032
- Figure 36: Australia and New Zealand Data Center Power Market Revenue (Million), by End-user Application 2024 & 2032
- Figure 37: Australia and New Zealand Data Center Power Market Revenue Share (%), by End-user Application 2024 & 2032
- Figure 38: Australia and New Zealand Data Center Power Market Revenue (Million), by Data Center Size 2024 & 2032
- Figure 39: Australia and New Zealand Data Center Power Market Revenue Share (%), by Data Center Size 2024 & 2032
- Figure 40: Australia and New Zealand Data Center Power Market Revenue (Million), by Country 2024 & 2032
- Figure 41: Australia and New Zealand Data Center Power Market Revenue Share (%), by Country 2024 & 2032
- Figure 42: Latin America Data Center Power Market Revenue (Million), by Type 2024 & 2032
- Figure 43: Latin America Data Center Power Market Revenue Share (%), by Type 2024 & 2032
- Figure 44: Latin America Data Center Power Market Revenue (Million), by End-user Application 2024 & 2032
- Figure 45: Latin America Data Center Power Market Revenue Share (%), by End-user Application 2024 & 2032
- Figure 46: Latin America Data Center Power Market Revenue (Million), by Data Center Size 2024 & 2032
- Figure 47: Latin America Data Center Power Market Revenue Share (%), by Data Center Size 2024 & 2032
- Figure 48: Latin America Data Center Power Market Revenue (Million), by Country 2024 & 2032
- Figure 49: Latin America Data Center Power Market Revenue Share (%), by Country 2024 & 2032
- Figure 50: Middle East and Africa Data Center Power Market Revenue (Million), by Type 2024 & 2032
- Figure 51: Middle East and Africa Data Center Power Market Revenue Share (%), by Type 2024 & 2032
- Figure 52: Middle East and Africa Data Center Power Market Revenue (Million), by End-user Application 2024 & 2032
- Figure 53: Middle East and Africa Data Center Power Market Revenue Share (%), by End-user Application 2024 & 2032
- Figure 54: Middle East and Africa Data Center Power Market Revenue (Million), by Data Center Size 2024 & 2032
- Figure 55: Middle East and Africa Data Center Power Market Revenue Share (%), by Data Center Size 2024 & 2032
- Figure 56: Middle East and Africa Data Center Power Market Revenue (Million), by Country 2024 & 2032
- Figure 57: Middle East and Africa Data Center Power Market Revenue Share (%), by Country 2024 & 2032
List of Tables
- Table 1: Global Data Center Power Market Revenue Million Forecast, by Region 2019 & 2032
- Table 2: Global Data Center Power Market Revenue Million Forecast, by Type 2019 & 2032
- Table 3: Global Data Center Power Market Revenue Million Forecast, by End-user Application 2019 & 2032
- Table 4: Global Data Center Power Market Revenue Million Forecast, by Data Center Size 2019 & 2032
- Table 5: Global Data Center Power Market Revenue Million Forecast, by Region 2019 & 2032
- Table 6: Global Data Center Power Market Revenue Million Forecast, by Country 2019 & 2032
- Table 7: Data Center Power Market Revenue (Million) Forecast, by Application 2019 & 2032
- Table 8: Global Data Center Power Market Revenue Million Forecast, by Country 2019 & 2032
- Table 9: Data Center Power Market Revenue (Million) Forecast, by Application 2019 & 2032
- Table 10: Global Data Center Power Market Revenue Million Forecast, by Country 2019 & 2032
- Table 11: Data Center Power Market Revenue (Million) Forecast, by Application 2019 & 2032
- Table 12: Global Data Center Power Market Revenue Million Forecast, by Country 2019 & 2032
- Table 13: Data Center Power Market Revenue (Million) Forecast, by Application 2019 & 2032
- Table 14: Global Data Center Power Market Revenue Million Forecast, by Type 2019 & 2032
- Table 15: Global Data Center Power Market Revenue Million Forecast, by End-user Application 2019 & 2032
- Table 16: Global Data Center Power Market Revenue Million Forecast, by Data Center Size 2019 & 2032
- Table 17: Global Data Center Power Market Revenue Million Forecast, by Country 2019 & 2032
- Table 18: Global Data Center Power Market Revenue Million Forecast, by Type 2019 & 2032
- Table 19: Global Data Center Power Market Revenue Million Forecast, by End-user Application 2019 & 2032
- Table 20: Global Data Center Power Market Revenue Million Forecast, by Data Center Size 2019 & 2032
- Table 21: Global Data Center Power Market Revenue Million Forecast, by Country 2019 & 2032
- Table 22: Global Data Center Power Market Revenue Million Forecast, by Type 2019 & 2032
- Table 23: Global Data Center Power Market Revenue Million Forecast, by End-user Application 2019 & 2032
- Table 24: Global Data Center Power Market Revenue Million Forecast, by Data Center Size 2019 & 2032
- Table 25: Global Data Center Power Market Revenue Million Forecast, by Country 2019 & 2032
- Table 26: Global Data Center Power Market Revenue Million Forecast, by Type 2019 & 2032
- Table 27: Global Data Center Power Market Revenue Million Forecast, by End-user Application 2019 & 2032
- Table 28: Global Data Center Power Market Revenue Million Forecast, by Data Center Size 2019 & 2032
- Table 29: Global Data Center Power Market Revenue Million Forecast, by Country 2019 & 2032
- Table 30: Global Data Center Power Market Revenue Million Forecast, by Type 2019 & 2032
- Table 31: Global Data Center Power Market Revenue Million Forecast, by End-user Application 2019 & 2032
- Table 32: Global Data Center Power Market Revenue Million Forecast, by Data Center Size 2019 & 2032
- Table 33: Global Data Center Power Market Revenue Million Forecast, by Country 2019 & 2032
- Table 34: Global Data Center Power Market Revenue Million Forecast, by Type 2019 & 2032
- Table 35: Global Data Center Power Market Revenue Million Forecast, by End-user Application 2019 & 2032
- Table 36: Global Data Center Power Market Revenue Million Forecast, by Data Center Size 2019 & 2032
- Table 37: Global Data Center Power Market Revenue Million Forecast, by Country 2019 & 2032
Frequently Asked Questions
1. What is the projected Compound Annual Growth Rate (CAGR) of the Data Center Power Market?
The projected CAGR is approximately 6.87%.
2. Which companies are prominent players in the Data Center Power Market?
Key companies in the market include ABB Ltd, Legrand SA, Fujitsu Ltd, Vertiv Holdings Co, Schneider Electric SE, Rittal GmbH & Co KG, Schleifenbauer Products BV, Cisco Technology Inc, Black Box Corporatio, PDU Experts UK Ltd, Eaton Corporation.
3. What are the main segments of the Data Center Power Market?
The market segments include Type, End-user Application, Data Center Size.
4. Can you provide details about the market size?
The market size is estimated to be USD 24.33 Million as of 2022.
5. What are some drivers contributing to market growth?
Rising Adoption of Mega Data Centers and Cloud Computing; Increasing Demand to Reduce Operational Costs.
6. What are the notable trends driving market growth?
UPS to be the Fastest Growing Solution Type.
7. Are there any restraints impacting market growth?
High Cost of Installation and Maintenance.
8. Can you provide examples of recent developments in the market?
November 2023: Vertiv introduced Vertiv SmartMod Max CW, a prefabricated modular data center designed to address the increasing demand. The solution supports up to 200kW of total IT load in a single system. It presents a range of customization options, including power capacities, number of racks and rack sizes, and module dimensions. Vertiv SmartMod Max CW incorporates Vertiv Liebert EXM uninterruptible power supply (UPS) system in 100 kW, 150 kW, and 200 kW power ratings and thermal management units with intelligent controls, enabling small-scale operations, like edge data centers, to meet their specific requirements.
9. What pricing options are available for accessing the report?
Pricing options include single-user, multi-user, and enterprise licenses priced at USD 4750, USD 5250, and USD 8750 respectively.
10. Is the market size provided in terms of value or volume?
The market size is provided in terms of value, measured in Million.
11. Are there any specific market keywords associated with the report?
Yes, the market keyword associated with the report is "Data Center Power Market," which aids in identifying and referencing the specific market segment covered.
12. How do I determine which pricing option suits my needs best?
The pricing options vary based on user requirements and access needs. Individual users may opt for single-user licenses, while businesses requiring broader access may choose multi-user or enterprise licenses for cost-effective access to the report.
13. Are there any additional resources or data provided in the Data Center Power Market report?
While the report offers comprehensive insights, it's advisable to review the specific contents or supplementary materials provided to ascertain if additional resources or data are available.
14. How can I stay updated on further developments or reports in the Data Center Power Market?
To stay informed about further developments, trends, and reports in the Data Center Power Market, consider subscribing to industry newsletters, following relevant companies and organizations, or regularly checking reputable industry news sources and publications.
Methodology
Step 1 - Identification of Relevant Samples Size from Population Database


Step 2 - Approaches for Defining Global Market Size (Value, Volume* & Price*)

Note*: In applicable scenarios
Step 3 - Data Sources
Primary Research
- Web Analytics
- Survey Reports
- Research Institute
- Latest Research Reports
- Opinion Leaders
Secondary Research
- Annual Reports
- White Paper
- Latest Press Release
- Industry Association
- Paid Database
- Investor Presentations

Step 4 - Data Triangulation
Involves using different sources of information in order to increase the validity of a study
These sources are likely to be stakeholders in a program - participants, other researchers, program staff, other community members, and so on.
Then we put all data in single framework & apply various statistical tools to find out the dynamic on the market.
During the analysis stage, feedback from the stakeholder groups would be compared to determine areas of agreement as well as areas of divergence
