

Key Insights
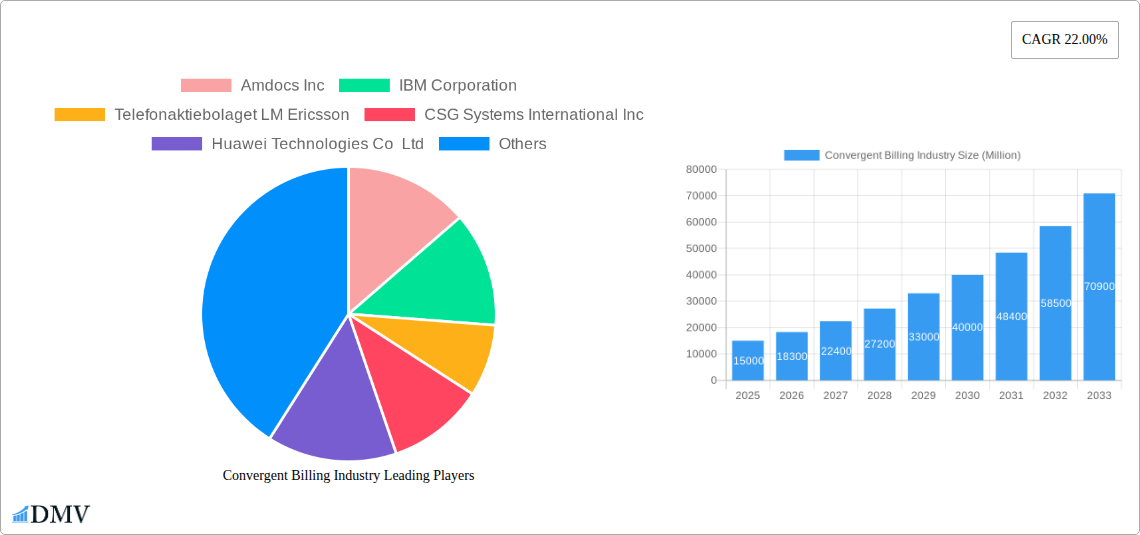
The Convergent Billing market is experiencing robust growth, projected at a 22% CAGR from 2025 to 2033. This expansion is fueled by the increasing demand for efficient and integrated billing solutions across diverse industries, particularly telecommunications, media, and energy. The shift towards digital transformation and the rising adoption of cloud-based solutions are key drivers. Businesses are increasingly seeking solutions that offer automated invoice generation, streamlined payment processing, and enhanced customer relationship management (CRM) capabilities to optimize operational efficiency and improve customer satisfaction. The market is segmented by component (solution, services), deployment (on-cloud, on-premise), and solution type (bill cycle optimization, billing account management, automated invoice and bill generation, payment and collection, CRM). The on-cloud deployment segment is expected to witness significant growth due to its scalability, cost-effectiveness, and accessibility. While the on-premise segment remains relevant for businesses with stringent security requirements, the overall trend favors cloud-based solutions. Key players like Amdocs, IBM, Ericsson, CSG Systems, Huawei, Oracle, Comarch, Nexign, and Formula Telecom are actively competing in this dynamic market, investing in R&D and strategic partnerships to maintain their market share and cater to evolving customer needs.
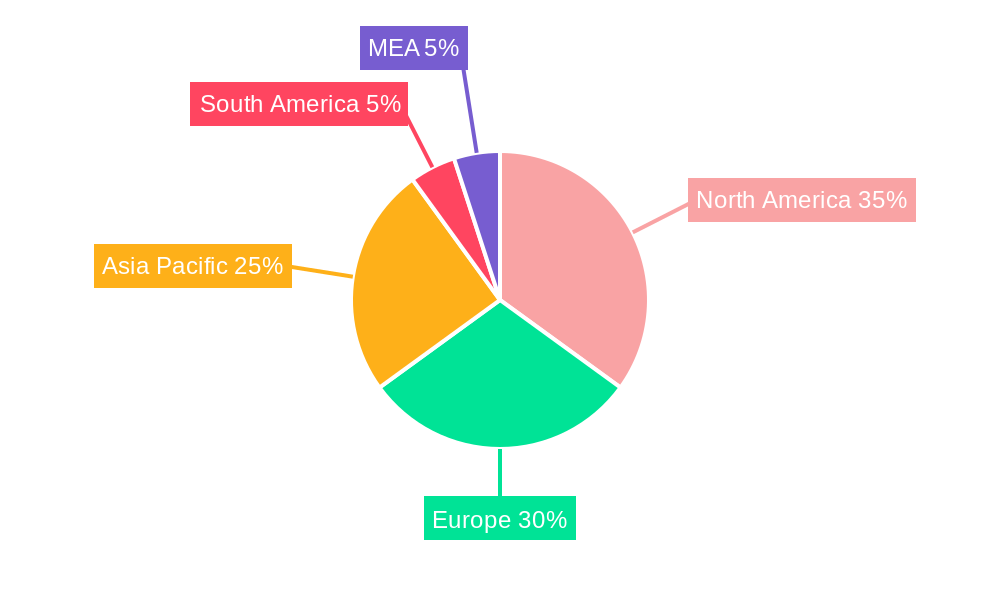
Geographic expansion is another key aspect of market growth. North America and Europe currently hold significant market shares, driven by early adoption and technological advancements. However, the Asia-Pacific region is anticipated to witness substantial growth in the coming years, driven by increasing digitalization and a burgeoning telecommunications sector. Competitive intensity is high, with companies focusing on innovation, strategic acquisitions, and partnerships to enhance their product offerings and expand their market reach. Potential restraints include the complexities associated with integrating legacy systems and the need for robust cybersecurity measures to protect sensitive customer data. The market's future trajectory hinges on further technological advancements, the continued adoption of cloud computing, and the ability of vendors to offer tailored solutions that address the unique billing challenges faced by different industries.
Convergent Billing Industry Market Report: 2019-2033
This comprehensive report delivers an in-depth analysis of the Convergent Billing industry, projecting a market value of $XX Million by 2033. It provides a granular view of market composition, trends, leading players, and future growth opportunities, empowering stakeholders to make informed strategic decisions. The study covers the period 2019-2033, with a base year of 2025 and a forecast period of 2025-2033.
Convergent Billing Industry Market Composition & Trends
This section evaluates the competitive landscape, innovation drivers, and regulatory factors influencing the Convergent Billing market. We analyze market concentration, revealing the market share distribution among key players like Amdocs Inc, IBM Corporation, Telefonaktiebolaget LM Ericsson, CSG Systems International Inc, Huawei Technologies Co Ltd, Oracle Corporation, Comarch SA, Nexign JSC, and Formula Telecom Solutions Ltd. The report quantifies the impact of M&A activities, estimating total deal values at $XX Million during the historical period (2019-2024). Further analysis explores the influence of substitute products and evolving end-user profiles on market dynamics. The regulatory landscape is examined, highlighting key legislation and its effects on market growth.
- Market Share Distribution: Amdocs Inc holds an estimated xx% market share in 2025, followed by IBM Corporation at xx%, and Ericsson at xx%.
- M&A Deal Value (2019-2024): Approximately $XX Million.
- Key Regulatory Influences: Detailed analysis of GDPR, CCPA, and other relevant regulations and their impact on data privacy and security within the convergent billing space.
- Substitute Product Analysis: Examination of alternative billing solutions and their impact on market competition.
Convergent Billing Industry Industry Evolution
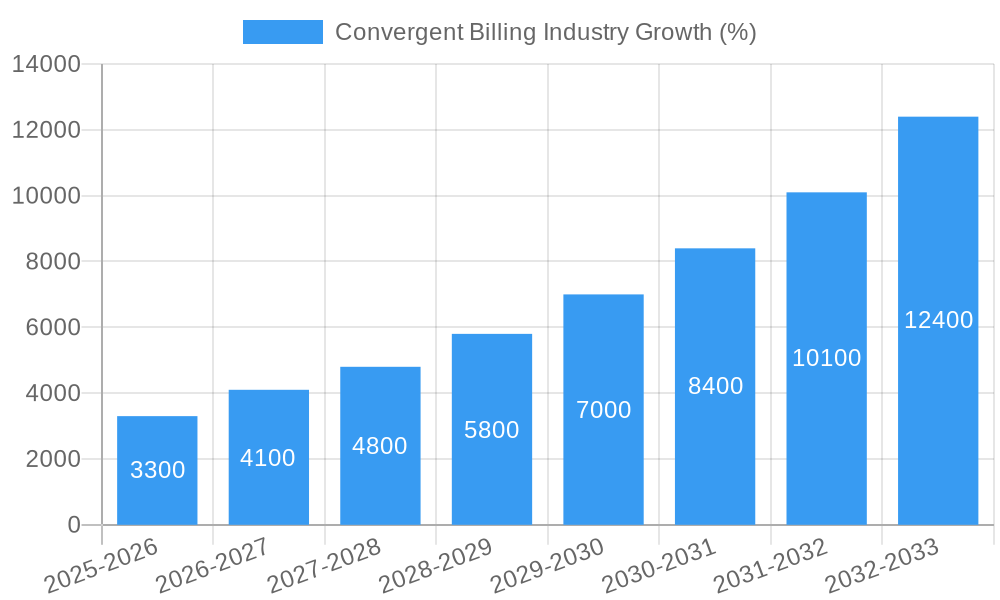
This section meticulously charts the evolution of the Convergent Billing industry from 2019 to 2033. We analyze market growth trajectories, pinpointing key inflection points and drivers. The report delves into technological advancements, such as the increasing adoption of AI and cloud-based solutions, and their transformative effect on billing processes. Furthermore, we explore the influence of shifting consumer demands, including the preference for personalized billing experiences and seamless payment options, on industry development. Specific data points, including compound annual growth rates (CAGR) and adoption rates for key technologies, are provided. For instance, the market is projected to grow at a CAGR of xx% during the forecast period (2025-2033), reaching $XX Million by 2033. The adoption rate of cloud-based convergent billing solutions is expected to reach xx% by 2033.
Leading Regions, Countries, or Segments in Convergent Billing Industry
This section identifies the dominant regions, countries, and segments within the Convergent Billing market. We pinpoint the leading segment by component (Solution vs. Services), deployment (On-Cloud vs. On-Premise), and specific solution type (Bill Cycle Optimization, Billing Account Management, Automated Invoice and Bill Generation, Payment and Collection, Customer Relationship Management). The analysis highlights key drivers for dominance in each segment, including investment trends and regulatory support.
- Dominant Region: North America, driven by high technological adoption and robust regulatory frameworks.
- Dominant Deployment Model: On-Cloud, fueled by scalability, cost-effectiveness, and enhanced security.
- Fastest-Growing Solution: Automated Invoice and Bill Generation, driven by the need for increased efficiency and reduced manual errors.
- Key Drivers: Paragraphs will provide in-depth analysis of investment trends, technological advancements, and regulatory influences on segment dominance. For example, government initiatives promoting digital transformation are discussed in detail for specific regions.
Convergent Billing Industry Product Innovations
This section showcases recent product innovations in convergent billing, highlighting unique selling propositions (USPs) and technological advancements. New features like AI-powered anomaly detection, predictive analytics for revenue optimization, and enhanced customer self-service portals are discussed, along with their performance metrics. The emphasis is on the capabilities that provide competitive advantages for vendors.
Propelling Factors for Convergent Billing Industry Growth
Several factors are driving the growth of the Convergent Billing industry. Technological advancements, such as the rise of cloud computing, AI, and big data analytics, are automating processes and improving efficiency. Economic factors, including the increasing demand for cost optimization and improved customer experience, are pushing adoption. Favorable regulatory environments in several key markets also contribute to the industry's expansion.
Obstacles in the Convergent Billing Industry Market
Despite its growth potential, the Convergent Billing market faces challenges. These include regulatory hurdles related to data privacy and security, supply chain disruptions impacting the delivery of hardware and software components, and intense competition among established players and new entrants. These barriers result in an estimated xx% reduction in market growth in 2026.
Future Opportunities in Convergent Billing Industry
The future of Convergent Billing presents significant opportunities. The expansion into new and emerging markets, particularly in developing economies with increasing telecom penetration, holds immense potential. Advancements in technologies such as 5G and IoT will create new avenues for growth, particularly through enhanced data analytics capabilities and the development of new billing models.
Major Players in the Convergent Billing Industry Ecosystem
- Amdocs Inc
- IBM Corporation
- Telefonaktiebolaget LM Ericsson
- CSG Systems International Inc
- Huawei Technologies Co Ltd
- Oracle Corporation
- Comarch SA
- Nexign JSC
- Formula Telecom Solutions Ltd
Key Developments in Convergent Billing Industry Industry
- 2022-Q4: Amdocs announced a new AI-powered billing solution.
- 2023-Q1: IBM and Ericsson partnered to offer a joint convergent billing platform.
- (Add further bullet points with specific dates and impactful developments)
Strategic Convergent Billing Industry Market Forecast
The Convergent Billing market is poised for robust growth, driven by increasing demand for efficient and customer-centric billing solutions. The ongoing adoption of cloud-based technologies, coupled with the development of innovative AI-powered features, will propel market expansion. The convergence of various billing functions will simplify operations and enhance customer experience. The market is expected to reach $XX Million by 2033, presenting substantial opportunities for market players.
Convergent Billing Industry Segmentation
-
1. Component
- 1.1. Solution
- 1.2. Services
-
2. Deployment
- 2.1. On-Cloud
- 2.2. On-Premise
-
3. Solutions
- 3.1. Bill Cycle Optimization
- 3.2. Billing Account Management
- 3.3. Automated Invoice and Bill Generation
- 3.4. Payment and Collection
- 3.5. Customer Relationship Management
Convergent Billing Industry Segmentation By Geography
- 1. North America
- 2. Europe
- 3. Asia Pacific
- 4. Latin America
- 5. Middle East and Africa
Convergent Billing Industry REPORT HIGHLIGHTS
| Aspects | Details |
|---|---|
| Study Period | 2019-2033 |
| Base Year | 2024 |
| Estimated Year | 2025 |
| Forecast Period | 2025-2033 |
| Historical Period | 2019-2024 |
| Growth Rate | CAGR of 22.00% from 2019-2033 |
| Segmentation |
|
Table of Contents
- 1. Introduction
- 1.1. Research Scope
- 1.2. Market Segmentation
- 1.3. Research Methodology
- 1.4. Definitions and Assumptions
- 2. Executive Summary
- 2.1. Introduction
- 3. Market Dynamics
- 3.1. Introduction
- 3.2. Market Drivers
- 3.2.1. ; Digitization of the Telecom Sector; Increasing Complexity of New Service Architecture and Increasing Demand for Unified Services; Increasing Focus on Customer Satisfaction
- 3.3. Market Restrains
- 3.3.1. ; The Inclination Towards Traditional Billing Systems
- 3.4. Market Trends
- 3.4.1. Cloud-Based Deployment is Expected to Spur Growth
- 4. Market Factor Analysis
- 4.1. Porters Five Forces
- 4.2. Supply/Value Chain
- 4.3. PESTEL analysis
- 4.4. Market Entropy
- 4.5. Patent/Trademark Analysis
- 5. Global Convergent Billing Industry Analysis, Insights and Forecast, 2019-2031
- 5.1. Market Analysis, Insights and Forecast - by Component
- 5.1.1. Solution
- 5.1.2. Services
- 5.2. Market Analysis, Insights and Forecast - by Deployment
- 5.2.1. On-Cloud
- 5.2.2. On-Premise
- 5.3. Market Analysis, Insights and Forecast - by Solutions
- 5.3.1. Bill Cycle Optimization
- 5.3.2. Billing Account Management
- 5.3.3. Automated Invoice and Bill Generation
- 5.3.4. Payment and Collection
- 5.3.5. Customer Relationship Management
- 5.4. Market Analysis, Insights and Forecast - by Region
- 5.4.1. North America
- 5.4.2. Europe
- 5.4.3. Asia Pacific
- 5.4.4. Latin America
- 5.4.5. Middle East and Africa
- 5.1. Market Analysis, Insights and Forecast - by Component
- 6. North America Convergent Billing Industry Analysis, Insights and Forecast, 2019-2031
- 6.1. Market Analysis, Insights and Forecast - by Component
- 6.1.1. Solution
- 6.1.2. Services
- 6.2. Market Analysis, Insights and Forecast - by Deployment
- 6.2.1. On-Cloud
- 6.2.2. On-Premise
- 6.3. Market Analysis, Insights and Forecast - by Solutions
- 6.3.1. Bill Cycle Optimization
- 6.3.2. Billing Account Management
- 6.3.3. Automated Invoice and Bill Generation
- 6.3.4. Payment and Collection
- 6.3.5. Customer Relationship Management
- 6.1. Market Analysis, Insights and Forecast - by Component
- 7. Europe Convergent Billing Industry Analysis, Insights and Forecast, 2019-2031
- 7.1. Market Analysis, Insights and Forecast - by Component
- 7.1.1. Solution
- 7.1.2. Services
- 7.2. Market Analysis, Insights and Forecast - by Deployment
- 7.2.1. On-Cloud
- 7.2.2. On-Premise
- 7.3. Market Analysis, Insights and Forecast - by Solutions
- 7.3.1. Bill Cycle Optimization
- 7.3.2. Billing Account Management
- 7.3.3. Automated Invoice and Bill Generation
- 7.3.4. Payment and Collection
- 7.3.5. Customer Relationship Management
- 7.1. Market Analysis, Insights and Forecast - by Component
- 8. Asia Pacific Convergent Billing Industry Analysis, Insights and Forecast, 2019-2031
- 8.1. Market Analysis, Insights and Forecast - by Component
- 8.1.1. Solution
- 8.1.2. Services
- 8.2. Market Analysis, Insights and Forecast - by Deployment
- 8.2.1. On-Cloud
- 8.2.2. On-Premise
- 8.3. Market Analysis, Insights and Forecast - by Solutions
- 8.3.1. Bill Cycle Optimization
- 8.3.2. Billing Account Management
- 8.3.3. Automated Invoice and Bill Generation
- 8.3.4. Payment and Collection
- 8.3.5. Customer Relationship Management
- 8.1. Market Analysis, Insights and Forecast - by Component
- 9. Latin America Convergent Billing Industry Analysis, Insights and Forecast, 2019-2031
- 9.1. Market Analysis, Insights and Forecast - by Component
- 9.1.1. Solution
- 9.1.2. Services
- 9.2. Market Analysis, Insights and Forecast - by Deployment
- 9.2.1. On-Cloud
- 9.2.2. On-Premise
- 9.3. Market Analysis, Insights and Forecast - by Solutions
- 9.3.1. Bill Cycle Optimization
- 9.3.2. Billing Account Management
- 9.3.3. Automated Invoice and Bill Generation
- 9.3.4. Payment and Collection
- 9.3.5. Customer Relationship Management
- 9.1. Market Analysis, Insights and Forecast - by Component
- 10. Middle East and Africa Convergent Billing Industry Analysis, Insights and Forecast, 2019-2031
- 10.1. Market Analysis, Insights and Forecast - by Component
- 10.1.1. Solution
- 10.1.2. Services
- 10.2. Market Analysis, Insights and Forecast - by Deployment
- 10.2.1. On-Cloud
- 10.2.2. On-Premise
- 10.3. Market Analysis, Insights and Forecast - by Solutions
- 10.3.1. Bill Cycle Optimization
- 10.3.2. Billing Account Management
- 10.3.3. Automated Invoice and Bill Generation
- 10.3.4. Payment and Collection
- 10.3.5. Customer Relationship Management
- 10.1. Market Analysis, Insights and Forecast - by Component
- 11. North America Convergent Billing Industry Analysis, Insights and Forecast, 2019-2031
- 11.1. Market Analysis, Insights and Forecast - By Country/Sub-region
- 11.1.1 United States
- 11.1.2 Canada
- 11.1.3 Mexico
- 12. Europe Convergent Billing Industry Analysis, Insights and Forecast, 2019-2031
- 12.1. Market Analysis, Insights and Forecast - By Country/Sub-region
- 12.1.1 Germany
- 12.1.2 United Kingdom
- 12.1.3 France
- 12.1.4 Spain
- 12.1.5 Italy
- 12.1.6 Spain
- 12.1.7 Belgium
- 12.1.8 Netherland
- 12.1.9 Nordics
- 12.1.10 Rest of Europe
- 13. Asia Pacific Convergent Billing Industry Analysis, Insights and Forecast, 2019-2031
- 13.1. Market Analysis, Insights and Forecast - By Country/Sub-region
- 13.1.1 China
- 13.1.2 Japan
- 13.1.3 India
- 13.1.4 South Korea
- 13.1.5 Southeast Asia
- 13.1.6 Australia
- 13.1.7 Indonesia
- 13.1.8 Phillipes
- 13.1.9 Singapore
- 13.1.10 Thailandc
- 13.1.11 Rest of Asia Pacific
- 14. South America Convergent Billing Industry Analysis, Insights and Forecast, 2019-2031
- 14.1. Market Analysis, Insights and Forecast - By Country/Sub-region
- 14.1.1 Brazil
- 14.1.2 Argentina
- 14.1.3 Peru
- 14.1.4 Chile
- 14.1.5 Colombia
- 14.1.6 Ecuador
- 14.1.7 Venezuela
- 14.1.8 Rest of South America
- 15. North America Convergent Billing Industry Analysis, Insights and Forecast, 2019-2031
- 15.1. Market Analysis, Insights and Forecast - By Country/Sub-region
- 15.1.1 United States
- 15.1.2 Canada
- 15.1.3 Mexico
- 16. MEA Convergent Billing Industry Analysis, Insights and Forecast, 2019-2031
- 16.1. Market Analysis, Insights and Forecast - By Country/Sub-region
- 16.1.1 United Arab Emirates
- 16.1.2 Saudi Arabia
- 16.1.3 South Africa
- 16.1.4 Rest of Middle East and Africa
- 17. Competitive Analysis
- 17.1. Global Market Share Analysis 2024
- 17.2. Company Profiles
- 17.2.1 Amdocs Inc
- 17.2.1.1. Overview
- 17.2.1.2. Products
- 17.2.1.3. SWOT Analysis
- 17.2.1.4. Recent Developments
- 17.2.1.5. Financials (Based on Availability)
- 17.2.2 IBM Corporation
- 17.2.2.1. Overview
- 17.2.2.2. Products
- 17.2.2.3. SWOT Analysis
- 17.2.2.4. Recent Developments
- 17.2.2.5. Financials (Based on Availability)
- 17.2.3 Telefonaktiebolaget LM Ericsson
- 17.2.3.1. Overview
- 17.2.3.2. Products
- 17.2.3.3. SWOT Analysis
- 17.2.3.4. Recent Developments
- 17.2.3.5. Financials (Based on Availability)
- 17.2.4 CSG Systems International Inc
- 17.2.4.1. Overview
- 17.2.4.2. Products
- 17.2.4.3. SWOT Analysis
- 17.2.4.4. Recent Developments
- 17.2.4.5. Financials (Based on Availability)
- 17.2.5 Huawei Technologies Co Ltd
- 17.2.5.1. Overview
- 17.2.5.2. Products
- 17.2.5.3. SWOT Analysis
- 17.2.5.4. Recent Developments
- 17.2.5.5. Financials (Based on Availability)
- 17.2.6 Oracle Corporation
- 17.2.6.1. Overview
- 17.2.6.2. Products
- 17.2.6.3. SWOT Analysis
- 17.2.6.4. Recent Developments
- 17.2.6.5. Financials (Based on Availability)
- 17.2.7 Comarch SA
- 17.2.7.1. Overview
- 17.2.7.2. Products
- 17.2.7.3. SWOT Analysis
- 17.2.7.4. Recent Developments
- 17.2.7.5. Financials (Based on Availability)
- 17.2.8 Nexign JSC
- 17.2.8.1. Overview
- 17.2.8.2. Products
- 17.2.8.3. SWOT Analysis
- 17.2.8.4. Recent Developments
- 17.2.8.5. Financials (Based on Availability)
- 17.2.9 Formula Telecom Solutions Ltd
- 17.2.9.1. Overview
- 17.2.9.2. Products
- 17.2.9.3. SWOT Analysis
- 17.2.9.4. Recent Developments
- 17.2.9.5. Financials (Based on Availability)
- 17.2.1 Amdocs Inc
List of Figures
- Figure 1: Global Convergent Billing Industry Revenue Breakdown (Million, %) by Region 2024 & 2032
- Figure 2: North America Convergent Billing Industry Revenue (Million), by Country 2024 & 2032
- Figure 3: North America Convergent Billing Industry Revenue Share (%), by Country 2024 & 2032
- Figure 4: Europe Convergent Billing Industry Revenue (Million), by Country 2024 & 2032
- Figure 5: Europe Convergent Billing Industry Revenue Share (%), by Country 2024 & 2032
- Figure 6: Asia Pacific Convergent Billing Industry Revenue (Million), by Country 2024 & 2032
- Figure 7: Asia Pacific Convergent Billing Industry Revenue Share (%), by Country 2024 & 2032
- Figure 8: South America Convergent Billing Industry Revenue (Million), by Country 2024 & 2032
- Figure 9: South America Convergent Billing Industry Revenue Share (%), by Country 2024 & 2032
- Figure 10: North America Convergent Billing Industry Revenue (Million), by Country 2024 & 2032
- Figure 11: North America Convergent Billing Industry Revenue Share (%), by Country 2024 & 2032
- Figure 12: MEA Convergent Billing Industry Revenue (Million), by Country 2024 & 2032
- Figure 13: MEA Convergent Billing Industry Revenue Share (%), by Country 2024 & 2032
- Figure 14: North America Convergent Billing Industry Revenue (Million), by Component 2024 & 2032
- Figure 15: North America Convergent Billing Industry Revenue Share (%), by Component 2024 & 2032
- Figure 16: North America Convergent Billing Industry Revenue (Million), by Deployment 2024 & 2032
- Figure 17: North America Convergent Billing Industry Revenue Share (%), by Deployment 2024 & 2032
- Figure 18: North America Convergent Billing Industry Revenue (Million), by Solutions 2024 & 2032
- Figure 19: North America Convergent Billing Industry Revenue Share (%), by Solutions 2024 & 2032
- Figure 20: North America Convergent Billing Industry Revenue (Million), by Country 2024 & 2032
- Figure 21: North America Convergent Billing Industry Revenue Share (%), by Country 2024 & 2032
- Figure 22: Europe Convergent Billing Industry Revenue (Million), by Component 2024 & 2032
- Figure 23: Europe Convergent Billing Industry Revenue Share (%), by Component 2024 & 2032
- Figure 24: Europe Convergent Billing Industry Revenue (Million), by Deployment 2024 & 2032
- Figure 25: Europe Convergent Billing Industry Revenue Share (%), by Deployment 2024 & 2032
- Figure 26: Europe Convergent Billing Industry Revenue (Million), by Solutions 2024 & 2032
- Figure 27: Europe Convergent Billing Industry Revenue Share (%), by Solutions 2024 & 2032
- Figure 28: Europe Convergent Billing Industry Revenue (Million), by Country 2024 & 2032
- Figure 29: Europe Convergent Billing Industry Revenue Share (%), by Country 2024 & 2032
- Figure 30: Asia Pacific Convergent Billing Industry Revenue (Million), by Component 2024 & 2032
- Figure 31: Asia Pacific Convergent Billing Industry Revenue Share (%), by Component 2024 & 2032
- Figure 32: Asia Pacific Convergent Billing Industry Revenue (Million), by Deployment 2024 & 2032
- Figure 33: Asia Pacific Convergent Billing Industry Revenue Share (%), by Deployment 2024 & 2032
- Figure 34: Asia Pacific Convergent Billing Industry Revenue (Million), by Solutions 2024 & 2032
- Figure 35: Asia Pacific Convergent Billing Industry Revenue Share (%), by Solutions 2024 & 2032
- Figure 36: Asia Pacific Convergent Billing Industry Revenue (Million), by Country 2024 & 2032
- Figure 37: Asia Pacific Convergent Billing Industry Revenue Share (%), by Country 2024 & 2032
- Figure 38: Latin America Convergent Billing Industry Revenue (Million), by Component 2024 & 2032
- Figure 39: Latin America Convergent Billing Industry Revenue Share (%), by Component 2024 & 2032
- Figure 40: Latin America Convergent Billing Industry Revenue (Million), by Deployment 2024 & 2032
- Figure 41: Latin America Convergent Billing Industry Revenue Share (%), by Deployment 2024 & 2032
- Figure 42: Latin America Convergent Billing Industry Revenue (Million), by Solutions 2024 & 2032
- Figure 43: Latin America Convergent Billing Industry Revenue Share (%), by Solutions 2024 & 2032
- Figure 44: Latin America Convergent Billing Industry Revenue (Million), by Country 2024 & 2032
- Figure 45: Latin America Convergent Billing Industry Revenue Share (%), by Country 2024 & 2032
- Figure 46: Middle East and Africa Convergent Billing Industry Revenue (Million), by Component 2024 & 2032
- Figure 47: Middle East and Africa Convergent Billing Industry Revenue Share (%), by Component 2024 & 2032
- Figure 48: Middle East and Africa Convergent Billing Industry Revenue (Million), by Deployment 2024 & 2032
- Figure 49: Middle East and Africa Convergent Billing Industry Revenue Share (%), by Deployment 2024 & 2032
- Figure 50: Middle East and Africa Convergent Billing Industry Revenue (Million), by Solutions 2024 & 2032
- Figure 51: Middle East and Africa Convergent Billing Industry Revenue Share (%), by Solutions 2024 & 2032
- Figure 52: Middle East and Africa Convergent Billing Industry Revenue (Million), by Country 2024 & 2032
- Figure 53: Middle East and Africa Convergent Billing Industry Revenue Share (%), by Country 2024 & 2032
List of Tables
- Table 1: Global Convergent Billing Industry Revenue Million Forecast, by Region 2019 & 2032
- Table 2: Global Convergent Billing Industry Revenue Million Forecast, by Component 2019 & 2032
- Table 3: Global Convergent Billing Industry Revenue Million Forecast, by Deployment 2019 & 2032
- Table 4: Global Convergent Billing Industry Revenue Million Forecast, by Solutions 2019 & 2032
- Table 5: Global Convergent Billing Industry Revenue Million Forecast, by Region 2019 & 2032
- Table 6: Global Convergent Billing Industry Revenue Million Forecast, by Country 2019 & 2032
- Table 7: United States Convergent Billing Industry Revenue (Million) Forecast, by Application 2019 & 2032
- Table 8: Canada Convergent Billing Industry Revenue (Million) Forecast, by Application 2019 & 2032
- Table 9: Mexico Convergent Billing Industry Revenue (Million) Forecast, by Application 2019 & 2032
- Table 10: Global Convergent Billing Industry Revenue Million Forecast, by Country 2019 & 2032
- Table 11: Germany Convergent Billing Industry Revenue (Million) Forecast, by Application 2019 & 2032
- Table 12: United Kingdom Convergent Billing Industry Revenue (Million) Forecast, by Application 2019 & 2032
- Table 13: France Convergent Billing Industry Revenue (Million) Forecast, by Application 2019 & 2032
- Table 14: Spain Convergent Billing Industry Revenue (Million) Forecast, by Application 2019 & 2032
- Table 15: Italy Convergent Billing Industry Revenue (Million) Forecast, by Application 2019 & 2032
- Table 16: Spain Convergent Billing Industry Revenue (Million) Forecast, by Application 2019 & 2032
- Table 17: Belgium Convergent Billing Industry Revenue (Million) Forecast, by Application 2019 & 2032
- Table 18: Netherland Convergent Billing Industry Revenue (Million) Forecast, by Application 2019 & 2032
- Table 19: Nordics Convergent Billing Industry Revenue (Million) Forecast, by Application 2019 & 2032
- Table 20: Rest of Europe Convergent Billing Industry Revenue (Million) Forecast, by Application 2019 & 2032
- Table 21: Global Convergent Billing Industry Revenue Million Forecast, by Country 2019 & 2032
- Table 22: China Convergent Billing Industry Revenue (Million) Forecast, by Application 2019 & 2032
- Table 23: Japan Convergent Billing Industry Revenue (Million) Forecast, by Application 2019 & 2032
- Table 24: India Convergent Billing Industry Revenue (Million) Forecast, by Application 2019 & 2032
- Table 25: South Korea Convergent Billing Industry Revenue (Million) Forecast, by Application 2019 & 2032
- Table 26: Southeast Asia Convergent Billing Industry Revenue (Million) Forecast, by Application 2019 & 2032
- Table 27: Australia Convergent Billing Industry Revenue (Million) Forecast, by Application 2019 & 2032
- Table 28: Indonesia Convergent Billing Industry Revenue (Million) Forecast, by Application 2019 & 2032
- Table 29: Phillipes Convergent Billing Industry Revenue (Million) Forecast, by Application 2019 & 2032
- Table 30: Singapore Convergent Billing Industry Revenue (Million) Forecast, by Application 2019 & 2032
- Table 31: Thailandc Convergent Billing Industry Revenue (Million) Forecast, by Application 2019 & 2032
- Table 32: Rest of Asia Pacific Convergent Billing Industry Revenue (Million) Forecast, by Application 2019 & 2032
- Table 33: Global Convergent Billing Industry Revenue Million Forecast, by Country 2019 & 2032
- Table 34: Brazil Convergent Billing Industry Revenue (Million) Forecast, by Application 2019 & 2032
- Table 35: Argentina Convergent Billing Industry Revenue (Million) Forecast, by Application 2019 & 2032
- Table 36: Peru Convergent Billing Industry Revenue (Million) Forecast, by Application 2019 & 2032
- Table 37: Chile Convergent Billing Industry Revenue (Million) Forecast, by Application 2019 & 2032
- Table 38: Colombia Convergent Billing Industry Revenue (Million) Forecast, by Application 2019 & 2032
- Table 39: Ecuador Convergent Billing Industry Revenue (Million) Forecast, by Application 2019 & 2032
- Table 40: Venezuela Convergent Billing Industry Revenue (Million) Forecast, by Application 2019 & 2032
- Table 41: Rest of South America Convergent Billing Industry Revenue (Million) Forecast, by Application 2019 & 2032
- Table 42: Global Convergent Billing Industry Revenue Million Forecast, by Country 2019 & 2032
- Table 43: United States Convergent Billing Industry Revenue (Million) Forecast, by Application 2019 & 2032
- Table 44: Canada Convergent Billing Industry Revenue (Million) Forecast, by Application 2019 & 2032
- Table 45: Mexico Convergent Billing Industry Revenue (Million) Forecast, by Application 2019 & 2032
- Table 46: Global Convergent Billing Industry Revenue Million Forecast, by Country 2019 & 2032
- Table 47: United Arab Emirates Convergent Billing Industry Revenue (Million) Forecast, by Application 2019 & 2032
- Table 48: Saudi Arabia Convergent Billing Industry Revenue (Million) Forecast, by Application 2019 & 2032
- Table 49: South Africa Convergent Billing Industry Revenue (Million) Forecast, by Application 2019 & 2032
- Table 50: Rest of Middle East and Africa Convergent Billing Industry Revenue (Million) Forecast, by Application 2019 & 2032
- Table 51: Global Convergent Billing Industry Revenue Million Forecast, by Component 2019 & 2032
- Table 52: Global Convergent Billing Industry Revenue Million Forecast, by Deployment 2019 & 2032
- Table 53: Global Convergent Billing Industry Revenue Million Forecast, by Solutions 2019 & 2032
- Table 54: Global Convergent Billing Industry Revenue Million Forecast, by Country 2019 & 2032
- Table 55: Global Convergent Billing Industry Revenue Million Forecast, by Component 2019 & 2032
- Table 56: Global Convergent Billing Industry Revenue Million Forecast, by Deployment 2019 & 2032
- Table 57: Global Convergent Billing Industry Revenue Million Forecast, by Solutions 2019 & 2032
- Table 58: Global Convergent Billing Industry Revenue Million Forecast, by Country 2019 & 2032
- Table 59: Global Convergent Billing Industry Revenue Million Forecast, by Component 2019 & 2032
- Table 60: Global Convergent Billing Industry Revenue Million Forecast, by Deployment 2019 & 2032
- Table 61: Global Convergent Billing Industry Revenue Million Forecast, by Solutions 2019 & 2032
- Table 62: Global Convergent Billing Industry Revenue Million Forecast, by Country 2019 & 2032
- Table 63: Global Convergent Billing Industry Revenue Million Forecast, by Component 2019 & 2032
- Table 64: Global Convergent Billing Industry Revenue Million Forecast, by Deployment 2019 & 2032
- Table 65: Global Convergent Billing Industry Revenue Million Forecast, by Solutions 2019 & 2032
- Table 66: Global Convergent Billing Industry Revenue Million Forecast, by Country 2019 & 2032
- Table 67: Global Convergent Billing Industry Revenue Million Forecast, by Component 2019 & 2032
- Table 68: Global Convergent Billing Industry Revenue Million Forecast, by Deployment 2019 & 2032
- Table 69: Global Convergent Billing Industry Revenue Million Forecast, by Solutions 2019 & 2032
- Table 70: Global Convergent Billing Industry Revenue Million Forecast, by Country 2019 & 2032
Frequently Asked Questions
1. What is the projected Compound Annual Growth Rate (CAGR) of the Convergent Billing Industry?
The projected CAGR is approximately 22.00%.
2. Which companies are prominent players in the Convergent Billing Industry?
Key companies in the market include Amdocs Inc, IBM Corporation, Telefonaktiebolaget LM Ericsson, CSG Systems International Inc, Huawei Technologies Co Ltd, Oracle Corporation, Comarch SA, Nexign JSC, Formula Telecom Solutions Ltd.
3. What are the main segments of the Convergent Billing Industry?
The market segments include Component, Deployment, Solutions.
4. Can you provide details about the market size?
The market size is estimated to be USD XX Million as of 2022.
5. What are some drivers contributing to market growth?
; Digitization of the Telecom Sector; Increasing Complexity of New Service Architecture and Increasing Demand for Unified Services; Increasing Focus on Customer Satisfaction.
6. What are the notable trends driving market growth?
Cloud-Based Deployment is Expected to Spur Growth.
7. Are there any restraints impacting market growth?
; The Inclination Towards Traditional Billing Systems.
8. Can you provide examples of recent developments in the market?
N/A
9. What pricing options are available for accessing the report?
Pricing options include single-user, multi-user, and enterprise licenses priced at USD 4750, USD 5250, and USD 8750 respectively.
10. Is the market size provided in terms of value or volume?
The market size is provided in terms of value, measured in Million.
11. Are there any specific market keywords associated with the report?
Yes, the market keyword associated with the report is "Convergent Billing Industry," which aids in identifying and referencing the specific market segment covered.
12. How do I determine which pricing option suits my needs best?
The pricing options vary based on user requirements and access needs. Individual users may opt for single-user licenses, while businesses requiring broader access may choose multi-user or enterprise licenses for cost-effective access to the report.
13. Are there any additional resources or data provided in the Convergent Billing Industry report?
While the report offers comprehensive insights, it's advisable to review the specific contents or supplementary materials provided to ascertain if additional resources or data are available.
14. How can I stay updated on further developments or reports in the Convergent Billing Industry?
To stay informed about further developments, trends, and reports in the Convergent Billing Industry, consider subscribing to industry newsletters, following relevant companies and organizations, or regularly checking reputable industry news sources and publications.
Methodology
Step 1 - Identification of Relevant Samples Size from Population Database


Step 2 - Approaches for Defining Global Market Size (Value, Volume* & Price*)

Note*: In applicable scenarios
Step 3 - Data Sources
Primary Research
- Web Analytics
- Survey Reports
- Research Institute
- Latest Research Reports
- Opinion Leaders
Secondary Research
- Annual Reports
- White Paper
- Latest Press Release
- Industry Association
- Paid Database
- Investor Presentations

Step 4 - Data Triangulation
Involves using different sources of information in order to increase the validity of a study
These sources are likely to be stakeholders in a program - participants, other researchers, program staff, other community members, and so on.
Then we put all data in single framework & apply various statistical tools to find out the dynamic on the market.
During the analysis stage, feedback from the stakeholder groups would be compared to determine areas of agreement as well as areas of divergence
