

Key Insights
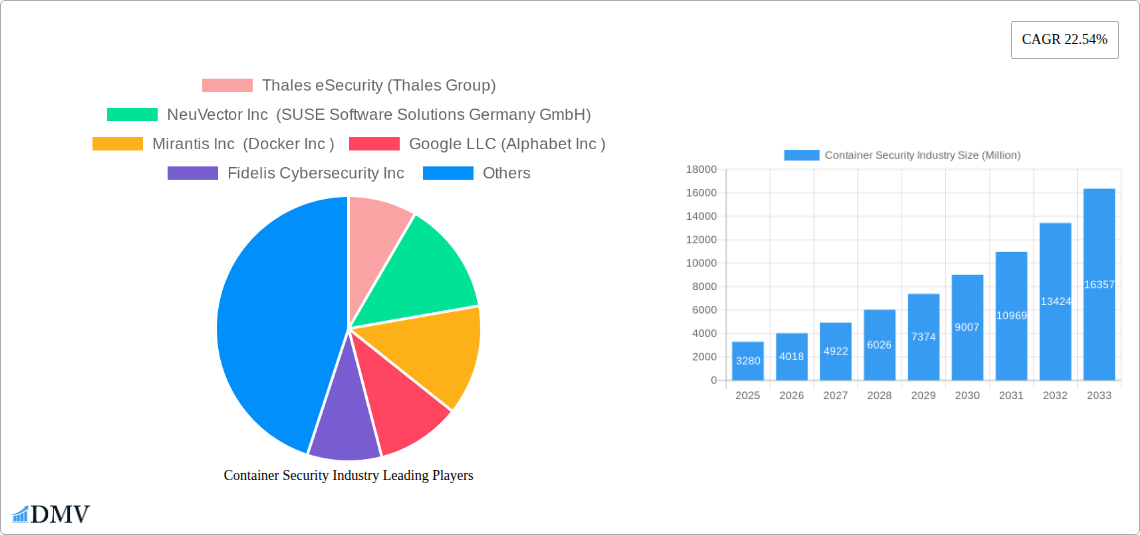
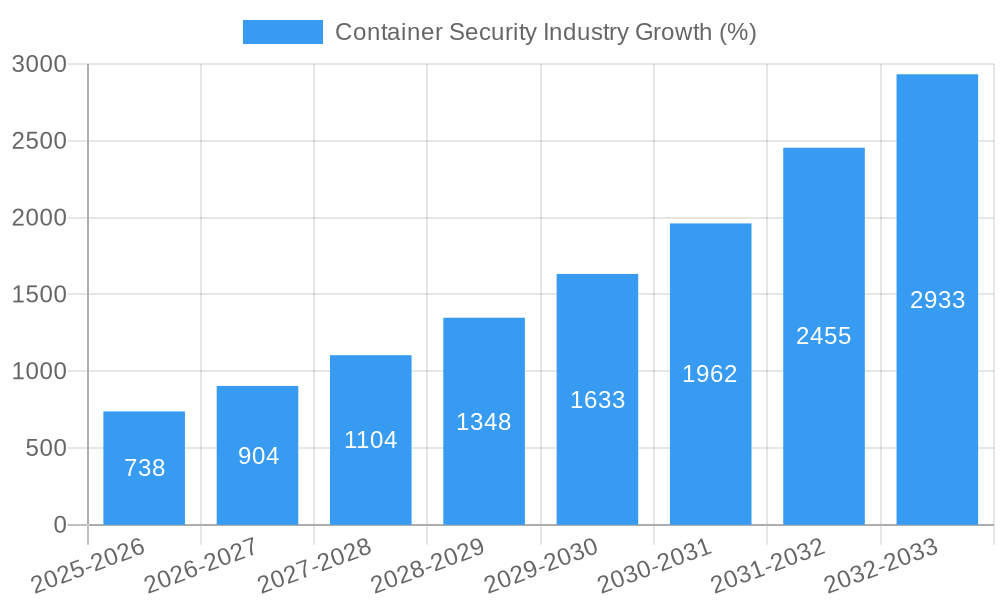
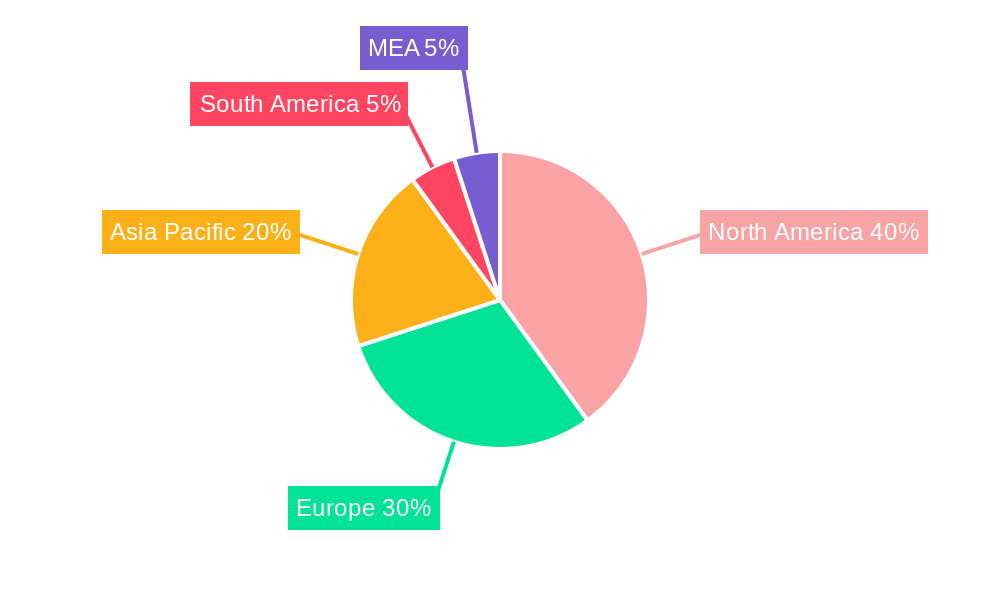
The container security market is experiencing robust growth, projected to reach $3.28 billion in 2025 and exhibiting a Compound Annual Growth Rate (CAGR) of 22.54% from 2025 to 2033. This surge is driven by the increasing adoption of containerization technologies in cloud-native applications and microservices architectures across diverse industries. The rising frequency and sophistication of cyberattacks targeting containerized environments necessitate robust security measures, fueling market expansion. Key growth drivers include the need for improved application security, enhanced compliance with industry regulations (like GDPR and HIPAA), and the demand for automated security solutions that integrate seamlessly with DevOps workflows. The market is segmented by organization size (large enterprises leading adoption due to greater resources and complex infrastructures), deployment (cloud-based solutions gaining traction for scalability and cost-effectiveness), and end-user industry (with IT & ITES, BFSI, and Retail sectors showing strong demand). Competition is intense, with established players like Thales, Red Hat, and Palo Alto Networks vying for market share alongside agile startups specializing in container security. Geographic expansion is also a significant factor, with North America currently holding a major market share, but the Asia-Pacific region showing significant growth potential due to rapid digital transformation initiatives.
The market's future trajectory will be shaped by several factors. Advancements in artificial intelligence (AI) and machine learning (ML) will enable more sophisticated threat detection and response capabilities within container security solutions. The increasing adoption of serverless computing and edge computing will create new security challenges and opportunities. Furthermore, the ongoing evolution of container orchestration platforms like Kubernetes will necessitate continuous adaptation and innovation within the security landscape. The focus will shift toward more comprehensive solutions addressing the entire container lifecycle, from image creation to runtime protection. The development of standardized security frameworks and best practices will also play a crucial role in shaping the market's growth and adoption. Overall, the container security market is poised for continued expansion, driven by the intrinsic security challenges inherent in containerized environments and the escalating need for robust, adaptable security solutions.
Container Security Industry: A Comprehensive Market Report (2019-2033)
This insightful report provides a comprehensive analysis of the Container Security industry, projecting a market value of $XX Million by 2033. The study covers the period 2019-2033, with 2025 as the base and estimated year, and a forecast period of 2025-2033. It delves into market dynamics, technological advancements, competitive landscapes, and future growth potential, offering crucial insights for stakeholders across the value chain.
Container Security Industry Market Composition & Trends
This section evaluates the container security market's competitive intensity, analyzing market share distribution amongst key players like Thales eSecurity (Thales Group), NeuVector Inc (SUSE Software Solutions Germany GmbH), Mirantis Inc (Docker Inc), Google LLC (Alphabet Inc), Fidelis Cybersecurity Inc, Red Hat Inc, Trend Micro Incorporated, Rapid7 Inc, Qualys Inc, Aqua Security Software Ltd, and Palo Alto Networks Inc. We examine innovation drivers, regulatory changes impacting the market, the presence of substitute products, and the evolving profiles of end-users. The report also includes an analysis of M&A activity, detailing deal values (estimated at $XX Million in total during the historical period) and their impact on market concentration.
- Market Share Distribution: Detailed breakdown of market share held by leading vendors in 2024 and projected for 2033.
- M&A Activity Analysis: Review of significant mergers and acquisitions, including deal size and strategic implications.
- Innovation Catalysts: Identification of key technological advancements and their impact on market growth.
- Regulatory Landscape: Analysis of existing and upcoming regulations and their effects on the industry.
- Substitute Products: Examination of alternative solutions and their potential impact on market share.
- End-User Profiles: Detailed segmentation of end-users by industry and organization size, including their adoption rates and preferences.
Container Security Industry Evolution
This section provides an in-depth analysis of the container security market's growth trajectory from 2019 to 2033. We examine the historical period (2019-2024), highlighting key milestones and growth rates (averaging XX% annually). The report will further analyze the technological innovations driving market expansion, such as advancements in container orchestration, cloud-native security, and AI-powered threat detection. Furthermore, we explore the shifting consumer demands and preferences shaping the market, including the increasing adoption of cloud-native applications and the growing need for comprehensive security solutions. The projected Compound Annual Growth Rate (CAGR) for the forecast period (2025-2033) is estimated at XX%.
Leading Regions, Countries, or Segments in Container Security Industry
This section identifies the leading regions, countries, and market segments within the container security industry. Dominant segments are analyzed, considering factors driving their growth.
- By Organization Size:
- Large Enterprises: Key drivers include increased investment in security infrastructure, stringent regulatory compliance requirements, and the adoption of complex containerized applications.
- Small & Medium Enterprises (SMEs): Drivers include rising awareness of container security threats, the increasing affordability of security solutions, and the growing adoption of cloud services.
- By Deployment:
- Cloud-based: Growth is driven by the increasing adoption of cloud-native applications, improved scalability and flexibility, and the pay-as-you-go model.
- On-premise: This segment is expected to witness slower growth compared to cloud-based, primarily due to higher upfront costs and limitations in scalability.
- By End-user Industry: The report analyzes growth across IT & ITES, BFSI, Retail, Healthcare, Industrial, and Other End-user Industries, pinpointing the specific factors driving adoption in each. For example, the BFSI sector's adoption is driven by stringent regulatory compliance and the need to protect sensitive financial data.
Container Security Industry Product Innovations
Recent years have witnessed significant product innovations in container security, including the emergence of cloud-native application protection platforms (CNAPPs) that offer comprehensive security across the entire application lifecycle. These platforms integrate container image scanning, runtime protection, and vulnerability management capabilities, providing organizations with a unified security posture. Other key innovations include AI-powered threat detection systems and automated security orchestration tools. These advances have improved the efficiency and effectiveness of container security solutions, leading to enhanced protection against advanced threats.
Propelling Factors for Container Security Industry Growth
Several factors are driving the growth of the container security market. These include the widespread adoption of containerization technologies, the increasing prevalence of cloud-native applications, and the growing number of cybersecurity threats targeting containerized workloads. Stringent regulatory compliance requirements are also pushing organizations to invest in robust container security solutions. Furthermore, the rising awareness of the importance of container security among businesses is creating significant demand for these solutions.
Obstacles in the Container Security Industry Market
Despite the growth potential, the container security market faces challenges, including the complexity of securing containerized environments, the scarcity of skilled cybersecurity professionals, and the emergence of sophisticated and evolving attack techniques. The high cost of implementing comprehensive security solutions can also hinder adoption, especially for smaller organizations. Furthermore, maintaining the security of the supply chain for container images and related components poses a significant obstacle.
Future Opportunities in Container Security Industry
Future opportunities for growth in the container security market include the expansion into new verticals like IoT and edge computing, the development of more advanced threat detection and prevention technologies (e.g., utilizing AI/ML), and the increased integration of security solutions into DevOps workflows. The demand for improved security automation and the rise of serverless computing architectures also present significant growth opportunities.
Major Players in the Container Security Industry Ecosystem
- Thales eSecurity (Thales Group)
- NeuVector Inc (SUSE Software Solutions Germany GmbH)
- Mirantis Inc (Docker Inc)
- Google LLC (Alphabet Inc)
- Fidelis Cybersecurity Inc
- Red Hat Inc
- Trend Micro Incorporated
- Rapid7 Inc
- Qualys Inc
- Aqua Security Software Ltd
- Palo Alto Networks Inc
Key Developments in Container Security Industry
- October 2022: Veracode launched its Container Security service, enhancing its Continuous Software Security Platform with vulnerability scanning, secure configuration, and secrets management for container images. This expands its market reach and addresses a significant customer need.
- August 2022: Tigera's Calico Cloud introduced GA features enhancing container security with runtime malware protection, image assurance, workload visibility, and admission control policies. This strengthens its CNAPP offering and provides comprehensive security capabilities.
Strategic Container Security Industry Market Forecast
The container security market is poised for significant growth, fueled by increasing adoption of cloud-native applications, expanding attack surfaces, and stricter regulatory mandates. The ongoing innovation in container security technologies, coupled with the rising awareness among organizations of the importance of robust security measures, will further accelerate market expansion throughout the forecast period. The market is expected to witness substantial growth, driven by the increasing adoption of containers across various industries and the continuous evolution of threat landscapes.
Container Security Industry Segmentation
-
1. Organisation Size
- 1.1. Large Enterprises
- 1.2. Small & Medium Enterprises
-
2. Deployment
- 2.1. Cloud-based
- 2.2. On-premise
-
3. End-user Industry
- 3.1. IT & ITES
- 3.2. BFSI
- 3.3. Retail
- 3.4. Healthcare
- 3.5. Industrial
- 3.6. Other End-user Industries
Container Security Industry Segmentation By Geography
-
1. North America
- 1.1. United States
- 1.2. Canada
-
2. Europe
- 2.1. United Kingdom
- 2.2. Germany
- 2.3. Rest of Europe
-
3. Asia Pacific
- 3.1. China
- 3.2. Japan
- 3.3. Rest of Asia Pacific
-
4. Rest of the World
- 4.1. Latin America
- 4.2. Middle East
Container Security Industry REPORT HIGHLIGHTS
| Aspects | Details |
|---|---|
| Study Period | 2019-2033 |
| Base Year | 2024 |
| Estimated Year | 2025 |
| Forecast Period | 2025-2033 |
| Historical Period | 2019-2024 |
| Growth Rate | CAGR of 22.54% from 2019-2033 |
| Segmentation |
|
Table of Contents
- 1. Introduction
- 1.1. Research Scope
- 1.2. Market Segmentation
- 1.3. Research Methodology
- 1.4. Definitions and Assumptions
- 2. Executive Summary
- 2.1. Introduction
- 3. Market Dynamics
- 3.1. Introduction
- 3.2. Market Drivers
- 3.2.1. Rising Adoption of the Hybrid Cloud Technology Applications; Growing Vulnerability Concern across the Container Architecture
- 3.3. Market Restrains
- 3.3.1. Complexity in Managing the Cloud Environments; Inadequate Budgets in SMEs and Lack of Technical Expertise
- 3.4. Market Trends
- 3.4.1. Rising Adoption of the Hybrid Cloud Technology Applications may Drive the Market Growth
- 4. Market Factor Analysis
- 4.1. Porters Five Forces
- 4.2. Supply/Value Chain
- 4.3. PESTEL analysis
- 4.4. Market Entropy
- 4.5. Patent/Trademark Analysis
- 5. Global Container Security Industry Analysis, Insights and Forecast, 2019-2031
- 5.1. Market Analysis, Insights and Forecast - by Organisation Size
- 5.1.1. Large Enterprises
- 5.1.2. Small & Medium Enterprises
- 5.2. Market Analysis, Insights and Forecast - by Deployment
- 5.2.1. Cloud-based
- 5.2.2. On-premise
- 5.3. Market Analysis, Insights and Forecast - by End-user Industry
- 5.3.1. IT & ITES
- 5.3.2. BFSI
- 5.3.3. Retail
- 5.3.4. Healthcare
- 5.3.5. Industrial
- 5.3.6. Other End-user Industries
- 5.4. Market Analysis, Insights and Forecast - by Region
- 5.4.1. North America
- 5.4.2. Europe
- 5.4.3. Asia Pacific
- 5.4.4. Rest of the World
- 5.1. Market Analysis, Insights and Forecast - by Organisation Size
- 6. North America Container Security Industry Analysis, Insights and Forecast, 2019-2031
- 6.1. Market Analysis, Insights and Forecast - by Organisation Size
- 6.1.1. Large Enterprises
- 6.1.2. Small & Medium Enterprises
- 6.2. Market Analysis, Insights and Forecast - by Deployment
- 6.2.1. Cloud-based
- 6.2.2. On-premise
- 6.3. Market Analysis, Insights and Forecast - by End-user Industry
- 6.3.1. IT & ITES
- 6.3.2. BFSI
- 6.3.3. Retail
- 6.3.4. Healthcare
- 6.3.5. Industrial
- 6.3.6. Other End-user Industries
- 6.1. Market Analysis, Insights and Forecast - by Organisation Size
- 7. Europe Container Security Industry Analysis, Insights and Forecast, 2019-2031
- 7.1. Market Analysis, Insights and Forecast - by Organisation Size
- 7.1.1. Large Enterprises
- 7.1.2. Small & Medium Enterprises
- 7.2. Market Analysis, Insights and Forecast - by Deployment
- 7.2.1. Cloud-based
- 7.2.2. On-premise
- 7.3. Market Analysis, Insights and Forecast - by End-user Industry
- 7.3.1. IT & ITES
- 7.3.2. BFSI
- 7.3.3. Retail
- 7.3.4. Healthcare
- 7.3.5. Industrial
- 7.3.6. Other End-user Industries
- 7.1. Market Analysis, Insights and Forecast - by Organisation Size
- 8. Asia Pacific Container Security Industry Analysis, Insights and Forecast, 2019-2031
- 8.1. Market Analysis, Insights and Forecast - by Organisation Size
- 8.1.1. Large Enterprises
- 8.1.2. Small & Medium Enterprises
- 8.2. Market Analysis, Insights and Forecast - by Deployment
- 8.2.1. Cloud-based
- 8.2.2. On-premise
- 8.3. Market Analysis, Insights and Forecast - by End-user Industry
- 8.3.1. IT & ITES
- 8.3.2. BFSI
- 8.3.3. Retail
- 8.3.4. Healthcare
- 8.3.5. Industrial
- 8.3.6. Other End-user Industries
- 8.1. Market Analysis, Insights and Forecast - by Organisation Size
- 9. Rest of the World Container Security Industry Analysis, Insights and Forecast, 2019-2031
- 9.1. Market Analysis, Insights and Forecast - by Organisation Size
- 9.1.1. Large Enterprises
- 9.1.2. Small & Medium Enterprises
- 9.2. Market Analysis, Insights and Forecast - by Deployment
- 9.2.1. Cloud-based
- 9.2.2. On-premise
- 9.3. Market Analysis, Insights and Forecast - by End-user Industry
- 9.3.1. IT & ITES
- 9.3.2. BFSI
- 9.3.3. Retail
- 9.3.4. Healthcare
- 9.3.5. Industrial
- 9.3.6. Other End-user Industries
- 9.1. Market Analysis, Insights and Forecast - by Organisation Size
- 10. North America Container Security Industry Analysis, Insights and Forecast, 2019-2031
- 10.1. Market Analysis, Insights and Forecast - By Country/Sub-region
- 10.1.1 United States
- 10.1.2 Canada
- 10.1.3 Mexico
- 11. Europe Container Security Industry Analysis, Insights and Forecast, 2019-2031
- 11.1. Market Analysis, Insights and Forecast - By Country/Sub-region
- 11.1.1 Germany
- 11.1.2 United Kingdom
- 11.1.3 France
- 11.1.4 Spain
- 11.1.5 Italy
- 11.1.6 Spain
- 11.1.7 Belgium
- 11.1.8 Netherland
- 11.1.9 Nordics
- 11.1.10 Rest of Europe
- 12. Asia Pacific Container Security Industry Analysis, Insights and Forecast, 2019-2031
- 12.1. Market Analysis, Insights and Forecast - By Country/Sub-region
- 12.1.1 China
- 12.1.2 Japan
- 12.1.3 India
- 12.1.4 South Korea
- 12.1.5 Southeast Asia
- 12.1.6 Australia
- 12.1.7 Indonesia
- 12.1.8 Phillipes
- 12.1.9 Singapore
- 12.1.10 Thailandc
- 12.1.11 Rest of Asia Pacific
- 13. South America Container Security Industry Analysis, Insights and Forecast, 2019-2031
- 13.1. Market Analysis, Insights and Forecast - By Country/Sub-region
- 13.1.1 Brazil
- 13.1.2 Argentina
- 13.1.3 Peru
- 13.1.4 Chile
- 13.1.5 Colombia
- 13.1.6 Ecuador
- 13.1.7 Venezuela
- 13.1.8 Rest of South America
- 14. North America Container Security Industry Analysis, Insights and Forecast, 2019-2031
- 14.1. Market Analysis, Insights and Forecast - By Country/Sub-region
- 14.1.1 United States
- 14.1.2 Canada
- 14.1.3 Mexico
- 15. MEA Container Security Industry Analysis, Insights and Forecast, 2019-2031
- 15.1. Market Analysis, Insights and Forecast - By Country/Sub-region
- 15.1.1 United Arab Emirates
- 15.1.2 Saudi Arabia
- 15.1.3 South Africa
- 15.1.4 Rest of Middle East and Africa
- 16. Competitive Analysis
- 16.1. Global Market Share Analysis 2024
- 16.2. Company Profiles
- 16.2.1 Thales eSecurity (Thales Group)
- 16.2.1.1. Overview
- 16.2.1.2. Products
- 16.2.1.3. SWOT Analysis
- 16.2.1.4. Recent Developments
- 16.2.1.5. Financials (Based on Availability)
- 16.2.2 NeuVector Inc (SUSE Software Solutions Germany GmbH)
- 16.2.2.1. Overview
- 16.2.2.2. Products
- 16.2.2.3. SWOT Analysis
- 16.2.2.4. Recent Developments
- 16.2.2.5. Financials (Based on Availability)
- 16.2.3 Mirantis Inc (Docker Inc )
- 16.2.3.1. Overview
- 16.2.3.2. Products
- 16.2.3.3. SWOT Analysis
- 16.2.3.4. Recent Developments
- 16.2.3.5. Financials (Based on Availability)
- 16.2.4 Google LLC (Alphabet Inc )
- 16.2.4.1. Overview
- 16.2.4.2. Products
- 16.2.4.3. SWOT Analysis
- 16.2.4.4. Recent Developments
- 16.2.4.5. Financials (Based on Availability)
- 16.2.5 Fidelis Cybersecurity Inc
- 16.2.5.1. Overview
- 16.2.5.2. Products
- 16.2.5.3. SWOT Analysis
- 16.2.5.4. Recent Developments
- 16.2.5.5. Financials (Based on Availability)
- 16.2.6 Red Hat Inc
- 16.2.6.1. Overview
- 16.2.6.2. Products
- 16.2.6.3. SWOT Analysis
- 16.2.6.4. Recent Developments
- 16.2.6.5. Financials (Based on Availability)
- 16.2.7 Trend Micro Incorporated
- 16.2.7.1. Overview
- 16.2.7.2. Products
- 16.2.7.3. SWOT Analysis
- 16.2.7.4. Recent Developments
- 16.2.7.5. Financials (Based on Availability)
- 16.2.8 Rapid7 Inc
- 16.2.8.1. Overview
- 16.2.8.2. Products
- 16.2.8.3. SWOT Analysis
- 16.2.8.4. Recent Developments
- 16.2.8.5. Financials (Based on Availability)
- 16.2.9 Qualys Inc
- 16.2.9.1. Overview
- 16.2.9.2. Products
- 16.2.9.3. SWOT Analysis
- 16.2.9.4. Recent Developments
- 16.2.9.5. Financials (Based on Availability)
- 16.2.10 Aqua Security Software Ltd
- 16.2.10.1. Overview
- 16.2.10.2. Products
- 16.2.10.3. SWOT Analysis
- 16.2.10.4. Recent Developments
- 16.2.10.5. Financials (Based on Availability)
- 16.2.11 Palo Alto Networks Inc
- 16.2.11.1. Overview
- 16.2.11.2. Products
- 16.2.11.3. SWOT Analysis
- 16.2.11.4. Recent Developments
- 16.2.11.5. Financials (Based on Availability)
- 16.2.1 Thales eSecurity (Thales Group)
List of Figures
- Figure 1: Global Container Security Industry Revenue Breakdown (Million, %) by Region 2024 & 2032
- Figure 2: Global Container Security Industry Volume Breakdown (K Unit, %) by Region 2024 & 2032
- Figure 3: North America Container Security Industry Revenue (Million), by Country 2024 & 2032
- Figure 4: North America Container Security Industry Volume (K Unit), by Country 2024 & 2032
- Figure 5: North America Container Security Industry Revenue Share (%), by Country 2024 & 2032
- Figure 6: North America Container Security Industry Volume Share (%), by Country 2024 & 2032
- Figure 7: Europe Container Security Industry Revenue (Million), by Country 2024 & 2032
- Figure 8: Europe Container Security Industry Volume (K Unit), by Country 2024 & 2032
- Figure 9: Europe Container Security Industry Revenue Share (%), by Country 2024 & 2032
- Figure 10: Europe Container Security Industry Volume Share (%), by Country 2024 & 2032
- Figure 11: Asia Pacific Container Security Industry Revenue (Million), by Country 2024 & 2032
- Figure 12: Asia Pacific Container Security Industry Volume (K Unit), by Country 2024 & 2032
- Figure 13: Asia Pacific Container Security Industry Revenue Share (%), by Country 2024 & 2032
- Figure 14: Asia Pacific Container Security Industry Volume Share (%), by Country 2024 & 2032
- Figure 15: South America Container Security Industry Revenue (Million), by Country 2024 & 2032
- Figure 16: South America Container Security Industry Volume (K Unit), by Country 2024 & 2032
- Figure 17: South America Container Security Industry Revenue Share (%), by Country 2024 & 2032
- Figure 18: South America Container Security Industry Volume Share (%), by Country 2024 & 2032
- Figure 19: North America Container Security Industry Revenue (Million), by Country 2024 & 2032
- Figure 20: North America Container Security Industry Volume (K Unit), by Country 2024 & 2032
- Figure 21: North America Container Security Industry Revenue Share (%), by Country 2024 & 2032
- Figure 22: North America Container Security Industry Volume Share (%), by Country 2024 & 2032
- Figure 23: MEA Container Security Industry Revenue (Million), by Country 2024 & 2032
- Figure 24: MEA Container Security Industry Volume (K Unit), by Country 2024 & 2032
- Figure 25: MEA Container Security Industry Revenue Share (%), by Country 2024 & 2032
- Figure 26: MEA Container Security Industry Volume Share (%), by Country 2024 & 2032
- Figure 27: North America Container Security Industry Revenue (Million), by Organisation Size 2024 & 2032
- Figure 28: North America Container Security Industry Volume (K Unit), by Organisation Size 2024 & 2032
- Figure 29: North America Container Security Industry Revenue Share (%), by Organisation Size 2024 & 2032
- Figure 30: North America Container Security Industry Volume Share (%), by Organisation Size 2024 & 2032
- Figure 31: North America Container Security Industry Revenue (Million), by Deployment 2024 & 2032
- Figure 32: North America Container Security Industry Volume (K Unit), by Deployment 2024 & 2032
- Figure 33: North America Container Security Industry Revenue Share (%), by Deployment 2024 & 2032
- Figure 34: North America Container Security Industry Volume Share (%), by Deployment 2024 & 2032
- Figure 35: North America Container Security Industry Revenue (Million), by End-user Industry 2024 & 2032
- Figure 36: North America Container Security Industry Volume (K Unit), by End-user Industry 2024 & 2032
- Figure 37: North America Container Security Industry Revenue Share (%), by End-user Industry 2024 & 2032
- Figure 38: North America Container Security Industry Volume Share (%), by End-user Industry 2024 & 2032
- Figure 39: North America Container Security Industry Revenue (Million), by Country 2024 & 2032
- Figure 40: North America Container Security Industry Volume (K Unit), by Country 2024 & 2032
- Figure 41: North America Container Security Industry Revenue Share (%), by Country 2024 & 2032
- Figure 42: North America Container Security Industry Volume Share (%), by Country 2024 & 2032
- Figure 43: Europe Container Security Industry Revenue (Million), by Organisation Size 2024 & 2032
- Figure 44: Europe Container Security Industry Volume (K Unit), by Organisation Size 2024 & 2032
- Figure 45: Europe Container Security Industry Revenue Share (%), by Organisation Size 2024 & 2032
- Figure 46: Europe Container Security Industry Volume Share (%), by Organisation Size 2024 & 2032
- Figure 47: Europe Container Security Industry Revenue (Million), by Deployment 2024 & 2032
- Figure 48: Europe Container Security Industry Volume (K Unit), by Deployment 2024 & 2032
- Figure 49: Europe Container Security Industry Revenue Share (%), by Deployment 2024 & 2032
- Figure 50: Europe Container Security Industry Volume Share (%), by Deployment 2024 & 2032
- Figure 51: Europe Container Security Industry Revenue (Million), by End-user Industry 2024 & 2032
- Figure 52: Europe Container Security Industry Volume (K Unit), by End-user Industry 2024 & 2032
- Figure 53: Europe Container Security Industry Revenue Share (%), by End-user Industry 2024 & 2032
- Figure 54: Europe Container Security Industry Volume Share (%), by End-user Industry 2024 & 2032
- Figure 55: Europe Container Security Industry Revenue (Million), by Country 2024 & 2032
- Figure 56: Europe Container Security Industry Volume (K Unit), by Country 2024 & 2032
- Figure 57: Europe Container Security Industry Revenue Share (%), by Country 2024 & 2032
- Figure 58: Europe Container Security Industry Volume Share (%), by Country 2024 & 2032
- Figure 59: Asia Pacific Container Security Industry Revenue (Million), by Organisation Size 2024 & 2032
- Figure 60: Asia Pacific Container Security Industry Volume (K Unit), by Organisation Size 2024 & 2032
- Figure 61: Asia Pacific Container Security Industry Revenue Share (%), by Organisation Size 2024 & 2032
- Figure 62: Asia Pacific Container Security Industry Volume Share (%), by Organisation Size 2024 & 2032
- Figure 63: Asia Pacific Container Security Industry Revenue (Million), by Deployment 2024 & 2032
- Figure 64: Asia Pacific Container Security Industry Volume (K Unit), by Deployment 2024 & 2032
- Figure 65: Asia Pacific Container Security Industry Revenue Share (%), by Deployment 2024 & 2032
- Figure 66: Asia Pacific Container Security Industry Volume Share (%), by Deployment 2024 & 2032
- Figure 67: Asia Pacific Container Security Industry Revenue (Million), by End-user Industry 2024 & 2032
- Figure 68: Asia Pacific Container Security Industry Volume (K Unit), by End-user Industry 2024 & 2032
- Figure 69: Asia Pacific Container Security Industry Revenue Share (%), by End-user Industry 2024 & 2032
- Figure 70: Asia Pacific Container Security Industry Volume Share (%), by End-user Industry 2024 & 2032
- Figure 71: Asia Pacific Container Security Industry Revenue (Million), by Country 2024 & 2032
- Figure 72: Asia Pacific Container Security Industry Volume (K Unit), by Country 2024 & 2032
- Figure 73: Asia Pacific Container Security Industry Revenue Share (%), by Country 2024 & 2032
- Figure 74: Asia Pacific Container Security Industry Volume Share (%), by Country 2024 & 2032
- Figure 75: Rest of the World Container Security Industry Revenue (Million), by Organisation Size 2024 & 2032
- Figure 76: Rest of the World Container Security Industry Volume (K Unit), by Organisation Size 2024 & 2032
- Figure 77: Rest of the World Container Security Industry Revenue Share (%), by Organisation Size 2024 & 2032
- Figure 78: Rest of the World Container Security Industry Volume Share (%), by Organisation Size 2024 & 2032
- Figure 79: Rest of the World Container Security Industry Revenue (Million), by Deployment 2024 & 2032
- Figure 80: Rest of the World Container Security Industry Volume (K Unit), by Deployment 2024 & 2032
- Figure 81: Rest of the World Container Security Industry Revenue Share (%), by Deployment 2024 & 2032
- Figure 82: Rest of the World Container Security Industry Volume Share (%), by Deployment 2024 & 2032
- Figure 83: Rest of the World Container Security Industry Revenue (Million), by End-user Industry 2024 & 2032
- Figure 84: Rest of the World Container Security Industry Volume (K Unit), by End-user Industry 2024 & 2032
- Figure 85: Rest of the World Container Security Industry Revenue Share (%), by End-user Industry 2024 & 2032
- Figure 86: Rest of the World Container Security Industry Volume Share (%), by End-user Industry 2024 & 2032
- Figure 87: Rest of the World Container Security Industry Revenue (Million), by Country 2024 & 2032
- Figure 88: Rest of the World Container Security Industry Volume (K Unit), by Country 2024 & 2032
- Figure 89: Rest of the World Container Security Industry Revenue Share (%), by Country 2024 & 2032
- Figure 90: Rest of the World Container Security Industry Volume Share (%), by Country 2024 & 2032
List of Tables
- Table 1: Global Container Security Industry Revenue Million Forecast, by Region 2019 & 2032
- Table 2: Global Container Security Industry Volume K Unit Forecast, by Region 2019 & 2032
- Table 3: Global Container Security Industry Revenue Million Forecast, by Organisation Size 2019 & 2032
- Table 4: Global Container Security Industry Volume K Unit Forecast, by Organisation Size 2019 & 2032
- Table 5: Global Container Security Industry Revenue Million Forecast, by Deployment 2019 & 2032
- Table 6: Global Container Security Industry Volume K Unit Forecast, by Deployment 2019 & 2032
- Table 7: Global Container Security Industry Revenue Million Forecast, by End-user Industry 2019 & 2032
- Table 8: Global Container Security Industry Volume K Unit Forecast, by End-user Industry 2019 & 2032
- Table 9: Global Container Security Industry Revenue Million Forecast, by Region 2019 & 2032
- Table 10: Global Container Security Industry Volume K Unit Forecast, by Region 2019 & 2032
- Table 11: Global Container Security Industry Revenue Million Forecast, by Country 2019 & 2032
- Table 12: Global Container Security Industry Volume K Unit Forecast, by Country 2019 & 2032
- Table 13: United States Container Security Industry Revenue (Million) Forecast, by Application 2019 & 2032
- Table 14: United States Container Security Industry Volume (K Unit) Forecast, by Application 2019 & 2032
- Table 15: Canada Container Security Industry Revenue (Million) Forecast, by Application 2019 & 2032
- Table 16: Canada Container Security Industry Volume (K Unit) Forecast, by Application 2019 & 2032
- Table 17: Mexico Container Security Industry Revenue (Million) Forecast, by Application 2019 & 2032
- Table 18: Mexico Container Security Industry Volume (K Unit) Forecast, by Application 2019 & 2032
- Table 19: Global Container Security Industry Revenue Million Forecast, by Country 2019 & 2032
- Table 20: Global Container Security Industry Volume K Unit Forecast, by Country 2019 & 2032
- Table 21: Germany Container Security Industry Revenue (Million) Forecast, by Application 2019 & 2032
- Table 22: Germany Container Security Industry Volume (K Unit) Forecast, by Application 2019 & 2032
- Table 23: United Kingdom Container Security Industry Revenue (Million) Forecast, by Application 2019 & 2032
- Table 24: United Kingdom Container Security Industry Volume (K Unit) Forecast, by Application 2019 & 2032
- Table 25: France Container Security Industry Revenue (Million) Forecast, by Application 2019 & 2032
- Table 26: France Container Security Industry Volume (K Unit) Forecast, by Application 2019 & 2032
- Table 27: Spain Container Security Industry Revenue (Million) Forecast, by Application 2019 & 2032
- Table 28: Spain Container Security Industry Volume (K Unit) Forecast, by Application 2019 & 2032
- Table 29: Italy Container Security Industry Revenue (Million) Forecast, by Application 2019 & 2032
- Table 30: Italy Container Security Industry Volume (K Unit) Forecast, by Application 2019 & 2032
- Table 31: Spain Container Security Industry Revenue (Million) Forecast, by Application 2019 & 2032
- Table 32: Spain Container Security Industry Volume (K Unit) Forecast, by Application 2019 & 2032
- Table 33: Belgium Container Security Industry Revenue (Million) Forecast, by Application 2019 & 2032
- Table 34: Belgium Container Security Industry Volume (K Unit) Forecast, by Application 2019 & 2032
- Table 35: Netherland Container Security Industry Revenue (Million) Forecast, by Application 2019 & 2032
- Table 36: Netherland Container Security Industry Volume (K Unit) Forecast, by Application 2019 & 2032
- Table 37: Nordics Container Security Industry Revenue (Million) Forecast, by Application 2019 & 2032
- Table 38: Nordics Container Security Industry Volume (K Unit) Forecast, by Application 2019 & 2032
- Table 39: Rest of Europe Container Security Industry Revenue (Million) Forecast, by Application 2019 & 2032
- Table 40: Rest of Europe Container Security Industry Volume (K Unit) Forecast, by Application 2019 & 2032
- Table 41: Global Container Security Industry Revenue Million Forecast, by Country 2019 & 2032
- Table 42: Global Container Security Industry Volume K Unit Forecast, by Country 2019 & 2032
- Table 43: China Container Security Industry Revenue (Million) Forecast, by Application 2019 & 2032
- Table 44: China Container Security Industry Volume (K Unit) Forecast, by Application 2019 & 2032
- Table 45: Japan Container Security Industry Revenue (Million) Forecast, by Application 2019 & 2032
- Table 46: Japan Container Security Industry Volume (K Unit) Forecast, by Application 2019 & 2032
- Table 47: India Container Security Industry Revenue (Million) Forecast, by Application 2019 & 2032
- Table 48: India Container Security Industry Volume (K Unit) Forecast, by Application 2019 & 2032
- Table 49: South Korea Container Security Industry Revenue (Million) Forecast, by Application 2019 & 2032
- Table 50: South Korea Container Security Industry Volume (K Unit) Forecast, by Application 2019 & 2032
- Table 51: Southeast Asia Container Security Industry Revenue (Million) Forecast, by Application 2019 & 2032
- Table 52: Southeast Asia Container Security Industry Volume (K Unit) Forecast, by Application 2019 & 2032
- Table 53: Australia Container Security Industry Revenue (Million) Forecast, by Application 2019 & 2032
- Table 54: Australia Container Security Industry Volume (K Unit) Forecast, by Application 2019 & 2032
- Table 55: Indonesia Container Security Industry Revenue (Million) Forecast, by Application 2019 & 2032
- Table 56: Indonesia Container Security Industry Volume (K Unit) Forecast, by Application 2019 & 2032
- Table 57: Phillipes Container Security Industry Revenue (Million) Forecast, by Application 2019 & 2032
- Table 58: Phillipes Container Security Industry Volume (K Unit) Forecast, by Application 2019 & 2032
- Table 59: Singapore Container Security Industry Revenue (Million) Forecast, by Application 2019 & 2032
- Table 60: Singapore Container Security Industry Volume (K Unit) Forecast, by Application 2019 & 2032
- Table 61: Thailandc Container Security Industry Revenue (Million) Forecast, by Application 2019 & 2032
- Table 62: Thailandc Container Security Industry Volume (K Unit) Forecast, by Application 2019 & 2032
- Table 63: Rest of Asia Pacific Container Security Industry Revenue (Million) Forecast, by Application 2019 & 2032
- Table 64: Rest of Asia Pacific Container Security Industry Volume (K Unit) Forecast, by Application 2019 & 2032
- Table 65: Global Container Security Industry Revenue Million Forecast, by Country 2019 & 2032
- Table 66: Global Container Security Industry Volume K Unit Forecast, by Country 2019 & 2032
- Table 67: Brazil Container Security Industry Revenue (Million) Forecast, by Application 2019 & 2032
- Table 68: Brazil Container Security Industry Volume (K Unit) Forecast, by Application 2019 & 2032
- Table 69: Argentina Container Security Industry Revenue (Million) Forecast, by Application 2019 & 2032
- Table 70: Argentina Container Security Industry Volume (K Unit) Forecast, by Application 2019 & 2032
- Table 71: Peru Container Security Industry Revenue (Million) Forecast, by Application 2019 & 2032
- Table 72: Peru Container Security Industry Volume (K Unit) Forecast, by Application 2019 & 2032
- Table 73: Chile Container Security Industry Revenue (Million) Forecast, by Application 2019 & 2032
- Table 74: Chile Container Security Industry Volume (K Unit) Forecast, by Application 2019 & 2032
- Table 75: Colombia Container Security Industry Revenue (Million) Forecast, by Application 2019 & 2032
- Table 76: Colombia Container Security Industry Volume (K Unit) Forecast, by Application 2019 & 2032
- Table 77: Ecuador Container Security Industry Revenue (Million) Forecast, by Application 2019 & 2032
- Table 78: Ecuador Container Security Industry Volume (K Unit) Forecast, by Application 2019 & 2032
- Table 79: Venezuela Container Security Industry Revenue (Million) Forecast, by Application 2019 & 2032
- Table 80: Venezuela Container Security Industry Volume (K Unit) Forecast, by Application 2019 & 2032
- Table 81: Rest of South America Container Security Industry Revenue (Million) Forecast, by Application 2019 & 2032
- Table 82: Rest of South America Container Security Industry Volume (K Unit) Forecast, by Application 2019 & 2032
- Table 83: Global Container Security Industry Revenue Million Forecast, by Country 2019 & 2032
- Table 84: Global Container Security Industry Volume K Unit Forecast, by Country 2019 & 2032
- Table 85: United States Container Security Industry Revenue (Million) Forecast, by Application 2019 & 2032
- Table 86: United States Container Security Industry Volume (K Unit) Forecast, by Application 2019 & 2032
- Table 87: Canada Container Security Industry Revenue (Million) Forecast, by Application 2019 & 2032
- Table 88: Canada Container Security Industry Volume (K Unit) Forecast, by Application 2019 & 2032
- Table 89: Mexico Container Security Industry Revenue (Million) Forecast, by Application 2019 & 2032
- Table 90: Mexico Container Security Industry Volume (K Unit) Forecast, by Application 2019 & 2032
- Table 91: Global Container Security Industry Revenue Million Forecast, by Country 2019 & 2032
- Table 92: Global Container Security Industry Volume K Unit Forecast, by Country 2019 & 2032
- Table 93: United Arab Emirates Container Security Industry Revenue (Million) Forecast, by Application 2019 & 2032
- Table 94: United Arab Emirates Container Security Industry Volume (K Unit) Forecast, by Application 2019 & 2032
- Table 95: Saudi Arabia Container Security Industry Revenue (Million) Forecast, by Application 2019 & 2032
- Table 96: Saudi Arabia Container Security Industry Volume (K Unit) Forecast, by Application 2019 & 2032
- Table 97: South Africa Container Security Industry Revenue (Million) Forecast, by Application 2019 & 2032
- Table 98: South Africa Container Security Industry Volume (K Unit) Forecast, by Application 2019 & 2032
- Table 99: Rest of Middle East and Africa Container Security Industry Revenue (Million) Forecast, by Application 2019 & 2032
- Table 100: Rest of Middle East and Africa Container Security Industry Volume (K Unit) Forecast, by Application 2019 & 2032
- Table 101: Global Container Security Industry Revenue Million Forecast, by Organisation Size 2019 & 2032
- Table 102: Global Container Security Industry Volume K Unit Forecast, by Organisation Size 2019 & 2032
- Table 103: Global Container Security Industry Revenue Million Forecast, by Deployment 2019 & 2032
- Table 104: Global Container Security Industry Volume K Unit Forecast, by Deployment 2019 & 2032
- Table 105: Global Container Security Industry Revenue Million Forecast, by End-user Industry 2019 & 2032
- Table 106: Global Container Security Industry Volume K Unit Forecast, by End-user Industry 2019 & 2032
- Table 107: Global Container Security Industry Revenue Million Forecast, by Country 2019 & 2032
- Table 108: Global Container Security Industry Volume K Unit Forecast, by Country 2019 & 2032
- Table 109: United States Container Security Industry Revenue (Million) Forecast, by Application 2019 & 2032
- Table 110: United States Container Security Industry Volume (K Unit) Forecast, by Application 2019 & 2032
- Table 111: Canada Container Security Industry Revenue (Million) Forecast, by Application 2019 & 2032
- Table 112: Canada Container Security Industry Volume (K Unit) Forecast, by Application 2019 & 2032
- Table 113: Global Container Security Industry Revenue Million Forecast, by Organisation Size 2019 & 2032
- Table 114: Global Container Security Industry Volume K Unit Forecast, by Organisation Size 2019 & 2032
- Table 115: Global Container Security Industry Revenue Million Forecast, by Deployment 2019 & 2032
- Table 116: Global Container Security Industry Volume K Unit Forecast, by Deployment 2019 & 2032
- Table 117: Global Container Security Industry Revenue Million Forecast, by End-user Industry 2019 & 2032
- Table 118: Global Container Security Industry Volume K Unit Forecast, by End-user Industry 2019 & 2032
- Table 119: Global Container Security Industry Revenue Million Forecast, by Country 2019 & 2032
- Table 120: Global Container Security Industry Volume K Unit Forecast, by Country 2019 & 2032
- Table 121: United Kingdom Container Security Industry Revenue (Million) Forecast, by Application 2019 & 2032
- Table 122: United Kingdom Container Security Industry Volume (K Unit) Forecast, by Application 2019 & 2032
- Table 123: Germany Container Security Industry Revenue (Million) Forecast, by Application 2019 & 2032
- Table 124: Germany Container Security Industry Volume (K Unit) Forecast, by Application 2019 & 2032
- Table 125: Rest of Europe Container Security Industry Revenue (Million) Forecast, by Application 2019 & 2032
- Table 126: Rest of Europe Container Security Industry Volume (K Unit) Forecast, by Application 2019 & 2032
- Table 127: Global Container Security Industry Revenue Million Forecast, by Organisation Size 2019 & 2032
- Table 128: Global Container Security Industry Volume K Unit Forecast, by Organisation Size 2019 & 2032
- Table 129: Global Container Security Industry Revenue Million Forecast, by Deployment 2019 & 2032
- Table 130: Global Container Security Industry Volume K Unit Forecast, by Deployment 2019 & 2032
- Table 131: Global Container Security Industry Revenue Million Forecast, by End-user Industry 2019 & 2032
- Table 132: Global Container Security Industry Volume K Unit Forecast, by End-user Industry 2019 & 2032
- Table 133: Global Container Security Industry Revenue Million Forecast, by Country 2019 & 2032
- Table 134: Global Container Security Industry Volume K Unit Forecast, by Country 2019 & 2032
- Table 135: China Container Security Industry Revenue (Million) Forecast, by Application 2019 & 2032
- Table 136: China Container Security Industry Volume (K Unit) Forecast, by Application 2019 & 2032
- Table 137: Japan Container Security Industry Revenue (Million) Forecast, by Application 2019 & 2032
- Table 138: Japan Container Security Industry Volume (K Unit) Forecast, by Application 2019 & 2032
- Table 139: Rest of Asia Pacific Container Security Industry Revenue (Million) Forecast, by Application 2019 & 2032
- Table 140: Rest of Asia Pacific Container Security Industry Volume (K Unit) Forecast, by Application 2019 & 2032
- Table 141: Global Container Security Industry Revenue Million Forecast, by Organisation Size 2019 & 2032
- Table 142: Global Container Security Industry Volume K Unit Forecast, by Organisation Size 2019 & 2032
- Table 143: Global Container Security Industry Revenue Million Forecast, by Deployment 2019 & 2032
- Table 144: Global Container Security Industry Volume K Unit Forecast, by Deployment 2019 & 2032
- Table 145: Global Container Security Industry Revenue Million Forecast, by End-user Industry 2019 & 2032
- Table 146: Global Container Security Industry Volume K Unit Forecast, by End-user Industry 2019 & 2032
- Table 147: Global Container Security Industry Revenue Million Forecast, by Country 2019 & 2032
- Table 148: Global Container Security Industry Volume K Unit Forecast, by Country 2019 & 2032
- Table 149: Latin America Container Security Industry Revenue (Million) Forecast, by Application 2019 & 2032
- Table 150: Latin America Container Security Industry Volume (K Unit) Forecast, by Application 2019 & 2032
- Table 151: Middle East Container Security Industry Revenue (Million) Forecast, by Application 2019 & 2032
- Table 152: Middle East Container Security Industry Volume (K Unit) Forecast, by Application 2019 & 2032
Frequently Asked Questions
1. What is the projected Compound Annual Growth Rate (CAGR) of the Container Security Industry?
The projected CAGR is approximately 22.54%.
2. Which companies are prominent players in the Container Security Industry?
Key companies in the market include Thales eSecurity (Thales Group), NeuVector Inc (SUSE Software Solutions Germany GmbH), Mirantis Inc (Docker Inc ), Google LLC (Alphabet Inc ), Fidelis Cybersecurity Inc , Red Hat Inc, Trend Micro Incorporated, Rapid7 Inc, Qualys Inc, Aqua Security Software Ltd, Palo Alto Networks Inc.
3. What are the main segments of the Container Security Industry?
The market segments include Organisation Size, Deployment, End-user Industry.
4. Can you provide details about the market size?
The market size is estimated to be USD 3.28 Million as of 2022.
5. What are some drivers contributing to market growth?
Rising Adoption of the Hybrid Cloud Technology Applications; Growing Vulnerability Concern across the Container Architecture.
6. What are the notable trends driving market growth?
Rising Adoption of the Hybrid Cloud Technology Applications may Drive the Market Growth.
7. Are there any restraints impacting market growth?
Complexity in Managing the Cloud Environments; Inadequate Budgets in SMEs and Lack of Technical Expertise.
8. Can you provide examples of recent developments in the market?
October 2022: Veracode, a prominent global supplier of application security testing solutions, announced the addition of container security to its Continuous Software Security Platform. Existing clients can now participate in the Veracode Container Security early access program. The new Veracode Container Security service addresses the need for vulnerability scanning, secure configuration, and secrets management for container images.
9. What pricing options are available for accessing the report?
Pricing options include single-user, multi-user, and enterprise licenses priced at USD 4750, USD 5250, and USD 8750 respectively.
10. Is the market size provided in terms of value or volume?
The market size is provided in terms of value, measured in Million and volume, measured in K Unit.
11. Are there any specific market keywords associated with the report?
Yes, the market keyword associated with the report is "Container Security Industry," which aids in identifying and referencing the specific market segment covered.
12. How do I determine which pricing option suits my needs best?
The pricing options vary based on user requirements and access needs. Individual users may opt for single-user licenses, while businesses requiring broader access may choose multi-user or enterprise licenses for cost-effective access to the report.
13. Are there any additional resources or data provided in the Container Security Industry report?
While the report offers comprehensive insights, it's advisable to review the specific contents or supplementary materials provided to ascertain if additional resources or data are available.
14. How can I stay updated on further developments or reports in the Container Security Industry?
To stay informed about further developments, trends, and reports in the Container Security Industry, consider subscribing to industry newsletters, following relevant companies and organizations, or regularly checking reputable industry news sources and publications.
Methodology
Step 1 - Identification of Relevant Samples Size from Population Database


Step 2 - Approaches for Defining Global Market Size (Value, Volume* & Price*)

Note*: In applicable scenarios
Step 3 - Data Sources
Primary Research
- Web Analytics
- Survey Reports
- Research Institute
- Latest Research Reports
- Opinion Leaders
Secondary Research
- Annual Reports
- White Paper
- Latest Press Release
- Industry Association
- Paid Database
- Investor Presentations

Step 4 - Data Triangulation
Involves using different sources of information in order to increase the validity of a study
These sources are likely to be stakeholders in a program - participants, other researchers, program staff, other community members, and so on.
Then we put all data in single framework & apply various statistical tools to find out the dynamic on the market.
During the analysis stage, feedback from the stakeholder groups would be compared to determine areas of agreement as well as areas of divergence
