

Key Insights
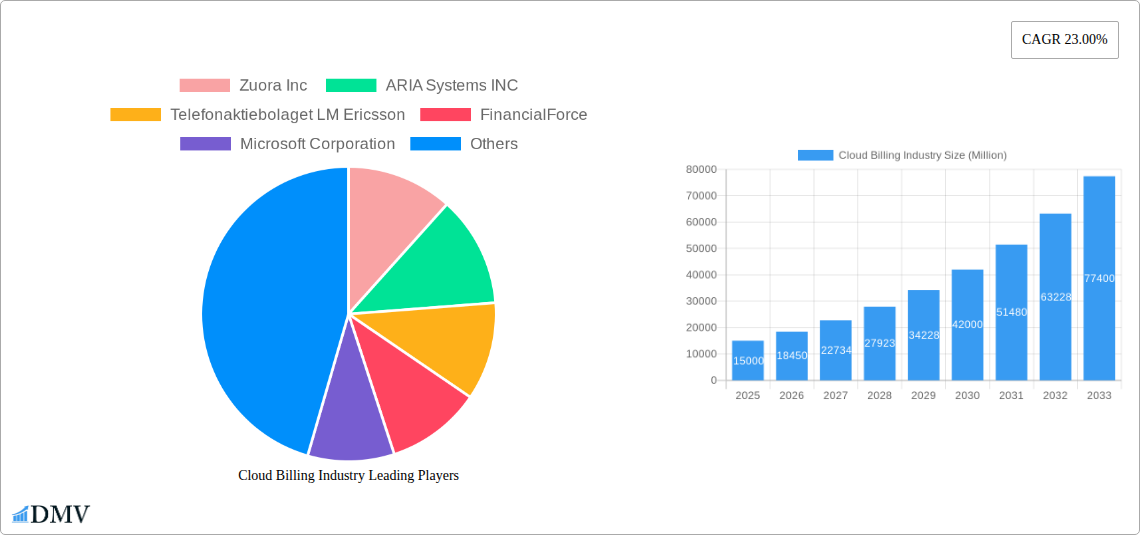
The cloud billing market is experiencing robust growth, driven by the increasing adoption of cloud-based services across diverse sectors. The market's 23% CAGR indicates significant expansion, projected to reach substantial value by 2033. Key drivers include the need for flexible and scalable billing solutions to manage complex cloud consumption models, the rise of subscription-based services, and the increasing demand for real-time billing and reporting. The shift towards hybrid and multi-cloud environments further fuels market growth as businesses seek unified billing platforms to consolidate their cloud spending. Major trends include the integration of AI and machine learning for enhanced billing accuracy and automation, and the growing adoption of cloud billing solutions by small and medium-sized enterprises (SMEs) seeking cost optimization. While data security and compliance concerns represent potential restraints, the overall market outlook remains positive, fueled by ongoing cloud adoption and technological advancements. The market is segmented by end-user industry (retail, power & energy, healthcare, telecommunications, BFSI, others), deployment model (public, private, hybrid cloud), and component (platform, services). North America currently holds a significant market share, but regions like Asia-Pacific are experiencing rapid growth, driven by increasing digital transformation initiatives. The competitive landscape includes established players like Zuora, Aria Systems, and established tech giants like Microsoft and Amazon, alongside specialized cloud billing providers. Future growth will be shaped by advancements in billing automation, improved integration with cloud management platforms, and the emergence of innovative pricing models.
The competitive intensity is likely to increase as established players continue to enhance their offerings and new entrants emerge. Strategic partnerships and acquisitions will play a crucial role in shaping the market dynamics. The focus will remain on providing comprehensive solutions that address the evolving needs of businesses across various industry verticals and cloud deployment models. The market's success hinges on addressing concerns around security, compliance, and data privacy while simultaneously offering flexible, scalable, and user-friendly solutions. The increasing complexity of cloud environments underscores the need for robust and adaptable cloud billing solutions, further solidifying the market’s long-term growth prospects. Companies will need to focus on offering superior customer support, integration capabilities, and data analytics to maintain a competitive edge.
Cloud Billing Industry: A Comprehensive Market Report (2019-2033)
This insightful report provides a detailed analysis of the Cloud Billing industry, projecting a market valuation of $XX Million by 2033. We examine market dynamics, technological advancements, and key players shaping this rapidly evolving landscape. The report covers the historical period (2019-2024), the base year (2025), and forecasts up to 2033, offering valuable insights for stakeholders across the industry.
Cloud Billing Industry Market Composition & Trends
The Cloud Billing market, valued at $XX Million in 2025, is experiencing robust growth driven by the increasing adoption of cloud computing and the need for efficient billing solutions. Market concentration is moderate, with key players like Zuora Inc, ARIA Systems INC, and Amazon Web Services Inc holding significant but not dominant shares. Innovation is fueled by advancements in AI, machine learning, and automation, leading to more intelligent and adaptable billing platforms. The regulatory landscape is evolving, with data privacy and security regulations impacting product development and deployment. Substitute products, such as on-premise billing systems, are losing market share due to the scalability and cost-effectiveness of cloud solutions. The end-user profile is diverse, spanning retail, BFSI, healthcare, and telecommunications sectors. M&A activity is significant, with deal values totaling $XX Million in the last five years, indicating ongoing consolidation within the industry.
- Market Share Distribution (2025): Zuora Inc (XX%), ARIA Systems INC (XX%), AWS (XX%), Others (XX%)
- M&A Deal Value (2019-2024): $XX Million
- Key Innovation Catalysts: AI, Machine Learning, Automation
- Regulatory Landscape: GDPR, CCPA, other regional data protection laws
Cloud Billing Industry Industry Evolution
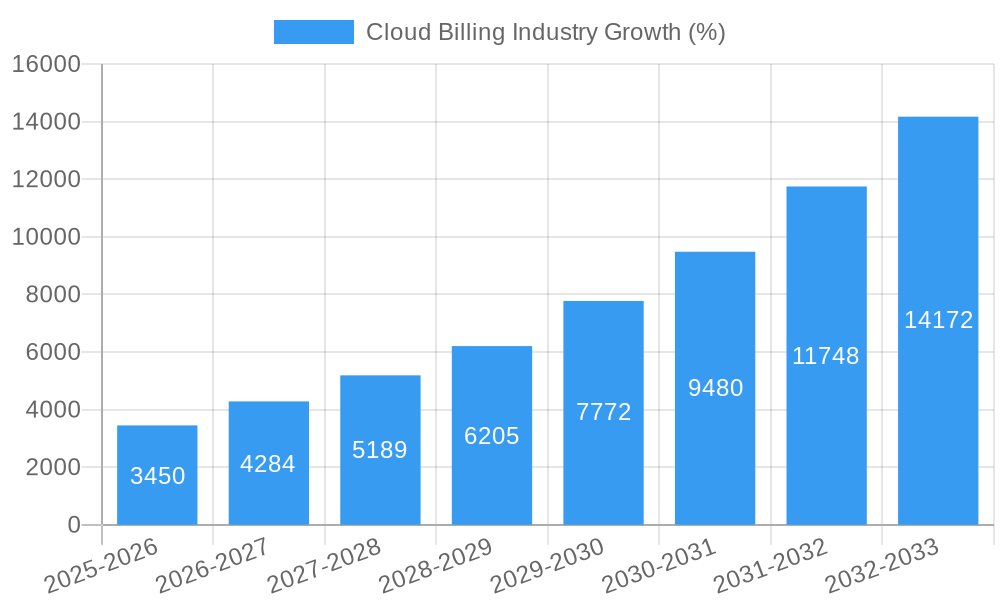
The Cloud Billing industry has witnessed exponential growth since 2019, with a Compound Annual Growth Rate (CAGR) of XX% during the historical period. This growth is propelled by several factors: the rising adoption of SaaS and cloud-based services across various industries, increasing demand for flexible and scalable billing models, and the growing need for real-time billing and revenue management capabilities. Technological advancements, such as the integration of AI and machine learning into billing platforms, are enhancing automation, accuracy, and customer experience. Consumer demands are shifting toward personalized billing experiences, self-service portals, and increased transparency in pricing and usage.
- Historical CAGR (2019-2024): XX%
- Projected CAGR (2025-2033): XX%
- Adoption Rate of Cloud Billing Solutions (2025): XX%
- Key Technological Advancements: AI-powered billing, real-time pricing, automated invoice generation
Leading Regions, Countries, or Segments in Cloud Billing Industry
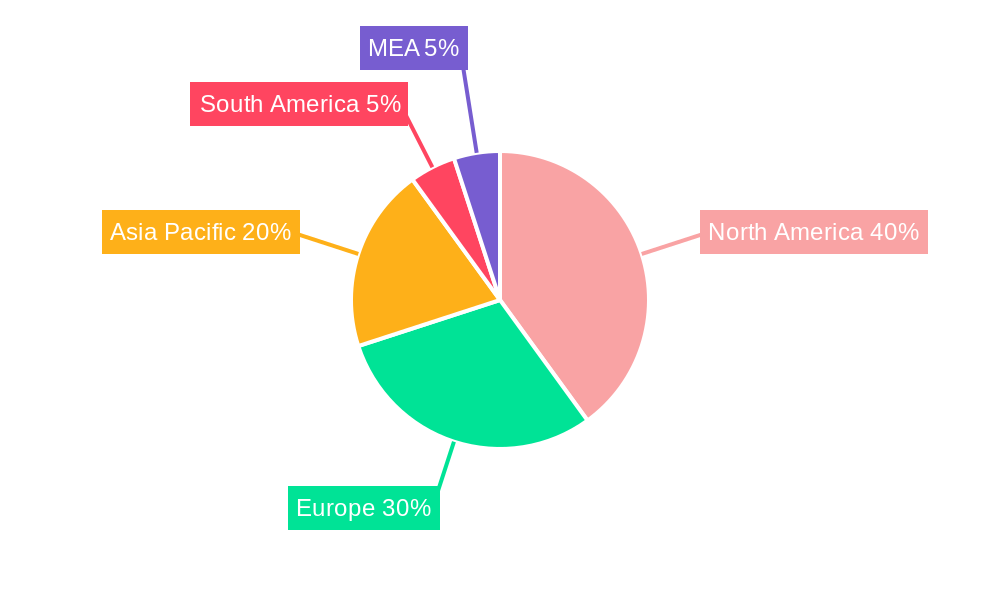
North America currently dominates the Cloud Billing market, driven by high cloud adoption rates and the presence of major technology players. However, the Asia-Pacific region is witnessing significant growth due to rapid digital transformation and increasing investment in cloud infrastructure.
- By End-user Industry: BFSI and Telecommunications segments are leading due to their high volume transactions and complex billing requirements.
- By Deployment: Public Cloud dominates, given its scalability and cost-effectiveness.
- By Component: Services segment holds a larger market share driven by the demand for customized solutions and ongoing support.
- Key Drivers for North America: High cloud adoption, presence of major technology companies, strong regulatory framework.
- Key Drivers for Asia-Pacific: Rapid digital transformation, increasing investment in cloud infrastructure, growing need for efficient billing solutions.
Cloud Billing Industry Product Innovations
Recent innovations include AI-powered billing platforms that offer predictive analytics, automated fraud detection, and personalized pricing models. These platforms integrate seamlessly with existing CRM and ERP systems, streamlining operations and improving overall efficiency. Unique selling propositions often focus on ease of use, scalability, real-time billing capabilities, and robust security features.
Propelling Factors for Cloud Billing Industry Growth
Technological advancements, such as AI and machine learning, are driving automation and enhancing accuracy in billing processes. Economic factors like cost optimization and improved operational efficiency are also key growth drivers. Favorable regulatory environments in certain regions further support the adoption of cloud-based billing solutions.
Obstacles in the Cloud Billing Industry Market
Integration complexities with legacy systems, data security concerns, and the need for robust compliance with evolving regulations pose significant challenges. Competitive pressures from established players and emerging startups also impact market dynamics.
Future Opportunities in Cloud Billing Industry
Emerging markets in developing economies present substantial growth opportunities. Advancements in blockchain technology for secure transactions and the integration of IoT data into billing platforms offer promising avenues for innovation.
Major Players in the Cloud Billing Industry Ecosystem
- Zuora Inc
- ARIA Systems INC
- Telefonaktiebolaget LM Ericsson
- FinancialForce
- Microsoft Corporation
- Amazon Web Services Inc
- Oracle Corporation
- BillingPlatform
- Orbitera Inc
- SAP SE
Key Developments in Cloud Billing Industry Industry
- March 2022: Amazon Web Services, Inc. (AWS) launched AWS Billing Conductor, enabling personalized pricing and cost insights for end-users.
- March 2022: Rentokil North America adopted Aria Systems' cloud-based billing platform for streamlined billing across multiple business lines.
- January 2023: Input 1's premium collecting platform enhanced its comprehensive payments and billing platform, supporting 125+ carriers and thousands of insurance agents.
Strategic Cloud Billing Industry Market Forecast
The Cloud Billing market is poised for continued growth, driven by technological advancements and increasing demand for efficient and scalable billing solutions. The expansion into new markets and the adoption of innovative technologies will further fuel this growth, presenting substantial opportunities for existing and new market entrants. The market is expected to reach $XX Million by 2033, representing significant potential for investors and businesses operating in this space.
Cloud Billing Industry Segmentation
-
1. Deployment
- 1.1. Public Cloud
- 1.2. Private Cloud
- 1.3. Hybrid Cloud
-
2. Component
- 2.1. Platform
- 2.2. Services
-
3. End-user Industry
- 3.1. Retail
- 3.2. Power & Energy
- 3.3. Healthcare
- 3.4. Telecommunications
- 3.5. BFSI
- 3.6. Other End-user Industries
Cloud Billing Industry Segmentation By Geography
-
1. North America
- 1.1. United States
- 1.2. Canada
-
2. Europe
- 2.1. United Kingdom
- 2.2. Germany
- 2.3. France
- 2.4. Rest of Europe
-
3. Asia Pacific
- 3.1. China
- 3.2. India
- 3.3. South Korea
- 3.4. Rest of Asia Pacific
-
4. Latin America
- 4.1. Brazil
- 4.2. Mexico
- 4.3. Rest of Latin America
- 5. Middle East
-
6. United Arab Emirates
- 6.1. South Africa
- 6.2. Saudi Arabia
- 6.3. Rest of Middle East
Cloud Billing Industry REPORT HIGHLIGHTS
| Aspects | Details |
|---|---|
| Study Period | 2019-2033 |
| Base Year | 2024 |
| Estimated Year | 2025 |
| Forecast Period | 2025-2033 |
| Historical Period | 2019-2024 |
| Growth Rate | CAGR of 23.00% from 2019-2033 |
| Segmentation |
|
Table of Contents
- 1. Introduction
- 1.1. Research Scope
- 1.2. Market Segmentation
- 1.3. Research Methodology
- 1.4. Definitions and Assumptions
- 2. Executive Summary
- 2.1. Introduction
- 3. Market Dynamics
- 3.1. Introduction
- 3.2. Market Drivers
- 3.2.1. Increasing Adoption of Cloud Computing; Growth in E-commerce Platforms
- 3.3. Market Restrains
- 3.3.1. Transition From On-Premise to Cloud-Based Solutions; High Costs Involved and Data Privacy Issues
- 3.4. Market Trends
- 3.4.1. Retail Sector Expected to Show Maximum Application
- 4. Market Factor Analysis
- 4.1. Porters Five Forces
- 4.2. Supply/Value Chain
- 4.3. PESTEL analysis
- 4.4. Market Entropy
- 4.5. Patent/Trademark Analysis
- 5. Global Cloud Billing Industry Analysis, Insights and Forecast, 2019-2031
- 5.1. Market Analysis, Insights and Forecast - by Deployment
- 5.1.1. Public Cloud
- 5.1.2. Private Cloud
- 5.1.3. Hybrid Cloud
- 5.2. Market Analysis, Insights and Forecast - by Component
- 5.2.1. Platform
- 5.2.2. Services
- 5.3. Market Analysis, Insights and Forecast - by End-user Industry
- 5.3.1. Retail
- 5.3.2. Power & Energy
- 5.3.3. Healthcare
- 5.3.4. Telecommunications
- 5.3.5. BFSI
- 5.3.6. Other End-user Industries
- 5.4. Market Analysis, Insights and Forecast - by Region
- 5.4.1. North America
- 5.4.2. Europe
- 5.4.3. Asia Pacific
- 5.4.4. Latin America
- 5.4.5. Middle East
- 5.4.6. United Arab Emirates
- 5.1. Market Analysis, Insights and Forecast - by Deployment
- 6. North America Cloud Billing Industry Analysis, Insights and Forecast, 2019-2031
- 6.1. Market Analysis, Insights and Forecast - by Deployment
- 6.1.1. Public Cloud
- 6.1.2. Private Cloud
- 6.1.3. Hybrid Cloud
- 6.2. Market Analysis, Insights and Forecast - by Component
- 6.2.1. Platform
- 6.2.2. Services
- 6.3. Market Analysis, Insights and Forecast - by End-user Industry
- 6.3.1. Retail
- 6.3.2. Power & Energy
- 6.3.3. Healthcare
- 6.3.4. Telecommunications
- 6.3.5. BFSI
- 6.3.6. Other End-user Industries
- 6.1. Market Analysis, Insights and Forecast - by Deployment
- 7. Europe Cloud Billing Industry Analysis, Insights and Forecast, 2019-2031
- 7.1. Market Analysis, Insights and Forecast - by Deployment
- 7.1.1. Public Cloud
- 7.1.2. Private Cloud
- 7.1.3. Hybrid Cloud
- 7.2. Market Analysis, Insights and Forecast - by Component
- 7.2.1. Platform
- 7.2.2. Services
- 7.3. Market Analysis, Insights and Forecast - by End-user Industry
- 7.3.1. Retail
- 7.3.2. Power & Energy
- 7.3.3. Healthcare
- 7.3.4. Telecommunications
- 7.3.5. BFSI
- 7.3.6. Other End-user Industries
- 7.1. Market Analysis, Insights and Forecast - by Deployment
- 8. Asia Pacific Cloud Billing Industry Analysis, Insights and Forecast, 2019-2031
- 8.1. Market Analysis, Insights and Forecast - by Deployment
- 8.1.1. Public Cloud
- 8.1.2. Private Cloud
- 8.1.3. Hybrid Cloud
- 8.2. Market Analysis, Insights and Forecast - by Component
- 8.2.1. Platform
- 8.2.2. Services
- 8.3. Market Analysis, Insights and Forecast - by End-user Industry
- 8.3.1. Retail
- 8.3.2. Power & Energy
- 8.3.3. Healthcare
- 8.3.4. Telecommunications
- 8.3.5. BFSI
- 8.3.6. Other End-user Industries
- 8.1. Market Analysis, Insights and Forecast - by Deployment
- 9. Latin America Cloud Billing Industry Analysis, Insights and Forecast, 2019-2031
- 9.1. Market Analysis, Insights and Forecast - by Deployment
- 9.1.1. Public Cloud
- 9.1.2. Private Cloud
- 9.1.3. Hybrid Cloud
- 9.2. Market Analysis, Insights and Forecast - by Component
- 9.2.1. Platform
- 9.2.2. Services
- 9.3. Market Analysis, Insights and Forecast - by End-user Industry
- 9.3.1. Retail
- 9.3.2. Power & Energy
- 9.3.3. Healthcare
- 9.3.4. Telecommunications
- 9.3.5. BFSI
- 9.3.6. Other End-user Industries
- 9.1. Market Analysis, Insights and Forecast - by Deployment
- 10. Middle East Cloud Billing Industry Analysis, Insights and Forecast, 2019-2031
- 10.1. Market Analysis, Insights and Forecast - by Deployment
- 10.1.1. Public Cloud
- 10.1.2. Private Cloud
- 10.1.3. Hybrid Cloud
- 10.2. Market Analysis, Insights and Forecast - by Component
- 10.2.1. Platform
- 10.2.2. Services
- 10.3. Market Analysis, Insights and Forecast - by End-user Industry
- 10.3.1. Retail
- 10.3.2. Power & Energy
- 10.3.3. Healthcare
- 10.3.4. Telecommunications
- 10.3.5. BFSI
- 10.3.6. Other End-user Industries
- 10.1. Market Analysis, Insights and Forecast - by Deployment
- 11. United Arab Emirates Cloud Billing Industry Analysis, Insights and Forecast, 2019-2031
- 11.1. Market Analysis, Insights and Forecast - by Deployment
- 11.1.1. Public Cloud
- 11.1.2. Private Cloud
- 11.1.3. Hybrid Cloud
- 11.2. Market Analysis, Insights and Forecast - by Component
- 11.2.1. Platform
- 11.2.2. Services
- 11.3. Market Analysis, Insights and Forecast - by End-user Industry
- 11.3.1. Retail
- 11.3.2. Power & Energy
- 11.3.3. Healthcare
- 11.3.4. Telecommunications
- 11.3.5. BFSI
- 11.3.6. Other End-user Industries
- 11.1. Market Analysis, Insights and Forecast - by Deployment
- 12. North America Cloud Billing Industry Analysis, Insights and Forecast, 2019-2031
- 12.1. Market Analysis, Insights and Forecast - By Country/Sub-region
- 12.1.1 United States
- 12.1.2 Canada
- 12.1.3 Mexico
- 13. Europe Cloud Billing Industry Analysis, Insights and Forecast, 2019-2031
- 13.1. Market Analysis, Insights and Forecast - By Country/Sub-region
- 13.1.1 Germany
- 13.1.2 United Kingdom
- 13.1.3 France
- 13.1.4 Spain
- 13.1.5 Italy
- 13.1.6 Spain
- 13.1.7 Belgium
- 13.1.8 Netherland
- 13.1.9 Nordics
- 13.1.10 Rest of Europe
- 14. Asia Pacific Cloud Billing Industry Analysis, Insights and Forecast, 2019-2031
- 14.1. Market Analysis, Insights and Forecast - By Country/Sub-region
- 14.1.1 China
- 14.1.2 Japan
- 14.1.3 India
- 14.1.4 South Korea
- 14.1.5 Southeast Asia
- 14.1.6 Australia
- 14.1.7 Indonesia
- 14.1.8 Phillipes
- 14.1.9 Singapore
- 14.1.10 Thailandc
- 14.1.11 Rest of Asia Pacific
- 15. South America Cloud Billing Industry Analysis, Insights and Forecast, 2019-2031
- 15.1. Market Analysis, Insights and Forecast - By Country/Sub-region
- 15.1.1 Brazil
- 15.1.2 Argentina
- 15.1.3 Peru
- 15.1.4 Chile
- 15.1.5 Colombia
- 15.1.6 Ecuador
- 15.1.7 Venezuela
- 15.1.8 Rest of South America
- 16. North America Cloud Billing Industry Analysis, Insights and Forecast, 2019-2031
- 16.1. Market Analysis, Insights and Forecast - By Country/Sub-region
- 16.1.1 United States
- 16.1.2 Canada
- 16.1.3 Mexico
- 17. MEA Cloud Billing Industry Analysis, Insights and Forecast, 2019-2031
- 17.1. Market Analysis, Insights and Forecast - By Country/Sub-region
- 17.1.1 United Arab Emirates
- 17.1.2 Saudi Arabia
- 17.1.3 South Africa
- 17.1.4 Rest of Middle East and Africa
- 18. Competitive Analysis
- 18.1. Global Market Share Analysis 2024
- 18.2. Company Profiles
- 18.2.1 Zuora Inc
- 18.2.1.1. Overview
- 18.2.1.2. Products
- 18.2.1.3. SWOT Analysis
- 18.2.1.4. Recent Developments
- 18.2.1.5. Financials (Based on Availability)
- 18.2.2 ARIA Systems INC
- 18.2.2.1. Overview
- 18.2.2.2. Products
- 18.2.2.3. SWOT Analysis
- 18.2.2.4. Recent Developments
- 18.2.2.5. Financials (Based on Availability)
- 18.2.3 Telefonaktiebolaget LM Ericsson
- 18.2.3.1. Overview
- 18.2.3.2. Products
- 18.2.3.3. SWOT Analysis
- 18.2.3.4. Recent Developments
- 18.2.3.5. Financials (Based on Availability)
- 18.2.4 FinancialForce
- 18.2.4.1. Overview
- 18.2.4.2. Products
- 18.2.4.3. SWOT Analysis
- 18.2.4.4. Recent Developments
- 18.2.4.5. Financials (Based on Availability)
- 18.2.5 Microsoft Corporation
- 18.2.5.1. Overview
- 18.2.5.2. Products
- 18.2.5.3. SWOT Analysis
- 18.2.5.4. Recent Developments
- 18.2.5.5. Financials (Based on Availability)
- 18.2.6 Amazon Web Services Inc
- 18.2.6.1. Overview
- 18.2.6.2. Products
- 18.2.6.3. SWOT Analysis
- 18.2.6.4. Recent Developments
- 18.2.6.5. Financials (Based on Availability)
- 18.2.7 Oracle Corporation
- 18.2.7.1. Overview
- 18.2.7.2. Products
- 18.2.7.3. SWOT Analysis
- 18.2.7.4. Recent Developments
- 18.2.7.5. Financials (Based on Availability)
- 18.2.8 BillingPlatform
- 18.2.8.1. Overview
- 18.2.8.2. Products
- 18.2.8.3. SWOT Analysis
- 18.2.8.4. Recent Developments
- 18.2.8.5. Financials (Based on Availability)
- 18.2.9 Orbitera Inc
- 18.2.9.1. Overview
- 18.2.9.2. Products
- 18.2.9.3. SWOT Analysis
- 18.2.9.4. Recent Developments
- 18.2.9.5. Financials (Based on Availability)
- 18.2.10 SAP SE
- 18.2.10.1. Overview
- 18.2.10.2. Products
- 18.2.10.3. SWOT Analysis
- 18.2.10.4. Recent Developments
- 18.2.10.5. Financials (Based on Availability)
- 18.2.1 Zuora Inc
List of Figures
- Figure 1: Global Cloud Billing Industry Revenue Breakdown (Million, %) by Region 2024 & 2032
- Figure 2: Global Cloud Billing Industry Volume Breakdown (K Unit, %) by Region 2024 & 2032
- Figure 3: North America Cloud Billing Industry Revenue (Million), by Country 2024 & 2032
- Figure 4: North America Cloud Billing Industry Volume (K Unit), by Country 2024 & 2032
- Figure 5: North America Cloud Billing Industry Revenue Share (%), by Country 2024 & 2032
- Figure 6: North America Cloud Billing Industry Volume Share (%), by Country 2024 & 2032
- Figure 7: Europe Cloud Billing Industry Revenue (Million), by Country 2024 & 2032
- Figure 8: Europe Cloud Billing Industry Volume (K Unit), by Country 2024 & 2032
- Figure 9: Europe Cloud Billing Industry Revenue Share (%), by Country 2024 & 2032
- Figure 10: Europe Cloud Billing Industry Volume Share (%), by Country 2024 & 2032
- Figure 11: Asia Pacific Cloud Billing Industry Revenue (Million), by Country 2024 & 2032
- Figure 12: Asia Pacific Cloud Billing Industry Volume (K Unit), by Country 2024 & 2032
- Figure 13: Asia Pacific Cloud Billing Industry Revenue Share (%), by Country 2024 & 2032
- Figure 14: Asia Pacific Cloud Billing Industry Volume Share (%), by Country 2024 & 2032
- Figure 15: South America Cloud Billing Industry Revenue (Million), by Country 2024 & 2032
- Figure 16: South America Cloud Billing Industry Volume (K Unit), by Country 2024 & 2032
- Figure 17: South America Cloud Billing Industry Revenue Share (%), by Country 2024 & 2032
- Figure 18: South America Cloud Billing Industry Volume Share (%), by Country 2024 & 2032
- Figure 19: North America Cloud Billing Industry Revenue (Million), by Country 2024 & 2032
- Figure 20: North America Cloud Billing Industry Volume (K Unit), by Country 2024 & 2032
- Figure 21: North America Cloud Billing Industry Revenue Share (%), by Country 2024 & 2032
- Figure 22: North America Cloud Billing Industry Volume Share (%), by Country 2024 & 2032
- Figure 23: MEA Cloud Billing Industry Revenue (Million), by Country 2024 & 2032
- Figure 24: MEA Cloud Billing Industry Volume (K Unit), by Country 2024 & 2032
- Figure 25: MEA Cloud Billing Industry Revenue Share (%), by Country 2024 & 2032
- Figure 26: MEA Cloud Billing Industry Volume Share (%), by Country 2024 & 2032
- Figure 27: North America Cloud Billing Industry Revenue (Million), by Deployment 2024 & 2032
- Figure 28: North America Cloud Billing Industry Volume (K Unit), by Deployment 2024 & 2032
- Figure 29: North America Cloud Billing Industry Revenue Share (%), by Deployment 2024 & 2032
- Figure 30: North America Cloud Billing Industry Volume Share (%), by Deployment 2024 & 2032
- Figure 31: North America Cloud Billing Industry Revenue (Million), by Component 2024 & 2032
- Figure 32: North America Cloud Billing Industry Volume (K Unit), by Component 2024 & 2032
- Figure 33: North America Cloud Billing Industry Revenue Share (%), by Component 2024 & 2032
- Figure 34: North America Cloud Billing Industry Volume Share (%), by Component 2024 & 2032
- Figure 35: North America Cloud Billing Industry Revenue (Million), by End-user Industry 2024 & 2032
- Figure 36: North America Cloud Billing Industry Volume (K Unit), by End-user Industry 2024 & 2032
- Figure 37: North America Cloud Billing Industry Revenue Share (%), by End-user Industry 2024 & 2032
- Figure 38: North America Cloud Billing Industry Volume Share (%), by End-user Industry 2024 & 2032
- Figure 39: North America Cloud Billing Industry Revenue (Million), by Country 2024 & 2032
- Figure 40: North America Cloud Billing Industry Volume (K Unit), by Country 2024 & 2032
- Figure 41: North America Cloud Billing Industry Revenue Share (%), by Country 2024 & 2032
- Figure 42: North America Cloud Billing Industry Volume Share (%), by Country 2024 & 2032
- Figure 43: Europe Cloud Billing Industry Revenue (Million), by Deployment 2024 & 2032
- Figure 44: Europe Cloud Billing Industry Volume (K Unit), by Deployment 2024 & 2032
- Figure 45: Europe Cloud Billing Industry Revenue Share (%), by Deployment 2024 & 2032
- Figure 46: Europe Cloud Billing Industry Volume Share (%), by Deployment 2024 & 2032
- Figure 47: Europe Cloud Billing Industry Revenue (Million), by Component 2024 & 2032
- Figure 48: Europe Cloud Billing Industry Volume (K Unit), by Component 2024 & 2032
- Figure 49: Europe Cloud Billing Industry Revenue Share (%), by Component 2024 & 2032
- Figure 50: Europe Cloud Billing Industry Volume Share (%), by Component 2024 & 2032
- Figure 51: Europe Cloud Billing Industry Revenue (Million), by End-user Industry 2024 & 2032
- Figure 52: Europe Cloud Billing Industry Volume (K Unit), by End-user Industry 2024 & 2032
- Figure 53: Europe Cloud Billing Industry Revenue Share (%), by End-user Industry 2024 & 2032
- Figure 54: Europe Cloud Billing Industry Volume Share (%), by End-user Industry 2024 & 2032
- Figure 55: Europe Cloud Billing Industry Revenue (Million), by Country 2024 & 2032
- Figure 56: Europe Cloud Billing Industry Volume (K Unit), by Country 2024 & 2032
- Figure 57: Europe Cloud Billing Industry Revenue Share (%), by Country 2024 & 2032
- Figure 58: Europe Cloud Billing Industry Volume Share (%), by Country 2024 & 2032
- Figure 59: Asia Pacific Cloud Billing Industry Revenue (Million), by Deployment 2024 & 2032
- Figure 60: Asia Pacific Cloud Billing Industry Volume (K Unit), by Deployment 2024 & 2032
- Figure 61: Asia Pacific Cloud Billing Industry Revenue Share (%), by Deployment 2024 & 2032
- Figure 62: Asia Pacific Cloud Billing Industry Volume Share (%), by Deployment 2024 & 2032
- Figure 63: Asia Pacific Cloud Billing Industry Revenue (Million), by Component 2024 & 2032
- Figure 64: Asia Pacific Cloud Billing Industry Volume (K Unit), by Component 2024 & 2032
- Figure 65: Asia Pacific Cloud Billing Industry Revenue Share (%), by Component 2024 & 2032
- Figure 66: Asia Pacific Cloud Billing Industry Volume Share (%), by Component 2024 & 2032
- Figure 67: Asia Pacific Cloud Billing Industry Revenue (Million), by End-user Industry 2024 & 2032
- Figure 68: Asia Pacific Cloud Billing Industry Volume (K Unit), by End-user Industry 2024 & 2032
- Figure 69: Asia Pacific Cloud Billing Industry Revenue Share (%), by End-user Industry 2024 & 2032
- Figure 70: Asia Pacific Cloud Billing Industry Volume Share (%), by End-user Industry 2024 & 2032
- Figure 71: Asia Pacific Cloud Billing Industry Revenue (Million), by Country 2024 & 2032
- Figure 72: Asia Pacific Cloud Billing Industry Volume (K Unit), by Country 2024 & 2032
- Figure 73: Asia Pacific Cloud Billing Industry Revenue Share (%), by Country 2024 & 2032
- Figure 74: Asia Pacific Cloud Billing Industry Volume Share (%), by Country 2024 & 2032
- Figure 75: Latin America Cloud Billing Industry Revenue (Million), by Deployment 2024 & 2032
- Figure 76: Latin America Cloud Billing Industry Volume (K Unit), by Deployment 2024 & 2032
- Figure 77: Latin America Cloud Billing Industry Revenue Share (%), by Deployment 2024 & 2032
- Figure 78: Latin America Cloud Billing Industry Volume Share (%), by Deployment 2024 & 2032
- Figure 79: Latin America Cloud Billing Industry Revenue (Million), by Component 2024 & 2032
- Figure 80: Latin America Cloud Billing Industry Volume (K Unit), by Component 2024 & 2032
- Figure 81: Latin America Cloud Billing Industry Revenue Share (%), by Component 2024 & 2032
- Figure 82: Latin America Cloud Billing Industry Volume Share (%), by Component 2024 & 2032
- Figure 83: Latin America Cloud Billing Industry Revenue (Million), by End-user Industry 2024 & 2032
- Figure 84: Latin America Cloud Billing Industry Volume (K Unit), by End-user Industry 2024 & 2032
- Figure 85: Latin America Cloud Billing Industry Revenue Share (%), by End-user Industry 2024 & 2032
- Figure 86: Latin America Cloud Billing Industry Volume Share (%), by End-user Industry 2024 & 2032
- Figure 87: Latin America Cloud Billing Industry Revenue (Million), by Country 2024 & 2032
- Figure 88: Latin America Cloud Billing Industry Volume (K Unit), by Country 2024 & 2032
- Figure 89: Latin America Cloud Billing Industry Revenue Share (%), by Country 2024 & 2032
- Figure 90: Latin America Cloud Billing Industry Volume Share (%), by Country 2024 & 2032
- Figure 91: Middle East Cloud Billing Industry Revenue (Million), by Deployment 2024 & 2032
- Figure 92: Middle East Cloud Billing Industry Volume (K Unit), by Deployment 2024 & 2032
- Figure 93: Middle East Cloud Billing Industry Revenue Share (%), by Deployment 2024 & 2032
- Figure 94: Middle East Cloud Billing Industry Volume Share (%), by Deployment 2024 & 2032
- Figure 95: Middle East Cloud Billing Industry Revenue (Million), by Component 2024 & 2032
- Figure 96: Middle East Cloud Billing Industry Volume (K Unit), by Component 2024 & 2032
- Figure 97: Middle East Cloud Billing Industry Revenue Share (%), by Component 2024 & 2032
- Figure 98: Middle East Cloud Billing Industry Volume Share (%), by Component 2024 & 2032
- Figure 99: Middle East Cloud Billing Industry Revenue (Million), by End-user Industry 2024 & 2032
- Figure 100: Middle East Cloud Billing Industry Volume (K Unit), by End-user Industry 2024 & 2032
- Figure 101: Middle East Cloud Billing Industry Revenue Share (%), by End-user Industry 2024 & 2032
- Figure 102: Middle East Cloud Billing Industry Volume Share (%), by End-user Industry 2024 & 2032
- Figure 103: Middle East Cloud Billing Industry Revenue (Million), by Country 2024 & 2032
- Figure 104: Middle East Cloud Billing Industry Volume (K Unit), by Country 2024 & 2032
- Figure 105: Middle East Cloud Billing Industry Revenue Share (%), by Country 2024 & 2032
- Figure 106: Middle East Cloud Billing Industry Volume Share (%), by Country 2024 & 2032
- Figure 107: United Arab Emirates Cloud Billing Industry Revenue (Million), by Deployment 2024 & 2032
- Figure 108: United Arab Emirates Cloud Billing Industry Volume (K Unit), by Deployment 2024 & 2032
- Figure 109: United Arab Emirates Cloud Billing Industry Revenue Share (%), by Deployment 2024 & 2032
- Figure 110: United Arab Emirates Cloud Billing Industry Volume Share (%), by Deployment 2024 & 2032
- Figure 111: United Arab Emirates Cloud Billing Industry Revenue (Million), by Component 2024 & 2032
- Figure 112: United Arab Emirates Cloud Billing Industry Volume (K Unit), by Component 2024 & 2032
- Figure 113: United Arab Emirates Cloud Billing Industry Revenue Share (%), by Component 2024 & 2032
- Figure 114: United Arab Emirates Cloud Billing Industry Volume Share (%), by Component 2024 & 2032
- Figure 115: United Arab Emirates Cloud Billing Industry Revenue (Million), by End-user Industry 2024 & 2032
- Figure 116: United Arab Emirates Cloud Billing Industry Volume (K Unit), by End-user Industry 2024 & 2032
- Figure 117: United Arab Emirates Cloud Billing Industry Revenue Share (%), by End-user Industry 2024 & 2032
- Figure 118: United Arab Emirates Cloud Billing Industry Volume Share (%), by End-user Industry 2024 & 2032
- Figure 119: United Arab Emirates Cloud Billing Industry Revenue (Million), by Country 2024 & 2032
- Figure 120: United Arab Emirates Cloud Billing Industry Volume (K Unit), by Country 2024 & 2032
- Figure 121: United Arab Emirates Cloud Billing Industry Revenue Share (%), by Country 2024 & 2032
- Figure 122: United Arab Emirates Cloud Billing Industry Volume Share (%), by Country 2024 & 2032
List of Tables
- Table 1: Global Cloud Billing Industry Revenue Million Forecast, by Region 2019 & 2032
- Table 2: Global Cloud Billing Industry Volume K Unit Forecast, by Region 2019 & 2032
- Table 3: Global Cloud Billing Industry Revenue Million Forecast, by Deployment 2019 & 2032
- Table 4: Global Cloud Billing Industry Volume K Unit Forecast, by Deployment 2019 & 2032
- Table 5: Global Cloud Billing Industry Revenue Million Forecast, by Component 2019 & 2032
- Table 6: Global Cloud Billing Industry Volume K Unit Forecast, by Component 2019 & 2032
- Table 7: Global Cloud Billing Industry Revenue Million Forecast, by End-user Industry 2019 & 2032
- Table 8: Global Cloud Billing Industry Volume K Unit Forecast, by End-user Industry 2019 & 2032
- Table 9: Global Cloud Billing Industry Revenue Million Forecast, by Region 2019 & 2032
- Table 10: Global Cloud Billing Industry Volume K Unit Forecast, by Region 2019 & 2032
- Table 11: Global Cloud Billing Industry Revenue Million Forecast, by Country 2019 & 2032
- Table 12: Global Cloud Billing Industry Volume K Unit Forecast, by Country 2019 & 2032
- Table 13: United States Cloud Billing Industry Revenue (Million) Forecast, by Application 2019 & 2032
- Table 14: United States Cloud Billing Industry Volume (K Unit) Forecast, by Application 2019 & 2032
- Table 15: Canada Cloud Billing Industry Revenue (Million) Forecast, by Application 2019 & 2032
- Table 16: Canada Cloud Billing Industry Volume (K Unit) Forecast, by Application 2019 & 2032
- Table 17: Mexico Cloud Billing Industry Revenue (Million) Forecast, by Application 2019 & 2032
- Table 18: Mexico Cloud Billing Industry Volume (K Unit) Forecast, by Application 2019 & 2032
- Table 19: Global Cloud Billing Industry Revenue Million Forecast, by Country 2019 & 2032
- Table 20: Global Cloud Billing Industry Volume K Unit Forecast, by Country 2019 & 2032
- Table 21: Germany Cloud Billing Industry Revenue (Million) Forecast, by Application 2019 & 2032
- Table 22: Germany Cloud Billing Industry Volume (K Unit) Forecast, by Application 2019 & 2032
- Table 23: United Kingdom Cloud Billing Industry Revenue (Million) Forecast, by Application 2019 & 2032
- Table 24: United Kingdom Cloud Billing Industry Volume (K Unit) Forecast, by Application 2019 & 2032
- Table 25: France Cloud Billing Industry Revenue (Million) Forecast, by Application 2019 & 2032
- Table 26: France Cloud Billing Industry Volume (K Unit) Forecast, by Application 2019 & 2032
- Table 27: Spain Cloud Billing Industry Revenue (Million) Forecast, by Application 2019 & 2032
- Table 28: Spain Cloud Billing Industry Volume (K Unit) Forecast, by Application 2019 & 2032
- Table 29: Italy Cloud Billing Industry Revenue (Million) Forecast, by Application 2019 & 2032
- Table 30: Italy Cloud Billing Industry Volume (K Unit) Forecast, by Application 2019 & 2032
- Table 31: Spain Cloud Billing Industry Revenue (Million) Forecast, by Application 2019 & 2032
- Table 32: Spain Cloud Billing Industry Volume (K Unit) Forecast, by Application 2019 & 2032
- Table 33: Belgium Cloud Billing Industry Revenue (Million) Forecast, by Application 2019 & 2032
- Table 34: Belgium Cloud Billing Industry Volume (K Unit) Forecast, by Application 2019 & 2032
- Table 35: Netherland Cloud Billing Industry Revenue (Million) Forecast, by Application 2019 & 2032
- Table 36: Netherland Cloud Billing Industry Volume (K Unit) Forecast, by Application 2019 & 2032
- Table 37: Nordics Cloud Billing Industry Revenue (Million) Forecast, by Application 2019 & 2032
- Table 38: Nordics Cloud Billing Industry Volume (K Unit) Forecast, by Application 2019 & 2032
- Table 39: Rest of Europe Cloud Billing Industry Revenue (Million) Forecast, by Application 2019 & 2032
- Table 40: Rest of Europe Cloud Billing Industry Volume (K Unit) Forecast, by Application 2019 & 2032
- Table 41: Global Cloud Billing Industry Revenue Million Forecast, by Country 2019 & 2032
- Table 42: Global Cloud Billing Industry Volume K Unit Forecast, by Country 2019 & 2032
- Table 43: China Cloud Billing Industry Revenue (Million) Forecast, by Application 2019 & 2032
- Table 44: China Cloud Billing Industry Volume (K Unit) Forecast, by Application 2019 & 2032
- Table 45: Japan Cloud Billing Industry Revenue (Million) Forecast, by Application 2019 & 2032
- Table 46: Japan Cloud Billing Industry Volume (K Unit) Forecast, by Application 2019 & 2032
- Table 47: India Cloud Billing Industry Revenue (Million) Forecast, by Application 2019 & 2032
- Table 48: India Cloud Billing Industry Volume (K Unit) Forecast, by Application 2019 & 2032
- Table 49: South Korea Cloud Billing Industry Revenue (Million) Forecast, by Application 2019 & 2032
- Table 50: South Korea Cloud Billing Industry Volume (K Unit) Forecast, by Application 2019 & 2032
- Table 51: Southeast Asia Cloud Billing Industry Revenue (Million) Forecast, by Application 2019 & 2032
- Table 52: Southeast Asia Cloud Billing Industry Volume (K Unit) Forecast, by Application 2019 & 2032
- Table 53: Australia Cloud Billing Industry Revenue (Million) Forecast, by Application 2019 & 2032
- Table 54: Australia Cloud Billing Industry Volume (K Unit) Forecast, by Application 2019 & 2032
- Table 55: Indonesia Cloud Billing Industry Revenue (Million) Forecast, by Application 2019 & 2032
- Table 56: Indonesia Cloud Billing Industry Volume (K Unit) Forecast, by Application 2019 & 2032
- Table 57: Phillipes Cloud Billing Industry Revenue (Million) Forecast, by Application 2019 & 2032
- Table 58: Phillipes Cloud Billing Industry Volume (K Unit) Forecast, by Application 2019 & 2032
- Table 59: Singapore Cloud Billing Industry Revenue (Million) Forecast, by Application 2019 & 2032
- Table 60: Singapore Cloud Billing Industry Volume (K Unit) Forecast, by Application 2019 & 2032
- Table 61: Thailandc Cloud Billing Industry Revenue (Million) Forecast, by Application 2019 & 2032
- Table 62: Thailandc Cloud Billing Industry Volume (K Unit) Forecast, by Application 2019 & 2032
- Table 63: Rest of Asia Pacific Cloud Billing Industry Revenue (Million) Forecast, by Application 2019 & 2032
- Table 64: Rest of Asia Pacific Cloud Billing Industry Volume (K Unit) Forecast, by Application 2019 & 2032
- Table 65: Global Cloud Billing Industry Revenue Million Forecast, by Country 2019 & 2032
- Table 66: Global Cloud Billing Industry Volume K Unit Forecast, by Country 2019 & 2032
- Table 67: Brazil Cloud Billing Industry Revenue (Million) Forecast, by Application 2019 & 2032
- Table 68: Brazil Cloud Billing Industry Volume (K Unit) Forecast, by Application 2019 & 2032
- Table 69: Argentina Cloud Billing Industry Revenue (Million) Forecast, by Application 2019 & 2032
- Table 70: Argentina Cloud Billing Industry Volume (K Unit) Forecast, by Application 2019 & 2032
- Table 71: Peru Cloud Billing Industry Revenue (Million) Forecast, by Application 2019 & 2032
- Table 72: Peru Cloud Billing Industry Volume (K Unit) Forecast, by Application 2019 & 2032
- Table 73: Chile Cloud Billing Industry Revenue (Million) Forecast, by Application 2019 & 2032
- Table 74: Chile Cloud Billing Industry Volume (K Unit) Forecast, by Application 2019 & 2032
- Table 75: Colombia Cloud Billing Industry Revenue (Million) Forecast, by Application 2019 & 2032
- Table 76: Colombia Cloud Billing Industry Volume (K Unit) Forecast, by Application 2019 & 2032
- Table 77: Ecuador Cloud Billing Industry Revenue (Million) Forecast, by Application 2019 & 2032
- Table 78: Ecuador Cloud Billing Industry Volume (K Unit) Forecast, by Application 2019 & 2032
- Table 79: Venezuela Cloud Billing Industry Revenue (Million) Forecast, by Application 2019 & 2032
- Table 80: Venezuela Cloud Billing Industry Volume (K Unit) Forecast, by Application 2019 & 2032
- Table 81: Rest of South America Cloud Billing Industry Revenue (Million) Forecast, by Application 2019 & 2032
- Table 82: Rest of South America Cloud Billing Industry Volume (K Unit) Forecast, by Application 2019 & 2032
- Table 83: Global Cloud Billing Industry Revenue Million Forecast, by Country 2019 & 2032
- Table 84: Global Cloud Billing Industry Volume K Unit Forecast, by Country 2019 & 2032
- Table 85: United States Cloud Billing Industry Revenue (Million) Forecast, by Application 2019 & 2032
- Table 86: United States Cloud Billing Industry Volume (K Unit) Forecast, by Application 2019 & 2032
- Table 87: Canada Cloud Billing Industry Revenue (Million) Forecast, by Application 2019 & 2032
- Table 88: Canada Cloud Billing Industry Volume (K Unit) Forecast, by Application 2019 & 2032
- Table 89: Mexico Cloud Billing Industry Revenue (Million) Forecast, by Application 2019 & 2032
- Table 90: Mexico Cloud Billing Industry Volume (K Unit) Forecast, by Application 2019 & 2032
- Table 91: Global Cloud Billing Industry Revenue Million Forecast, by Country 2019 & 2032
- Table 92: Global Cloud Billing Industry Volume K Unit Forecast, by Country 2019 & 2032
- Table 93: United Arab Emirates Cloud Billing Industry Revenue (Million) Forecast, by Application 2019 & 2032
- Table 94: United Arab Emirates Cloud Billing Industry Volume (K Unit) Forecast, by Application 2019 & 2032
- Table 95: Saudi Arabia Cloud Billing Industry Revenue (Million) Forecast, by Application 2019 & 2032
- Table 96: Saudi Arabia Cloud Billing Industry Volume (K Unit) Forecast, by Application 2019 & 2032
- Table 97: South Africa Cloud Billing Industry Revenue (Million) Forecast, by Application 2019 & 2032
- Table 98: South Africa Cloud Billing Industry Volume (K Unit) Forecast, by Application 2019 & 2032
- Table 99: Rest of Middle East and Africa Cloud Billing Industry Revenue (Million) Forecast, by Application 2019 & 2032
- Table 100: Rest of Middle East and Africa Cloud Billing Industry Volume (K Unit) Forecast, by Application 2019 & 2032
- Table 101: Global Cloud Billing Industry Revenue Million Forecast, by Deployment 2019 & 2032
- Table 102: Global Cloud Billing Industry Volume K Unit Forecast, by Deployment 2019 & 2032
- Table 103: Global Cloud Billing Industry Revenue Million Forecast, by Component 2019 & 2032
- Table 104: Global Cloud Billing Industry Volume K Unit Forecast, by Component 2019 & 2032
- Table 105: Global Cloud Billing Industry Revenue Million Forecast, by End-user Industry 2019 & 2032
- Table 106: Global Cloud Billing Industry Volume K Unit Forecast, by End-user Industry 2019 & 2032
- Table 107: Global Cloud Billing Industry Revenue Million Forecast, by Country 2019 & 2032
- Table 108: Global Cloud Billing Industry Volume K Unit Forecast, by Country 2019 & 2032
- Table 109: United States Cloud Billing Industry Revenue (Million) Forecast, by Application 2019 & 2032
- Table 110: United States Cloud Billing Industry Volume (K Unit) Forecast, by Application 2019 & 2032
- Table 111: Canada Cloud Billing Industry Revenue (Million) Forecast, by Application 2019 & 2032
- Table 112: Canada Cloud Billing Industry Volume (K Unit) Forecast, by Application 2019 & 2032
- Table 113: Global Cloud Billing Industry Revenue Million Forecast, by Deployment 2019 & 2032
- Table 114: Global Cloud Billing Industry Volume K Unit Forecast, by Deployment 2019 & 2032
- Table 115: Global Cloud Billing Industry Revenue Million Forecast, by Component 2019 & 2032
- Table 116: Global Cloud Billing Industry Volume K Unit Forecast, by Component 2019 & 2032
- Table 117: Global Cloud Billing Industry Revenue Million Forecast, by End-user Industry 2019 & 2032
- Table 118: Global Cloud Billing Industry Volume K Unit Forecast, by End-user Industry 2019 & 2032
- Table 119: Global Cloud Billing Industry Revenue Million Forecast, by Country 2019 & 2032
- Table 120: Global Cloud Billing Industry Volume K Unit Forecast, by Country 2019 & 2032
- Table 121: United Kingdom Cloud Billing Industry Revenue (Million) Forecast, by Application 2019 & 2032
- Table 122: United Kingdom Cloud Billing Industry Volume (K Unit) Forecast, by Application 2019 & 2032
- Table 123: Germany Cloud Billing Industry Revenue (Million) Forecast, by Application 2019 & 2032
- Table 124: Germany Cloud Billing Industry Volume (K Unit) Forecast, by Application 2019 & 2032
- Table 125: France Cloud Billing Industry Revenue (Million) Forecast, by Application 2019 & 2032
- Table 126: France Cloud Billing Industry Volume (K Unit) Forecast, by Application 2019 & 2032
- Table 127: Rest of Europe Cloud Billing Industry Revenue (Million) Forecast, by Application 2019 & 2032
- Table 128: Rest of Europe Cloud Billing Industry Volume (K Unit) Forecast, by Application 2019 & 2032
- Table 129: Global Cloud Billing Industry Revenue Million Forecast, by Deployment 2019 & 2032
- Table 130: Global Cloud Billing Industry Volume K Unit Forecast, by Deployment 2019 & 2032
- Table 131: Global Cloud Billing Industry Revenue Million Forecast, by Component 2019 & 2032
- Table 132: Global Cloud Billing Industry Volume K Unit Forecast, by Component 2019 & 2032
- Table 133: Global Cloud Billing Industry Revenue Million Forecast, by End-user Industry 2019 & 2032
- Table 134: Global Cloud Billing Industry Volume K Unit Forecast, by End-user Industry 2019 & 2032
- Table 135: Global Cloud Billing Industry Revenue Million Forecast, by Country 2019 & 2032
- Table 136: Global Cloud Billing Industry Volume K Unit Forecast, by Country 2019 & 2032
- Table 137: China Cloud Billing Industry Revenue (Million) Forecast, by Application 2019 & 2032
- Table 138: China Cloud Billing Industry Volume (K Unit) Forecast, by Application 2019 & 2032
- Table 139: India Cloud Billing Industry Revenue (Million) Forecast, by Application 2019 & 2032
- Table 140: India Cloud Billing Industry Volume (K Unit) Forecast, by Application 2019 & 2032
- Table 141: South Korea Cloud Billing Industry Revenue (Million) Forecast, by Application 2019 & 2032
- Table 142: South Korea Cloud Billing Industry Volume (K Unit) Forecast, by Application 2019 & 2032
- Table 143: Rest of Asia Pacific Cloud Billing Industry Revenue (Million) Forecast, by Application 2019 & 2032
- Table 144: Rest of Asia Pacific Cloud Billing Industry Volume (K Unit) Forecast, by Application 2019 & 2032
- Table 145: Global Cloud Billing Industry Revenue Million Forecast, by Deployment 2019 & 2032
- Table 146: Global Cloud Billing Industry Volume K Unit Forecast, by Deployment 2019 & 2032
- Table 147: Global Cloud Billing Industry Revenue Million Forecast, by Component 2019 & 2032
- Table 148: Global Cloud Billing Industry Volume K Unit Forecast, by Component 2019 & 2032
- Table 149: Global Cloud Billing Industry Revenue Million Forecast, by End-user Industry 2019 & 2032
- Table 150: Global Cloud Billing Industry Volume K Unit Forecast, by End-user Industry 2019 & 2032
- Table 151: Global Cloud Billing Industry Revenue Million Forecast, by Country 2019 & 2032
- Table 152: Global Cloud Billing Industry Volume K Unit Forecast, by Country 2019 & 2032
- Table 153: Brazil Cloud Billing Industry Revenue (Million) Forecast, by Application 2019 & 2032
- Table 154: Brazil Cloud Billing Industry Volume (K Unit) Forecast, by Application 2019 & 2032
- Table 155: Mexico Cloud Billing Industry Revenue (Million) Forecast, by Application 2019 & 2032
- Table 156: Mexico Cloud Billing Industry Volume (K Unit) Forecast, by Application 2019 & 2032
- Table 157: Rest of Latin America Cloud Billing Industry Revenue (Million) Forecast, by Application 2019 & 2032
- Table 158: Rest of Latin America Cloud Billing Industry Volume (K Unit) Forecast, by Application 2019 & 2032
- Table 159: Global Cloud Billing Industry Revenue Million Forecast, by Deployment 2019 & 2032
- Table 160: Global Cloud Billing Industry Volume K Unit Forecast, by Deployment 2019 & 2032
- Table 161: Global Cloud Billing Industry Revenue Million Forecast, by Component 2019 & 2032
- Table 162: Global Cloud Billing Industry Volume K Unit Forecast, by Component 2019 & 2032
- Table 163: Global Cloud Billing Industry Revenue Million Forecast, by End-user Industry 2019 & 2032
- Table 164: Global Cloud Billing Industry Volume K Unit Forecast, by End-user Industry 2019 & 2032
- Table 165: Global Cloud Billing Industry Revenue Million Forecast, by Country 2019 & 2032
- Table 166: Global Cloud Billing Industry Volume K Unit Forecast, by Country 2019 & 2032
- Table 167: Global Cloud Billing Industry Revenue Million Forecast, by Deployment 2019 & 2032
- Table 168: Global Cloud Billing Industry Volume K Unit Forecast, by Deployment 2019 & 2032
- Table 169: Global Cloud Billing Industry Revenue Million Forecast, by Component 2019 & 2032
- Table 170: Global Cloud Billing Industry Volume K Unit Forecast, by Component 2019 & 2032
- Table 171: Global Cloud Billing Industry Revenue Million Forecast, by End-user Industry 2019 & 2032
- Table 172: Global Cloud Billing Industry Volume K Unit Forecast, by End-user Industry 2019 & 2032
- Table 173: Global Cloud Billing Industry Revenue Million Forecast, by Country 2019 & 2032
- Table 174: Global Cloud Billing Industry Volume K Unit Forecast, by Country 2019 & 2032
- Table 175: South Africa Cloud Billing Industry Revenue (Million) Forecast, by Application 2019 & 2032
- Table 176: South Africa Cloud Billing Industry Volume (K Unit) Forecast, by Application 2019 & 2032
- Table 177: Saudi Arabia Cloud Billing Industry Revenue (Million) Forecast, by Application 2019 & 2032
- Table 178: Saudi Arabia Cloud Billing Industry Volume (K Unit) Forecast, by Application 2019 & 2032
- Table 179: Rest of Middle East Cloud Billing Industry Revenue (Million) Forecast, by Application 2019 & 2032
- Table 180: Rest of Middle East Cloud Billing Industry Volume (K Unit) Forecast, by Application 2019 & 2032
Frequently Asked Questions
1. What is the projected Compound Annual Growth Rate (CAGR) of the Cloud Billing Industry?
The projected CAGR is approximately 23.00%.
2. Which companies are prominent players in the Cloud Billing Industry?
Key companies in the market include Zuora Inc , ARIA Systems INC, Telefonaktiebolaget LM Ericsson, FinancialForce, Microsoft Corporation, Amazon Web Services Inc, Oracle Corporation, BillingPlatform, Orbitera Inc, SAP SE.
3. What are the main segments of the Cloud Billing Industry?
The market segments include Deployment, Component, End-user Industry.
4. Can you provide details about the market size?
The market size is estimated to be USD XX Million as of 2022.
5. What are some drivers contributing to market growth?
Increasing Adoption of Cloud Computing; Growth in E-commerce Platforms.
6. What are the notable trends driving market growth?
Retail Sector Expected to Show Maximum Application.
7. Are there any restraints impacting market growth?
Transition From On-Premise to Cloud-Based Solutions; High Costs Involved and Data Privacy Issues.
8. Can you provide examples of recent developments in the market?
January 2023: Input 1 is a pioneer in payments, digital billing, and premium financing solutions. HawkSoft, a supplier of insurance technologies for agency management systems, announced a strategic agreement to allow premium collecting capability for HawkSoft agencies. For more than 30 years, Input 1 has improved its comprehensive payments and billing platform, which reduces the complexity of the full lifecycle of premium collecting. Input 1 services are used by more than 125 carriers, financial organizations, managing general agents, and thousands of insurance agents to collect and bill premiums from their clients.
9. What pricing options are available for accessing the report?
Pricing options include single-user, multi-user, and enterprise licenses priced at USD 4750, USD 5250, and USD 8750 respectively.
10. Is the market size provided in terms of value or volume?
The market size is provided in terms of value, measured in Million and volume, measured in K Unit.
11. Are there any specific market keywords associated with the report?
Yes, the market keyword associated with the report is "Cloud Billing Industry," which aids in identifying and referencing the specific market segment covered.
12. How do I determine which pricing option suits my needs best?
The pricing options vary based on user requirements and access needs. Individual users may opt for single-user licenses, while businesses requiring broader access may choose multi-user or enterprise licenses for cost-effective access to the report.
13. Are there any additional resources or data provided in the Cloud Billing Industry report?
While the report offers comprehensive insights, it's advisable to review the specific contents or supplementary materials provided to ascertain if additional resources or data are available.
14. How can I stay updated on further developments or reports in the Cloud Billing Industry?
To stay informed about further developments, trends, and reports in the Cloud Billing Industry, consider subscribing to industry newsletters, following relevant companies and organizations, or regularly checking reputable industry news sources and publications.
Methodology
Step 1 - Identification of Relevant Samples Size from Population Database


Step 2 - Approaches for Defining Global Market Size (Value, Volume* & Price*)

Note*: In applicable scenarios
Step 3 - Data Sources
Primary Research
- Web Analytics
- Survey Reports
- Research Institute
- Latest Research Reports
- Opinion Leaders
Secondary Research
- Annual Reports
- White Paper
- Latest Press Release
- Industry Association
- Paid Database
- Investor Presentations

Step 4 - Data Triangulation
Involves using different sources of information in order to increase the validity of a study
These sources are likely to be stakeholders in a program - participants, other researchers, program staff, other community members, and so on.
Then we put all data in single framework & apply various statistical tools to find out the dynamic on the market.
During the analysis stage, feedback from the stakeholder groups would be compared to determine areas of agreement as well as areas of divergence
