

Key Insights
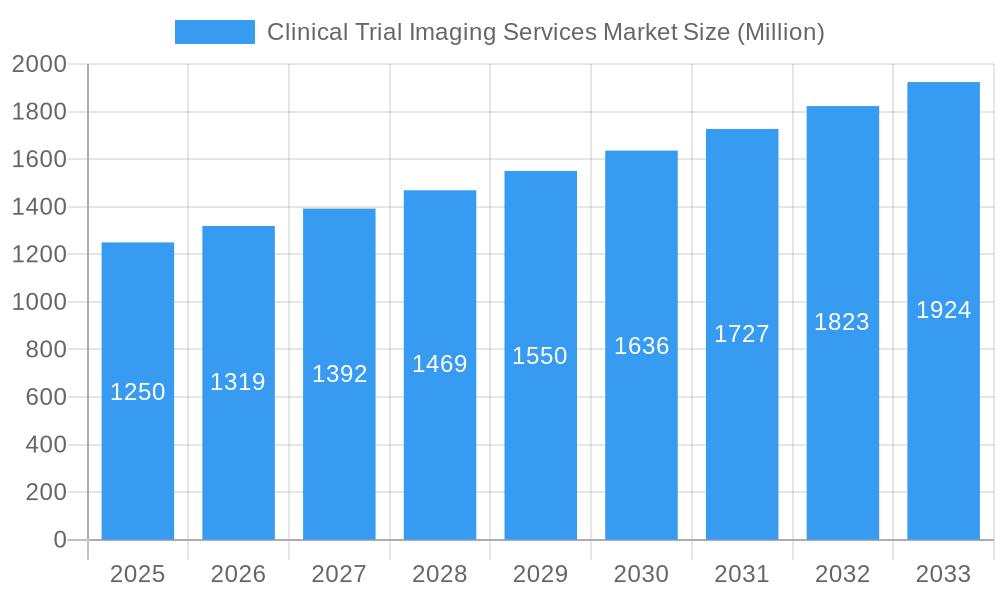
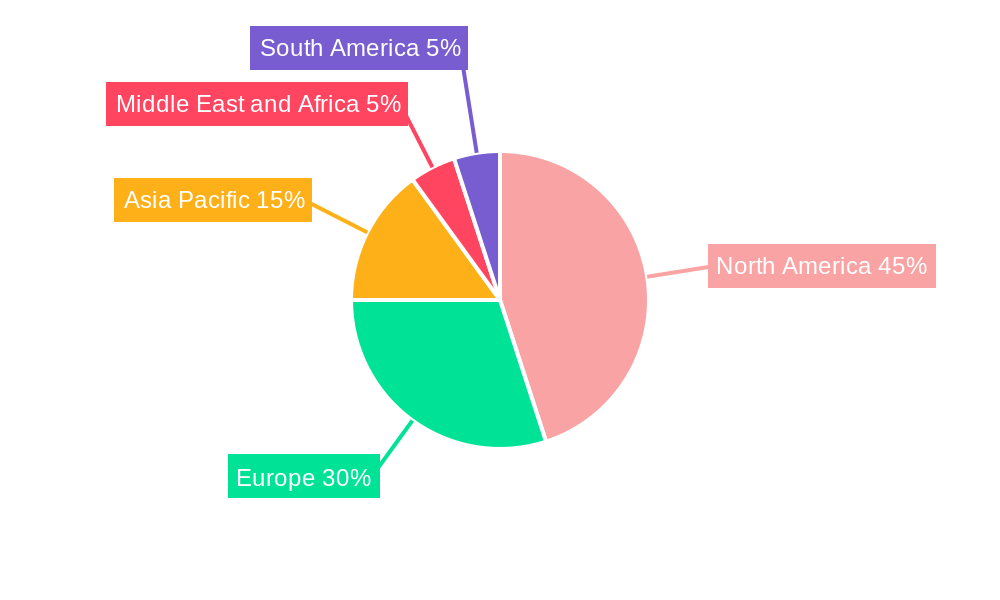
The Clinical Trial Imaging Services market, valued at $1.25 billion in 2025, is projected to experience robust growth, driven by several key factors. The increasing prevalence of chronic diseases necessitates more sophisticated clinical trials, leading to a greater demand for advanced imaging technologies like MRI, CT, and PET scans to assess treatment efficacy and safety. Technological advancements, such as AI-powered image analysis and improved resolution imaging modalities, are further enhancing the precision and efficiency of clinical trials, boosting market growth. The growing outsourcing trend within the pharmaceutical and biotechnology sectors, coupled with the rising number of clinical trials globally, contributes significantly to market expansion. Furthermore, the increasing focus on personalized medicine necessitates more detailed imaging data, further fueling demand for specialized imaging services and advanced analytical tools. The market is segmented by product and service (Trial Design Consulting, Read Analysis, Operational Imaging, Imaging Software), modality (MRI, CT, Ultrasound, PET, X-Ray, Echocardiography), and end-user (Pharmaceutical & Biotech Companies, Medical Device Manufacturers, Academic & Government Research Institutes). North America currently holds a dominant market share due to its advanced healthcare infrastructure and high concentration of pharmaceutical companies and research institutions. However, Asia Pacific is expected to witness significant growth in the coming years, driven by rising healthcare expenditure and an expanding clinical trial landscape in countries like China and India.
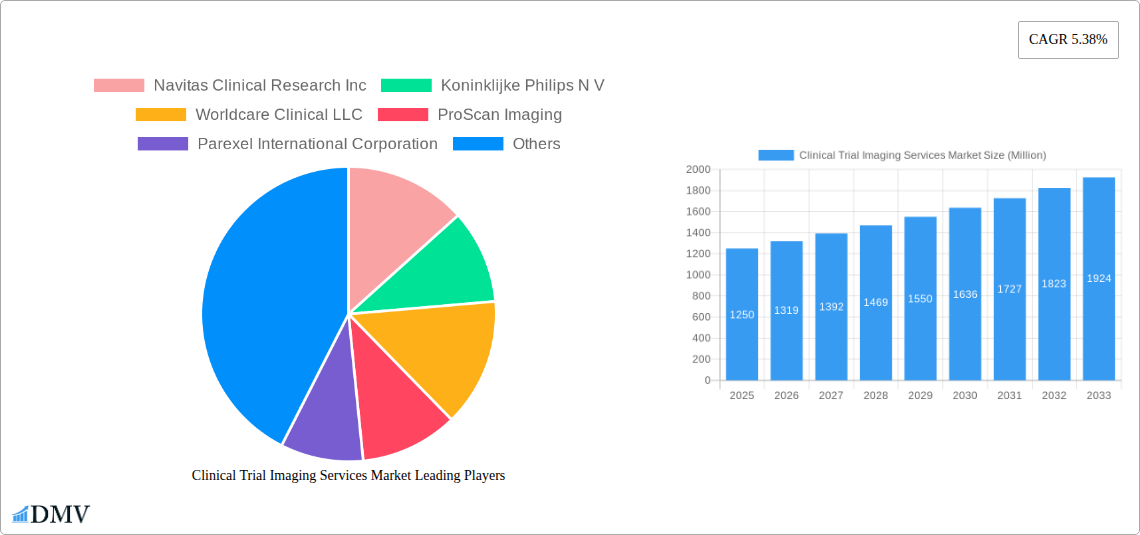
Clinical Trial Imaging Services Market Market Size (In Billion)
Despite the promising outlook, the market faces certain challenges. High costs associated with advanced imaging technologies and specialized services can present a barrier to entry for some smaller players. Stringent regulatory requirements and data privacy concerns also necessitate substantial investment in compliance and security measures. The reliance on highly skilled professionals for image analysis and interpretation could potentially lead to shortages in talent in the future. However, ongoing technological advancements, increasing collaboration among stakeholders, and innovative business models are expected to mitigate these challenges and sustain market growth throughout the forecast period (2025-2033). The consistent CAGR of 5.38% reflects this positive long-term outlook.
Clinical Trial Imaging Services Market Company Market Share
Clinical Trial Imaging Services Market: A Comprehensive Report (2019-2033)
This insightful report provides a detailed analysis of the Clinical Trial Imaging Services market, offering a comprehensive overview of its current state, future trajectory, and key players. With a study period spanning 2019-2033, a base year of 2025, and a forecast period of 2025-2033, this report is an invaluable resource for stakeholders seeking to understand and capitalize on the opportunities within this dynamic market. The market is projected to reach xx Million by 2033, showcasing significant growth potential.
Clinical Trial Imaging Services Market Market Composition & Trends
This section delves into the intricate landscape of the Clinical Trial Imaging Services market, evaluating its concentration, innovation drivers, regulatory environment, substitute products, end-user profiles, and merger & acquisition (M&A) activities. The market exhibits a moderately concentrated structure, with a few major players commanding significant market share. However, the emergence of innovative startups and technological advancements is fostering increased competition.
Market Share Distribution (Estimated 2025):
- Top 5 Players: 60%
- Next 10 Players: 30%
- Remaining Players: 10%
Innovation Catalysts: Advances in imaging technologies, such as AI-powered image analysis and improved resolution, are significantly impacting the market. Regulatory changes, particularly those streamlining the approval process for new imaging modalities, are also driving innovation.
Regulatory Landscape: Stringent regulations regarding data privacy and image security necessitate compliance measures, influencing market dynamics and operational costs.
Substitute Products: While imaging remains essential, cost-effective alternatives and advancements in other diagnostic techniques present potential competitive pressures.
End-User Profiles: The market is driven primarily by Pharmaceutical & Biotechnology Companies, followed by Medical Device Manufacturers and Academic and Government Research Institutes.
M&A Activities: The past five years have witnessed several significant M&A deals, with an estimated total value of xx Million. These activities reflect the strategic consolidation efforts within the market. Examples include: (Specific examples of M&A activities, if available, would be inserted here).
Clinical Trial Imaging Services Market Industry Evolution
The Clinical Trial Imaging Services market has experienced robust growth over the historical period (2019-2024), driven by factors such as the rising prevalence of chronic diseases, increasing demand for personalized medicine, and technological advancements in imaging techniques. The market is witnessing a shift towards advanced imaging modalities, including PET and MRI, fueled by their superior diagnostic capabilities. The adoption rate of AI-powered image analysis tools is also increasing steadily, further augmenting market expansion.
The average annual growth rate (AAGR) during the historical period was xx%, and is projected to be xx% during the forecast period (2025-2033). This growth is attributed to the increasing number of clinical trials, the growing preference for non-invasive diagnostic procedures, and the rising investments in research and development. The market is also experiencing a gradual shift in consumer demand, with an increasing focus on faster turnaround times, higher image quality, and cost-effective solutions.
Leading Regions, Countries, or Segments in Clinical Trial Imaging Services Market
North America currently dominates the Clinical Trial Imaging Services market, accounting for approximately xx% of the global market share in 2025. This dominance is primarily attributed to the high concentration of pharmaceutical and biotechnology companies, robust research infrastructure, and favorable regulatory environment.
Key Drivers:
- High Investment in R&D: Significant investments in research and development activities are driving innovation and market expansion.
- Strong Regulatory Support: Supportive regulatory frameworks are facilitating the adoption of new technologies and services.
- High Concentration of Clinical Trials: The region hosts a large number of clinical trials, thereby fueling the demand for imaging services.
Leading Segments:
- Product/Service: Operational Imaging Services currently holds the largest market share, followed by Read Analysis Services and Imaging Software. The growth of Trial Design Consulting Services is also significant.
- Modality: Magnetic Resonance Imaging (MRI) and Computed Tomography (CT) are the leading modalities, driven by their widespread use in clinical trials. However, the adoption of Positron Emission Tomography (PET) is rapidly increasing.
- End-User: Pharmaceutical & Biotechnology Companies represent the largest end-user segment, contributing significantly to market growth.
Clinical Trial Imaging Services Market Product Innovations
Recent product innovations include AI-powered image analysis platforms that automate image interpretation, reducing turnaround times and improving diagnostic accuracy. Advanced imaging modalities, such as high-resolution MRI and advanced PET scanners, are also being introduced, enhancing the quality of images and enabling more precise diagnoses. The incorporation of cloud-based platforms for image storage and sharing improves collaboration and data management efficiency. These innovations offer unique selling propositions such as increased speed, enhanced accuracy, and improved workflow efficiency.
Propelling Factors for Clinical Trial Imaging Services Market Growth
Several factors are driving the growth of the Clinical Trial Imaging Services market. Technological advancements, particularly in AI and imaging modalities, are improving diagnostic accuracy and efficiency. The increasing number of clinical trials worldwide, fuelled by a rise in chronic diseases, provides substantial market impetus. Moreover, favorable regulatory support and increasing investments in healthcare infrastructure contribute significantly to this market expansion. Specific examples include the FDA's approval of new imaging techniques and increased funding for clinical research.
Obstacles in the Clinical Trial Imaging Services Market Market
The Clinical Trial Imaging Services market faces certain obstacles. Strict regulatory requirements concerning data privacy and image security increase operational costs and complexities. Supply chain disruptions due to global events can impact the availability and cost of imaging equipment and consumables. Intense competition among established players and new entrants adds further pressure on pricing and margins. These factors collectively might limit the market growth by approximately xx% in the forecast period.
Future Opportunities in Clinical Trial Imaging Services Market
The future holds significant opportunities. Expansion into emerging markets, especially in Asia and Latin America, presents considerable potential. The integration of advanced technologies like blockchain for secure data management and the development of personalized imaging solutions tailored to specific patient needs are also poised for significant growth. Furthermore, a growing demand for remote imaging services driven by telehealth advancements will shape the future of this market.
Major Players in the Clinical Trial Imaging Services Market Ecosystem
- Navitas Clinical Research Inc
- Koninklijke Philips N V
- Worldcare Clinical LLC
- ProScan Imaging
- Parexel International Corporation
- Radiant Sage LLC
- WIRB-Copernicus Group
- Ixico PLC
- Clario
- Resonance Health
- Medpace
- Icon PLC
Key Developments in Clinical Trial Imaging Services Market Industry
- May 2022: Bruker launched innovative 7 Tesla and 9.4 Tesla conduction-cooled Maxwell magnets for its preclinical MRI systems, enhancing research capabilities.
- March 2022: Fujifilm India unveiled a new range of CT, MRI, and ultrasound machines, expanding its product portfolio and market presence in India.
Strategic Clinical Trial Imaging Services Market Market Forecast
The Clinical Trial Imaging Services market is poised for sustained growth, driven by technological advancements, increasing clinical trial activity, and expanding healthcare infrastructure. The market's future potential is significant, with opportunities in new modalities, AI-powered analysis, and personalized medicine driving further expansion. Strategic partnerships, acquisitions, and technological innovation will play key roles in shaping the market's competitive landscape and growth trajectory over the forecast period.
Clinical Trial Imaging Services Market Segmentation
-
1. Product and Service
- 1.1. Trial Design Consulting Services
- 1.2. Read Analysis Services
- 1.3. Operational Imaging Services
- 1.4. Imaging Software
-
2. Modality
- 2.1. Magnetic Resonance Imaging
- 2.2. Computed Tomography
- 2.3. Ultrasound
- 2.4. Positron Emission Tomography
- 2.5. X-Ray
- 2.6. Echocardiography
- 2.7. Other Modalities
-
3. End-User
- 3.1. Pharmaceutical & Biotechnology Companies
- 3.2. Medical Device Manufacturers
- 3.3. Academic and Government Research Institutes
Clinical Trial Imaging Services Market Segmentation By Geography
-
1. North America
- 1.1. United States
- 1.2. Canada
- 1.3. Mexico
-
2. Europe
- 2.1. Germany
- 2.2. United Kingdom
- 2.3. France
- 2.4. Italy
- 2.5. Spain
- 2.6. Rest of Europe
-
3. Asia Pacific
- 3.1. China
- 3.2. Japan
- 3.3. India
- 3.4. Australia
- 3.5. South Korea
- 3.6. Rest of Asia Pacific
-
4. Middle East and Africa
- 4.1. GCC
- 4.2. South Africa
- 4.3. Rest of Middle East and Africa
-
5. South America
- 5.1. Brazil
- 5.2. Argentina
- 5.3. Rest of South America
Clinical Trial Imaging Services Market Regional Market Share
Geographic Coverage of Clinical Trial Imaging Services Market
Clinical Trial Imaging Services Market REPORT HIGHLIGHTS
| Aspects | Details |
|---|---|
| Study Period | 2020-2034 |
| Base Year | 2025 |
| Estimated Year | 2026 |
| Forecast Period | 2026-2034 |
| Historical Period | 2020-2025 |
| Growth Rate | CAGR of 5.38% from 2020-2034 |
| Segmentation |
|
Table of Contents
- 1. Introduction
- 1.1. Research Scope
- 1.2. Market Segmentation
- 1.3. Research Objective
- 1.4. Definitions and Assumptions
- 2. Executive Summary
- 2.1. Market Snapshot
- 3. Market Dynamics
- 3.1. Market Drivers
- 3.2. Market Restrains
- 3.3. Market Trends
- 3.4. Market Opportunities
- 4. Market Factor Analysis
- 4.1. Porters Five Forces
- 4.1.1. Bargaining Power of Suppliers
- 4.1.2. Bargaining Power of Buyers
- 4.1.3. Threat of New Entrants
- 4.1.4. Threat of Substitutes
- 4.1.5. Competitive Rivalry
- 4.2. PESTEL analysis
- 4.3. BCG Analysis
- 4.3.1. Stars (High Growth, High Market Share)
- 4.3.2. Cash Cows (Low Growth, High Market Share)
- 4.3.3. Question Mark (High Growth, Low Market Share)
- 4.3.4. Dogs (Low Growth, Low Market Share)
- 4.4. Ansoff Matrix Analysis
- 4.5. Supply Chain Analysis
- 4.6. Regulatory Landscape
- 4.7. Current Market Potential and Opportunity Assessment (TAM–SAM–SOM Framework)
- 4.8. DMV Analyst Note
- 4.1. Porters Five Forces
- 5. Market Analysis, Insights and Forecast 2021-2033
- 5.1. Market Analysis, Insights and Forecast - by Product and Service
- 5.1.1. Trial Design Consulting Services
- 5.1.2. Read Analysis Services
- 5.1.3. Operational Imaging Services
- 5.1.4. Imaging Software
- 5.2. Market Analysis, Insights and Forecast - by Modality
- 5.2.1. Magnetic Resonance Imaging
- 5.2.2. Computed Tomography
- 5.2.3. Ultrasound
- 5.2.4. Positron Emission Tomography
- 5.2.5. X-Ray
- 5.2.6. Echocardiography
- 5.2.7. Other Modalities
- 5.3. Market Analysis, Insights and Forecast - by End-User
- 5.3.1. Pharmaceutical & Biotechnology Companies
- 5.3.2. Medical Device Manufacturers
- 5.3.3. Academic and Government Research Institutes
- 5.4. Market Analysis, Insights and Forecast - by Region
- 5.4.1. North America
- 5.4.2. Europe
- 5.4.3. Asia Pacific
- 5.4.4. Middle East and Africa
- 5.4.5. South America
- 5.1. Market Analysis, Insights and Forecast - by Product and Service
- 6. Global Clinical Trial Imaging Services Market Analysis, Insights and Forecast, 2021-2033
- 6.1. Market Analysis, Insights and Forecast - by Product and Service
- 6.1.1. Trial Design Consulting Services
- 6.1.2. Read Analysis Services
- 6.1.3. Operational Imaging Services
- 6.1.4. Imaging Software
- 6.2. Market Analysis, Insights and Forecast - by Modality
- 6.2.1. Magnetic Resonance Imaging
- 6.2.2. Computed Tomography
- 6.2.3. Ultrasound
- 6.2.4. Positron Emission Tomography
- 6.2.5. X-Ray
- 6.2.6. Echocardiography
- 6.2.7. Other Modalities
- 6.3. Market Analysis, Insights and Forecast - by End-User
- 6.3.1. Pharmaceutical & Biotechnology Companies
- 6.3.2. Medical Device Manufacturers
- 6.3.3. Academic and Government Research Institutes
- 6.1. Market Analysis, Insights and Forecast - by Product and Service
- 7. North America Clinical Trial Imaging Services Market Analysis, Insights and Forecast, 2020-2032
- 7.1. Market Analysis, Insights and Forecast - by Product and Service
- 7.1.1. Trial Design Consulting Services
- 7.1.2. Read Analysis Services
- 7.1.3. Operational Imaging Services
- 7.1.4. Imaging Software
- 7.2. Market Analysis, Insights and Forecast - by Modality
- 7.2.1. Magnetic Resonance Imaging
- 7.2.2. Computed Tomography
- 7.2.3. Ultrasound
- 7.2.4. Positron Emission Tomography
- 7.2.5. X-Ray
- 7.2.6. Echocardiography
- 7.2.7. Other Modalities
- 7.3. Market Analysis, Insights and Forecast - by End-User
- 7.3.1. Pharmaceutical & Biotechnology Companies
- 7.3.2. Medical Device Manufacturers
- 7.3.3. Academic and Government Research Institutes
- 7.1. Market Analysis, Insights and Forecast - by Product and Service
- 8. Europe Clinical Trial Imaging Services Market Analysis, Insights and Forecast, 2020-2032
- 8.1. Market Analysis, Insights and Forecast - by Product and Service
- 8.1.1. Trial Design Consulting Services
- 8.1.2. Read Analysis Services
- 8.1.3. Operational Imaging Services
- 8.1.4. Imaging Software
- 8.2. Market Analysis, Insights and Forecast - by Modality
- 8.2.1. Magnetic Resonance Imaging
- 8.2.2. Computed Tomography
- 8.2.3. Ultrasound
- 8.2.4. Positron Emission Tomography
- 8.2.5. X-Ray
- 8.2.6. Echocardiography
- 8.2.7. Other Modalities
- 8.3. Market Analysis, Insights and Forecast - by End-User
- 8.3.1. Pharmaceutical & Biotechnology Companies
- 8.3.2. Medical Device Manufacturers
- 8.3.3. Academic and Government Research Institutes
- 8.1. Market Analysis, Insights and Forecast - by Product and Service
- 9. Asia Pacific Clinical Trial Imaging Services Market Analysis, Insights and Forecast, 2020-2032
- 9.1. Market Analysis, Insights and Forecast - by Product and Service
- 9.1.1. Trial Design Consulting Services
- 9.1.2. Read Analysis Services
- 9.1.3. Operational Imaging Services
- 9.1.4. Imaging Software
- 9.2. Market Analysis, Insights and Forecast - by Modality
- 9.2.1. Magnetic Resonance Imaging
- 9.2.2. Computed Tomography
- 9.2.3. Ultrasound
- 9.2.4. Positron Emission Tomography
- 9.2.5. X-Ray
- 9.2.6. Echocardiography
- 9.2.7. Other Modalities
- 9.3. Market Analysis, Insights and Forecast - by End-User
- 9.3.1. Pharmaceutical & Biotechnology Companies
- 9.3.2. Medical Device Manufacturers
- 9.3.3. Academic and Government Research Institutes
- 9.1. Market Analysis, Insights and Forecast - by Product and Service
- 10. Middle East and Africa Clinical Trial Imaging Services Market Analysis, Insights and Forecast, 2020-2032
- 10.1. Market Analysis, Insights and Forecast - by Product and Service
- 10.1.1. Trial Design Consulting Services
- 10.1.2. Read Analysis Services
- 10.1.3. Operational Imaging Services
- 10.1.4. Imaging Software
- 10.2. Market Analysis, Insights and Forecast - by Modality
- 10.2.1. Magnetic Resonance Imaging
- 10.2.2. Computed Tomography
- 10.2.3. Ultrasound
- 10.2.4. Positron Emission Tomography
- 10.2.5. X-Ray
- 10.2.6. Echocardiography
- 10.2.7. Other Modalities
- 10.3. Market Analysis, Insights and Forecast - by End-User
- 10.3.1. Pharmaceutical & Biotechnology Companies
- 10.3.2. Medical Device Manufacturers
- 10.3.3. Academic and Government Research Institutes
- 10.1. Market Analysis, Insights and Forecast - by Product and Service
- 11. South America Clinical Trial Imaging Services Market Analysis, Insights and Forecast, 2020-2032
- 11.1. Market Analysis, Insights and Forecast - by Product and Service
- 11.1.1. Trial Design Consulting Services
- 11.1.2. Read Analysis Services
- 11.1.3. Operational Imaging Services
- 11.1.4. Imaging Software
- 11.2. Market Analysis, Insights and Forecast - by Modality
- 11.2.1. Magnetic Resonance Imaging
- 11.2.2. Computed Tomography
- 11.2.3. Ultrasound
- 11.2.4. Positron Emission Tomography
- 11.2.5. X-Ray
- 11.2.6. Echocardiography
- 11.2.7. Other Modalities
- 11.3. Market Analysis, Insights and Forecast - by End-User
- 11.3.1. Pharmaceutical & Biotechnology Companies
- 11.3.2. Medical Device Manufacturers
- 11.3.3. Academic and Government Research Institutes
- 11.1. Market Analysis, Insights and Forecast - by Product and Service
- 12. Competitive Analysis
- 12.1. Company Profiles
- 12.1.1 Navitas Clinical Research Inc
- 12.1.1.1. Company Overview
- 12.1.1.2. Products
- 12.1.1.3. Company Financials
- 12.1.1.4. SWOT Analysis
- 12.1.2 Koninklijke Philips N V
- 12.1.2.1. Company Overview
- 12.1.2.2. Products
- 12.1.2.3. Company Financials
- 12.1.2.4. SWOT Analysis
- 12.1.3 Worldcare Clinical LLC
- 12.1.3.1. Company Overview
- 12.1.3.2. Products
- 12.1.3.3. Company Financials
- 12.1.3.4. SWOT Analysis
- 12.1.4 ProScan Imaging
- 12.1.4.1. Company Overview
- 12.1.4.2. Products
- 12.1.4.3. Company Financials
- 12.1.4.4. SWOT Analysis
- 12.1.5 Parexel International Corporation
- 12.1.5.1. Company Overview
- 12.1.5.2. Products
- 12.1.5.3. Company Financials
- 12.1.5.4. SWOT Analysis
- 12.1.6 Radiant Sage LLC
- 12.1.6.1. Company Overview
- 12.1.6.2. Products
- 12.1.6.3. Company Financials
- 12.1.6.4. SWOT Analysis
- 12.1.7 WIRB-Copernicus Group
- 12.1.7.1. Company Overview
- 12.1.7.2. Products
- 12.1.7.3. Company Financials
- 12.1.7.4. SWOT Analysis
- 12.1.8 Ixico PLC
- 12.1.8.1. Company Overview
- 12.1.8.2. Products
- 12.1.8.3. Company Financials
- 12.1.8.4. SWOT Analysis
- 12.1.9 Clario
- 12.1.9.1. Company Overview
- 12.1.9.2. Products
- 12.1.9.3. Company Financials
- 12.1.9.4. SWOT Analysis
- 12.1.10 Resonance Health
- 12.1.10.1. Company Overview
- 12.1.10.2. Products
- 12.1.10.3. Company Financials
- 12.1.10.4. SWOT Analysis
- 12.1.11 Medpace
- 12.1.11.1. Company Overview
- 12.1.11.2. Products
- 12.1.11.3. Company Financials
- 12.1.11.4. SWOT Analysis
- 12.1.12 Icon PLC
- 12.1.12.1. Company Overview
- 12.1.12.2. Products
- 12.1.12.3. Company Financials
- 12.1.12.4. SWOT Analysis
- 12.1.1 Navitas Clinical Research Inc
- 12.2. Market Entropy
- 12.2.1 Company's Key Areas Served
- 12.2.2 Recent Developments
- 12.3. Company Market Share Analysis 2025
- 12.3.1 Top 5 Companies Market Share Analysis
- 12.3.2 Top 3 Companies Market Share Analysis
- 12.4. List of Potential Customers
- 13. Research Methodology
List of Figures
- Figure 1: Global Clinical Trial Imaging Services Market Revenue Breakdown (Million, %) by Region 2025 & 2033
- Figure 2: North America Clinical Trial Imaging Services Market Revenue (Million), by Product and Service 2025 & 2033
- Figure 3: North America Clinical Trial Imaging Services Market Revenue Share (%), by Product and Service 2025 & 2033
- Figure 4: North America Clinical Trial Imaging Services Market Revenue (Million), by Modality 2025 & 2033
- Figure 5: North America Clinical Trial Imaging Services Market Revenue Share (%), by Modality 2025 & 2033
- Figure 6: North America Clinical Trial Imaging Services Market Revenue (Million), by End-User 2025 & 2033
- Figure 7: North America Clinical Trial Imaging Services Market Revenue Share (%), by End-User 2025 & 2033
- Figure 8: North America Clinical Trial Imaging Services Market Revenue (Million), by Country 2025 & 2033
- Figure 9: North America Clinical Trial Imaging Services Market Revenue Share (%), by Country 2025 & 2033
- Figure 10: Europe Clinical Trial Imaging Services Market Revenue (Million), by Product and Service 2025 & 2033
- Figure 11: Europe Clinical Trial Imaging Services Market Revenue Share (%), by Product and Service 2025 & 2033
- Figure 12: Europe Clinical Trial Imaging Services Market Revenue (Million), by Modality 2025 & 2033
- Figure 13: Europe Clinical Trial Imaging Services Market Revenue Share (%), by Modality 2025 & 2033
- Figure 14: Europe Clinical Trial Imaging Services Market Revenue (Million), by End-User 2025 & 2033
- Figure 15: Europe Clinical Trial Imaging Services Market Revenue Share (%), by End-User 2025 & 2033
- Figure 16: Europe Clinical Trial Imaging Services Market Revenue (Million), by Country 2025 & 2033
- Figure 17: Europe Clinical Trial Imaging Services Market Revenue Share (%), by Country 2025 & 2033
- Figure 18: Asia Pacific Clinical Trial Imaging Services Market Revenue (Million), by Product and Service 2025 & 2033
- Figure 19: Asia Pacific Clinical Trial Imaging Services Market Revenue Share (%), by Product and Service 2025 & 2033
- Figure 20: Asia Pacific Clinical Trial Imaging Services Market Revenue (Million), by Modality 2025 & 2033
- Figure 21: Asia Pacific Clinical Trial Imaging Services Market Revenue Share (%), by Modality 2025 & 2033
- Figure 22: Asia Pacific Clinical Trial Imaging Services Market Revenue (Million), by End-User 2025 & 2033
- Figure 23: Asia Pacific Clinical Trial Imaging Services Market Revenue Share (%), by End-User 2025 & 2033
- Figure 24: Asia Pacific Clinical Trial Imaging Services Market Revenue (Million), by Country 2025 & 2033
- Figure 25: Asia Pacific Clinical Trial Imaging Services Market Revenue Share (%), by Country 2025 & 2033
- Figure 26: Middle East and Africa Clinical Trial Imaging Services Market Revenue (Million), by Product and Service 2025 & 2033
- Figure 27: Middle East and Africa Clinical Trial Imaging Services Market Revenue Share (%), by Product and Service 2025 & 2033
- Figure 28: Middle East and Africa Clinical Trial Imaging Services Market Revenue (Million), by Modality 2025 & 2033
- Figure 29: Middle East and Africa Clinical Trial Imaging Services Market Revenue Share (%), by Modality 2025 & 2033
- Figure 30: Middle East and Africa Clinical Trial Imaging Services Market Revenue (Million), by End-User 2025 & 2033
- Figure 31: Middle East and Africa Clinical Trial Imaging Services Market Revenue Share (%), by End-User 2025 & 2033
- Figure 32: Middle East and Africa Clinical Trial Imaging Services Market Revenue (Million), by Country 2025 & 2033
- Figure 33: Middle East and Africa Clinical Trial Imaging Services Market Revenue Share (%), by Country 2025 & 2033
- Figure 34: South America Clinical Trial Imaging Services Market Revenue (Million), by Product and Service 2025 & 2033
- Figure 35: South America Clinical Trial Imaging Services Market Revenue Share (%), by Product and Service 2025 & 2033
- Figure 36: South America Clinical Trial Imaging Services Market Revenue (Million), by Modality 2025 & 2033
- Figure 37: South America Clinical Trial Imaging Services Market Revenue Share (%), by Modality 2025 & 2033
- Figure 38: South America Clinical Trial Imaging Services Market Revenue (Million), by End-User 2025 & 2033
- Figure 39: South America Clinical Trial Imaging Services Market Revenue Share (%), by End-User 2025 & 2033
- Figure 40: South America Clinical Trial Imaging Services Market Revenue (Million), by Country 2025 & 2033
- Figure 41: South America Clinical Trial Imaging Services Market Revenue Share (%), by Country 2025 & 2033
List of Tables
- Table 1: Global Clinical Trial Imaging Services Market Revenue Million Forecast, by Product and Service 2020 & 2033
- Table 2: Global Clinical Trial Imaging Services Market Revenue Million Forecast, by Modality 2020 & 2033
- Table 3: Global Clinical Trial Imaging Services Market Revenue Million Forecast, by End-User 2020 & 2033
- Table 4: Global Clinical Trial Imaging Services Market Revenue Million Forecast, by Region 2020 & 2033
- Table 5: Global Clinical Trial Imaging Services Market Revenue Million Forecast, by Product and Service 2020 & 2033
- Table 6: Global Clinical Trial Imaging Services Market Revenue Million Forecast, by Modality 2020 & 2033
- Table 7: Global Clinical Trial Imaging Services Market Revenue Million Forecast, by End-User 2020 & 2033
- Table 8: Global Clinical Trial Imaging Services Market Revenue Million Forecast, by Country 2020 & 2033
- Table 9: United States Clinical Trial Imaging Services Market Revenue (Million) Forecast, by Application 2020 & 2033
- Table 10: Canada Clinical Trial Imaging Services Market Revenue (Million) Forecast, by Application 2020 & 2033
- Table 11: Mexico Clinical Trial Imaging Services Market Revenue (Million) Forecast, by Application 2020 & 2033
- Table 12: Global Clinical Trial Imaging Services Market Revenue Million Forecast, by Product and Service 2020 & 2033
- Table 13: Global Clinical Trial Imaging Services Market Revenue Million Forecast, by Modality 2020 & 2033
- Table 14: Global Clinical Trial Imaging Services Market Revenue Million Forecast, by End-User 2020 & 2033
- Table 15: Global Clinical Trial Imaging Services Market Revenue Million Forecast, by Country 2020 & 2033
- Table 16: Germany Clinical Trial Imaging Services Market Revenue (Million) Forecast, by Application 2020 & 2033
- Table 17: United Kingdom Clinical Trial Imaging Services Market Revenue (Million) Forecast, by Application 2020 & 2033
- Table 18: France Clinical Trial Imaging Services Market Revenue (Million) Forecast, by Application 2020 & 2033
- Table 19: Italy Clinical Trial Imaging Services Market Revenue (Million) Forecast, by Application 2020 & 2033
- Table 20: Spain Clinical Trial Imaging Services Market Revenue (Million) Forecast, by Application 2020 & 2033
- Table 21: Rest of Europe Clinical Trial Imaging Services Market Revenue (Million) Forecast, by Application 2020 & 2033
- Table 22: Global Clinical Trial Imaging Services Market Revenue Million Forecast, by Product and Service 2020 & 2033
- Table 23: Global Clinical Trial Imaging Services Market Revenue Million Forecast, by Modality 2020 & 2033
- Table 24: Global Clinical Trial Imaging Services Market Revenue Million Forecast, by End-User 2020 & 2033
- Table 25: Global Clinical Trial Imaging Services Market Revenue Million Forecast, by Country 2020 & 2033
- Table 26: China Clinical Trial Imaging Services Market Revenue (Million) Forecast, by Application 2020 & 2033
- Table 27: Japan Clinical Trial Imaging Services Market Revenue (Million) Forecast, by Application 2020 & 2033
- Table 28: India Clinical Trial Imaging Services Market Revenue (Million) Forecast, by Application 2020 & 2033
- Table 29: Australia Clinical Trial Imaging Services Market Revenue (Million) Forecast, by Application 2020 & 2033
- Table 30: South Korea Clinical Trial Imaging Services Market Revenue (Million) Forecast, by Application 2020 & 2033
- Table 31: Rest of Asia Pacific Clinical Trial Imaging Services Market Revenue (Million) Forecast, by Application 2020 & 2033
- Table 32: Global Clinical Trial Imaging Services Market Revenue Million Forecast, by Product and Service 2020 & 2033
- Table 33: Global Clinical Trial Imaging Services Market Revenue Million Forecast, by Modality 2020 & 2033
- Table 34: Global Clinical Trial Imaging Services Market Revenue Million Forecast, by End-User 2020 & 2033
- Table 35: Global Clinical Trial Imaging Services Market Revenue Million Forecast, by Country 2020 & 2033
- Table 36: GCC Clinical Trial Imaging Services Market Revenue (Million) Forecast, by Application 2020 & 2033
- Table 37: South Africa Clinical Trial Imaging Services Market Revenue (Million) Forecast, by Application 2020 & 2033
- Table 38: Rest of Middle East and Africa Clinical Trial Imaging Services Market Revenue (Million) Forecast, by Application 2020 & 2033
- Table 39: Global Clinical Trial Imaging Services Market Revenue Million Forecast, by Product and Service 2020 & 2033
- Table 40: Global Clinical Trial Imaging Services Market Revenue Million Forecast, by Modality 2020 & 2033
- Table 41: Global Clinical Trial Imaging Services Market Revenue Million Forecast, by End-User 2020 & 2033
- Table 42: Global Clinical Trial Imaging Services Market Revenue Million Forecast, by Country 2020 & 2033
- Table 43: Brazil Clinical Trial Imaging Services Market Revenue (Million) Forecast, by Application 2020 & 2033
- Table 44: Argentina Clinical Trial Imaging Services Market Revenue (Million) Forecast, by Application 2020 & 2033
- Table 45: Rest of South America Clinical Trial Imaging Services Market Revenue (Million) Forecast, by Application 2020 & 2033
Frequently Asked Questions
1. What is the projected Compound Annual Growth Rate (CAGR) of the Clinical Trial Imaging Services Market?
The projected CAGR is approximately 5.38%.
2. Which companies are prominent players in the Clinical Trial Imaging Services Market?
Key companies in the market include Navitas Clinical Research Inc, Koninklijke Philips N V, Worldcare Clinical LLC, ProScan Imaging, Parexel International Corporation, Radiant Sage LLC, WIRB-Copernicus Group, Ixico PLC, Clario, Resonance Health, Medpace, Icon PLC.
3. What are the main segments of the Clinical Trial Imaging Services Market?
The market segments include Product and Service, Modality, End-User.
4. Can you provide details about the market size?
The market size is estimated to be USD 1.25 Million as of 2022.
5. What are some drivers contributing to market growth?
Increase in R&D Spending by the Pharmaceutical and Biotechnological Companies; Increasing Number of Contract Research Organization & Investment by Them.
6. What are the notable trends driving market growth?
Computed Tomography is Expected to Witness Rapid Growth Over the Forecast Period.
7. Are there any restraints impacting market growth?
High Implementation Barriers and Costs of Imaging Systems.
8. Can you provide examples of recent developments in the market?
In May 2022, at the International Society for Magnetic Resonance in Medicine (ISMRM) 2022 conference, Bruker launched innovative 7 Tesla and 9.4 Tesla conduction-cooled Maxwell magnets for its market-leading preclinical magnetic resonance imaging (MRI) systems portfolio.
9. What pricing options are available for accessing the report?
Pricing options include single-user, multi-user, and enterprise licenses priced at USD 4750, USD 5250, and USD 8750 respectively.
10. Is the market size provided in terms of value or volume?
The market size is provided in terms of value, measured in Million.
11. Are there any specific market keywords associated with the report?
Yes, the market keyword associated with the report is "Clinical Trial Imaging Services Market," which aids in identifying and referencing the specific market segment covered.
12. How do I determine which pricing option suits my needs best?
The pricing options vary based on user requirements and access needs. Individual users may opt for single-user licenses, while businesses requiring broader access may choose multi-user or enterprise licenses for cost-effective access to the report.
13. Are there any additional resources or data provided in the Clinical Trial Imaging Services Market report?
While the report offers comprehensive insights, it's advisable to review the specific contents or supplementary materials provided to ascertain if additional resources or data are available.
14. How can I stay updated on further developments or reports in the Clinical Trial Imaging Services Market?
To stay informed about further developments, trends, and reports in the Clinical Trial Imaging Services Market, consider subscribing to industry newsletters, following relevant companies and organizations, or regularly checking reputable industry news sources and publications.
Methodology
Step 1 - Identification of Relevant Samples Size from Population Database


Step 2 - Approaches for Defining Global Market Size (Value, Volume* & Price*)

Note*: In applicable scenarios
Step 3 - Data Sources
Primary Research
- Web Analytics
- Survey Reports
- Research Institute
- Latest Research Reports
- Opinion Leaders
Secondary Research
- Annual Reports
- White Paper
- Latest Press Release
- Industry Association
- Paid Database
- Investor Presentations

Step 4 - Data Triangulation
Involves using different sources of information in order to increase the validity of a study
These sources are likely to be stakeholders in a program - participants, other researchers, program staff, other community members, and so on.
Then we put all data in single framework & apply various statistical tools to find out the dynamic on the market.
During the analysis stage, feedback from the stakeholder groups would be compared to determine areas of agreement as well as areas of divergence