

Key Insights
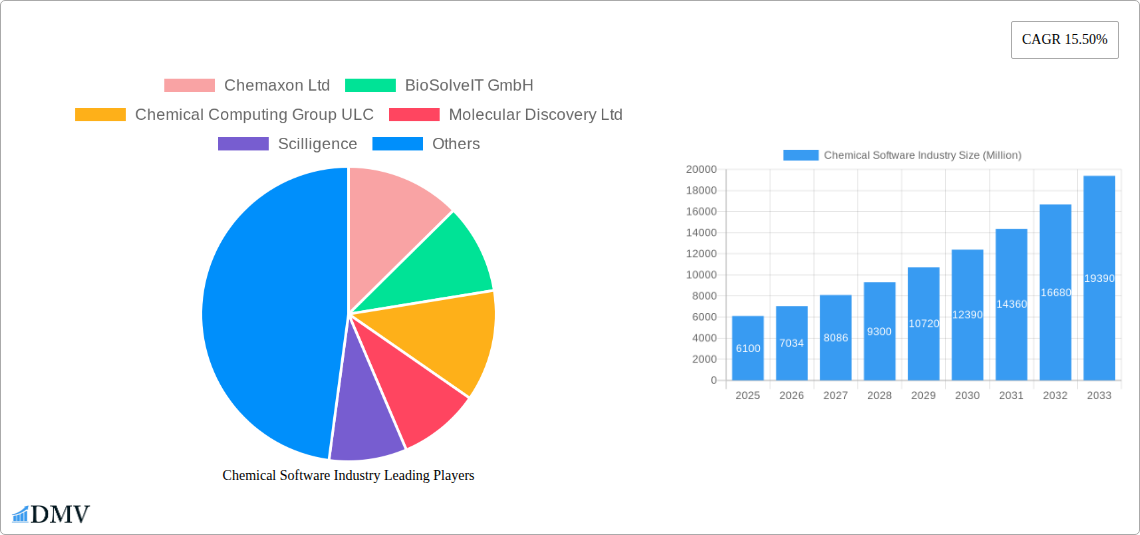
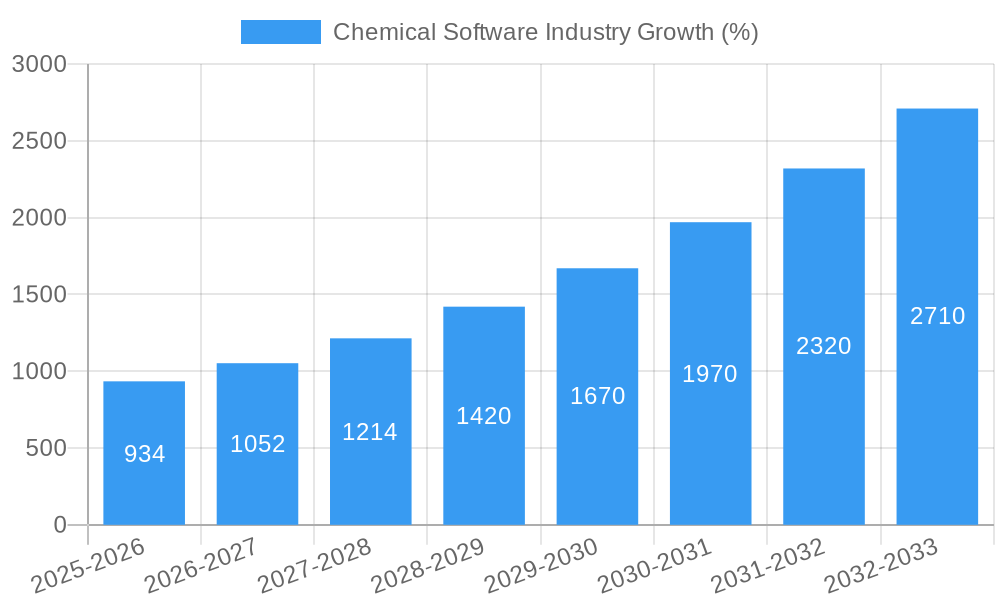
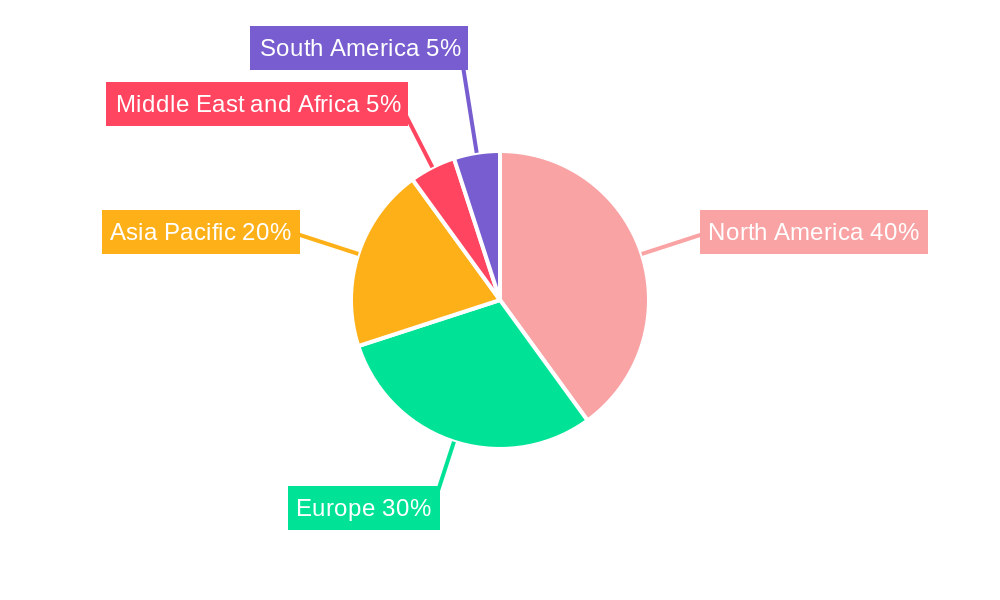
The chemical software market, valued at $6.10 billion in 2025, is projected to experience robust growth, exhibiting a Compound Annual Growth Rate (CAGR) of 15.50% from 2025 to 2033. This expansion is fueled by several key drivers. The increasing complexity of chemical research and development necessitates sophisticated software solutions for tasks such as molecular modeling, simulation, and data analysis. Furthermore, the rising adoption of artificial intelligence (AI) and machine learning (ML) in drug discovery and materials science is significantly boosting market demand. Growing investments in R&D across pharmaceutical, biotechnology, and chemical industries are also contributing to market growth. The market is segmented by application, with chemical analysis (including drug discovery and validation, virtual screening, and other applications) being a major segment. North America currently holds a significant market share due to the presence of established players and robust R&D infrastructure. However, Asia Pacific is expected to witness rapid growth in the coming years, driven by increasing investments in the chemical and pharmaceutical sectors in countries like China and India. Competitive dynamics are shaped by both established players such as Schrödinger, Dassault Systèmes (OpenEye), and Chemaxon, and emerging companies offering specialized solutions.
The market's growth trajectory is also influenced by several trends. The increasing use of cloud-based solutions for chemical software is facilitating greater accessibility and collaboration. Furthermore, the development of user-friendly interfaces and the integration of advanced analytical tools are driving adoption across a broader range of users. However, challenges such as high software costs, the need for specialized training, and data security concerns could potentially restrain market growth. Overcoming these challenges through strategic partnerships, pricing models, and enhanced security measures will be crucial for market players to maintain their competitive edge. The forecast period suggests a significant market expansion, reaching an estimated value well above $20 billion by 2033, highlighting the immense potential of this dynamic sector.
Chemical Software Industry Market Report: 2019-2033
This comprehensive report provides a detailed analysis of the Chemical Software Industry, projecting a market value exceeding $XX Million by 2033. The study covers the period 2019-2033, with 2025 serving as both the base and estimated year. This report is crucial for stakeholders seeking to understand market dynamics, identify growth opportunities, and make informed strategic decisions.
Chemical Software Industry Market Composition & Trends
The Chemical Software market, valued at $XX Million in 2025, exhibits a moderately concentrated landscape with several key players commanding significant market share. Chemaxon Ltd, BioSolveIT GmbH, and Schrödinger Inc. are among the leading companies, collectively holding approximately XX% of the market share in 2025. However, the market is characterized by continuous innovation, driven by advancements in artificial intelligence (AI), machine learning (ML), and high-performance computing (HPC). Stringent regulatory requirements, particularly within the pharmaceutical and environmental sectors, heavily influence market growth. Substitute products, such as manual analysis techniques, pose limited competition due to the efficiency and accuracy offered by chemical software solutions. The primary end-users are pharmaceutical companies, research institutions, and chemical manufacturers. M&A activities have played a significant role, with notable deals exceeding $XX Million in total value during the historical period (2019-2024), primarily driven by companies seeking to expand their product portfolios and technological capabilities.
- Market Share Distribution (2025): Chemaxon Ltd (XX%), BioSolveIT GmbH (XX%), Schrödinger Inc. (XX%), Others (XX%)
- M&A Deal Value (2019-2024): $XX Million
- Key Innovation Catalysts: AI, ML, HPC, Cloud Computing
- Regulatory Landscape: Stringent regulations in pharmaceutical and environmental sectors.
Chemical Software Industry Industry Evolution
The Chemical Software Industry has experienced robust growth over the past five years (2019-2024), exhibiting a Compound Annual Growth Rate (CAGR) of XX%. This growth trajectory is projected to continue during the forecast period (2025-2033), with a CAGR of XX%, reaching a market size exceeding $XX Million by 2033. This expansion is fueled by several factors: increasing adoption of advanced analytical techniques in drug discovery and development, rising demand for efficient virtual screening methods, and growing awareness of the benefits of chemical software in various industries. Technological advancements, such as the integration of AI and ML, have significantly enhanced the capabilities of these software solutions, leading to improved accuracy, speed, and efficiency. The increasing demand for personalized medicine and the need for faster drug development timelines are further driving the adoption of these sophisticated tools. Furthermore, the shifting consumer demands towards environmentally friendly chemicals and processes have spurred the development of specialized chemical software solutions focused on sustainability. The adoption rate of cloud-based chemical software solutions is also increasing significantly, currently at approximately XX% in 2025.
Leading Regions, Countries, or Segments in Chemical Software Industry
North America currently holds the leading position in the Chemical Software market, driven by substantial investments in research and development, a robust pharmaceutical industry, and favorable regulatory support. Europe follows closely behind, benefiting from a strong presence of chemical manufacturers and research institutions. Within application segments, Drug Discovery and Validation is the largest segment, accounting for approximately XX% of the market in 2025, followed by Chemical Analysis and Virtual Screening.
- Key Drivers for North America's Dominance:
- High R&D spending
- Strong pharmaceutical industry
- Favorable regulatory environment
- Key Drivers for Europe's Growth:
- Strong presence of chemical manufacturers
- Significant research infrastructure
- Growing adoption of advanced analytical techniques
- Segment-wise Breakdown (2025): Drug Discovery and Validation (XX%), Chemical Analysis (XX%), Virtual Screening (XX%), Other Applications (XX%)
Chemical Software Industry Product Innovations
Recent innovations in chemical software focus on integrating AI and ML algorithms to improve prediction accuracy and automate complex tasks. These advancements enable faster and more efficient drug discovery, materials design, and environmental monitoring. The emergence of cloud-based platforms enhances accessibility and collaboration, fostering wider adoption across various industries. Unique selling propositions include user-friendly interfaces, seamless integration with existing laboratory instruments, and enhanced data visualization capabilities.
Propelling Factors for Chemical Software Industry Growth
The chemical software market is propelled by several factors: the accelerating adoption of AI and ML in drug discovery and material sciences, increased demand for high-throughput screening and virtual screening methods, the rising need for efficient environmental monitoring and pollution control, and favorable government regulations supporting technological advancements in the chemical industry. The significant investments from both public and private sectors further fuel innovation and market expansion.
Obstacles in the Chemical Software Industry Market
The market faces challenges including high initial investment costs for software and associated hardware, the need for specialized expertise to operate and interpret the results, potential data security and privacy concerns, and the risk of technological obsolescence. Furthermore, intense competition among established players and new entrants can lead to price pressure.
Future Opportunities in Chemical Software Industry
Future opportunities lie in expanding into emerging markets, integrating with Internet of Things (IoT) devices, developing solutions for sustainable chemistry and green technologies, and focusing on niche applications within various industries, such as food and agriculture.
Major Players in the Chemical Software Industry Ecosystem
- Chemaxon Ltd
- BioSolveIT GmbH
- Chemical Computing Group ULC
- Molecular Discovery Ltd
- Scilligence
- Collaborative Drug Discovery Inc
- Jubilant Biosys Ltd
- Cadence Design Systems Inc (OpenEye Scientific Software Inc)
- Schrödinger Inc
- Dassault Systemes
Key Developments in Chemical Software Industry Industry
- October 2023: Cadence Molecular Sciences (OpenEye) announces Pfizer Inc.'s agreement to extend and expand access to Cadence products, highlighting the growing reliance on advanced molecular design software in the pharmaceutical sector.
- June 2023: Vox Biomedical receives funding from NIGMS to develop an AI-based chemical identification library, showcasing the increasing application of AI in chemical analysis.
Strategic Chemical Software Industry Market Forecast
The Chemical Software market is poised for sustained growth, driven by ongoing technological advancements and increasing demand across various industries. The integration of AI, ML, and cloud computing will further enhance the capabilities of these solutions, creating new opportunities and expanding the market's potential. The forecast period (2025-2033) promises robust growth, with the market size expected to exceed $XX Million.
Chemical Software Industry Segmentation
-
1. Application
-
1.1. Chemical Analysis
- 1.1.1. Chemical Databases
- 1.1.2. Chemometrics
- 1.1.3. Molecular Modelling
- 1.1.4. Other Chemical Analysis
- 1.2. Drug Discovery and Validation
- 1.3. Virtual Screening
- 1.4. Other Applications
-
1.1. Chemical Analysis
Chemical Software Industry Segmentation By Geography
-
1. North America
- 1.1. United States
- 1.2. Canada
- 1.3. Mexico
-
2. Europe
- 2.1. Germany
- 2.2. United Kingdom
- 2.3. France
- 2.4. Italy
- 2.5. Spain
- 2.6. Rest of Europe
-
3. Asia Pacific
- 3.1. China
- 3.2. Japan
- 3.3. India
- 3.4. Australia
- 3.5. South Korea
- 3.6. Rest of Asia Pacific
-
4. Middle East and Africa
- 4.1. GCC
- 4.2. South Africa
- 4.3. Rest of Middle East and Africa
-
5. South America
- 5.1. Brazil
- 5.2. Argentina
- 5.3. Rest of South America
Chemical Software Industry REPORT HIGHLIGHTS
| Aspects | Details |
|---|---|
| Study Period | 2019-2033 |
| Base Year | 2024 |
| Estimated Year | 2025 |
| Forecast Period | 2025-2033 |
| Historical Period | 2019-2024 |
| Growth Rate | CAGR of 15.50% from 2019-2033 |
| Segmentation |
|
Table of Contents
- 1. Introduction
- 1.1. Research Scope
- 1.2. Market Segmentation
- 1.3. Research Methodology
- 1.4. Definitions and Assumptions
- 2. Executive Summary
- 2.1. Introduction
- 3. Market Dynamics
- 3.1. Introduction
- 3.2. Market Drivers
- 3.2.1. Innovations and Advancements in the Drug Development Process; Increased Demand of Personalized Medicine
- 3.3. Market Restrains
- 3.3.1. Lack of Skilled Labors
- 3.4. Market Trends
- 3.4.1. Virtual Screening Segment is Expected to Witness Growth in the Market Over the Forecast Period
- 4. Market Factor Analysis
- 4.1. Porters Five Forces
- 4.2. Supply/Value Chain
- 4.3. PESTEL analysis
- 4.4. Market Entropy
- 4.5. Patent/Trademark Analysis
- 5. Global Chemical Software Industry Analysis, Insights and Forecast, 2019-2031
- 5.1. Market Analysis, Insights and Forecast - by Application
- 5.1.1. Chemical Analysis
- 5.1.1.1. Chemical Databases
- 5.1.1.2. Chemometrics
- 5.1.1.3. Molecular Modelling
- 5.1.1.4. Other Chemical Analysis
- 5.1.2. Drug Discovery and Validation
- 5.1.3. Virtual Screening
- 5.1.4. Other Applications
- 5.1.1. Chemical Analysis
- 5.2. Market Analysis, Insights and Forecast - by Region
- 5.2.1. North America
- 5.2.2. Europe
- 5.2.3. Asia Pacific
- 5.2.4. Middle East and Africa
- 5.2.5. South America
- 5.1. Market Analysis, Insights and Forecast - by Application
- 6. North America Chemical Software Industry Analysis, Insights and Forecast, 2019-2031
- 6.1. Market Analysis, Insights and Forecast - by Application
- 6.1.1. Chemical Analysis
- 6.1.1.1. Chemical Databases
- 6.1.1.2. Chemometrics
- 6.1.1.3. Molecular Modelling
- 6.1.1.4. Other Chemical Analysis
- 6.1.2. Drug Discovery and Validation
- 6.1.3. Virtual Screening
- 6.1.4. Other Applications
- 6.1.1. Chemical Analysis
- 6.1. Market Analysis, Insights and Forecast - by Application
- 7. Europe Chemical Software Industry Analysis, Insights and Forecast, 2019-2031
- 7.1. Market Analysis, Insights and Forecast - by Application
- 7.1.1. Chemical Analysis
- 7.1.1.1. Chemical Databases
- 7.1.1.2. Chemometrics
- 7.1.1.3. Molecular Modelling
- 7.1.1.4. Other Chemical Analysis
- 7.1.2. Drug Discovery and Validation
- 7.1.3. Virtual Screening
- 7.1.4. Other Applications
- 7.1.1. Chemical Analysis
- 7.1. Market Analysis, Insights and Forecast - by Application
- 8. Asia Pacific Chemical Software Industry Analysis, Insights and Forecast, 2019-2031
- 8.1. Market Analysis, Insights and Forecast - by Application
- 8.1.1. Chemical Analysis
- 8.1.1.1. Chemical Databases
- 8.1.1.2. Chemometrics
- 8.1.1.3. Molecular Modelling
- 8.1.1.4. Other Chemical Analysis
- 8.1.2. Drug Discovery and Validation
- 8.1.3. Virtual Screening
- 8.1.4. Other Applications
- 8.1.1. Chemical Analysis
- 8.1. Market Analysis, Insights and Forecast - by Application
- 9. Middle East and Africa Chemical Software Industry Analysis, Insights and Forecast, 2019-2031
- 9.1. Market Analysis, Insights and Forecast - by Application
- 9.1.1. Chemical Analysis
- 9.1.1.1. Chemical Databases
- 9.1.1.2. Chemometrics
- 9.1.1.3. Molecular Modelling
- 9.1.1.4. Other Chemical Analysis
- 9.1.2. Drug Discovery and Validation
- 9.1.3. Virtual Screening
- 9.1.4. Other Applications
- 9.1.1. Chemical Analysis
- 9.1. Market Analysis, Insights and Forecast - by Application
- 10. South America Chemical Software Industry Analysis, Insights and Forecast, 2019-2031
- 10.1. Market Analysis, Insights and Forecast - by Application
- 10.1.1. Chemical Analysis
- 10.1.1.1. Chemical Databases
- 10.1.1.2. Chemometrics
- 10.1.1.3. Molecular Modelling
- 10.1.1.4. Other Chemical Analysis
- 10.1.2. Drug Discovery and Validation
- 10.1.3. Virtual Screening
- 10.1.4. Other Applications
- 10.1.1. Chemical Analysis
- 10.1. Market Analysis, Insights and Forecast - by Application
- 11. North America Chemical Software Industry Analysis, Insights and Forecast, 2019-2031
- 11.1. Market Analysis, Insights and Forecast - By Country/Sub-region
- 11.1.1 United States
- 11.1.2 Canada
- 11.1.3 Mexico
- 12. Europe Chemical Software Industry Analysis, Insights and Forecast, 2019-2031
- 12.1. Market Analysis, Insights and Forecast - By Country/Sub-region
- 12.1.1 Germany
- 12.1.2 United Kingdom
- 12.1.3 France
- 12.1.4 Italy
- 12.1.5 Spain
- 12.1.6 Rest of Europe
- 13. Asia Pacific Chemical Software Industry Analysis, Insights and Forecast, 2019-2031
- 13.1. Market Analysis, Insights and Forecast - By Country/Sub-region
- 13.1.1 China
- 13.1.2 Japan
- 13.1.3 India
- 13.1.4 Australia
- 13.1.5 South Korea
- 13.1.6 Rest of Asia Pacific
- 14. Middle East and Africa Chemical Software Industry Analysis, Insights and Forecast, 2019-2031
- 14.1. Market Analysis, Insights and Forecast - By Country/Sub-region
- 14.1.1 GCC
- 14.1.2 South Africa
- 14.1.3 Rest of Middle East and Africa
- 15. South America Chemical Software Industry Analysis, Insights and Forecast, 2019-2031
- 15.1. Market Analysis, Insights and Forecast - By Country/Sub-region
- 15.1.1 Brazil
- 15.1.2 Argentina
- 15.1.3 Rest of South America
- 16. Competitive Analysis
- 16.1. Global Market Share Analysis 2024
- 16.2. Company Profiles
- 16.2.1 Chemaxon Ltd
- 16.2.1.1. Overview
- 16.2.1.2. Products
- 16.2.1.3. SWOT Analysis
- 16.2.1.4. Recent Developments
- 16.2.1.5. Financials (Based on Availability)
- 16.2.2 BioSolveIT GmbH
- 16.2.2.1. Overview
- 16.2.2.2. Products
- 16.2.2.3. SWOT Analysis
- 16.2.2.4. Recent Developments
- 16.2.2.5. Financials (Based on Availability)
- 16.2.3 Chemical Computing Group ULC
- 16.2.3.1. Overview
- 16.2.3.2. Products
- 16.2.3.3. SWOT Analysis
- 16.2.3.4. Recent Developments
- 16.2.3.5. Financials (Based on Availability)
- 16.2.4 Molecular Discovery Ltd
- 16.2.4.1. Overview
- 16.2.4.2. Products
- 16.2.4.3. SWOT Analysis
- 16.2.4.4. Recent Developments
- 16.2.4.5. Financials (Based on Availability)
- 16.2.5 Scilligence
- 16.2.5.1. Overview
- 16.2.5.2. Products
- 16.2.5.3. SWOT Analysis
- 16.2.5.4. Recent Developments
- 16.2.5.5. Financials (Based on Availability)
- 16.2.6 Collaborative Drug Discovery Inc
- 16.2.6.1. Overview
- 16.2.6.2. Products
- 16.2.6.3. SWOT Analysis
- 16.2.6.4. Recent Developments
- 16.2.6.5. Financials (Based on Availability)
- 16.2.7 Jubilant Biosys Ltd
- 16.2.7.1. Overview
- 16.2.7.2. Products
- 16.2.7.3. SWOT Analysis
- 16.2.7.4. Recent Developments
- 16.2.7.5. Financials (Based on Availability)
- 16.2.8 Cadence Design Systems Inc (OpenEye Scientific Software Inc )
- 16.2.8.1. Overview
- 16.2.8.2. Products
- 16.2.8.3. SWOT Analysis
- 16.2.8.4. Recent Developments
- 16.2.8.5. Financials (Based on Availability)
- 16.2.9 Schrödinger Inc
- 16.2.9.1. Overview
- 16.2.9.2. Products
- 16.2.9.3. SWOT Analysis
- 16.2.9.4. Recent Developments
- 16.2.9.5. Financials (Based on Availability)
- 16.2.10 Dassault Systemes
- 16.2.10.1. Overview
- 16.2.10.2. Products
- 16.2.10.3. SWOT Analysis
- 16.2.10.4. Recent Developments
- 16.2.10.5. Financials (Based on Availability)
- 16.2.1 Chemaxon Ltd
List of Figures
- Figure 1: Global Chemical Software Industry Revenue Breakdown (Million, %) by Region 2024 & 2032
- Figure 2: North America Chemical Software Industry Revenue (Million), by Country 2024 & 2032
- Figure 3: North America Chemical Software Industry Revenue Share (%), by Country 2024 & 2032
- Figure 4: Europe Chemical Software Industry Revenue (Million), by Country 2024 & 2032
- Figure 5: Europe Chemical Software Industry Revenue Share (%), by Country 2024 & 2032
- Figure 6: Asia Pacific Chemical Software Industry Revenue (Million), by Country 2024 & 2032
- Figure 7: Asia Pacific Chemical Software Industry Revenue Share (%), by Country 2024 & 2032
- Figure 8: Middle East and Africa Chemical Software Industry Revenue (Million), by Country 2024 & 2032
- Figure 9: Middle East and Africa Chemical Software Industry Revenue Share (%), by Country 2024 & 2032
- Figure 10: South America Chemical Software Industry Revenue (Million), by Country 2024 & 2032
- Figure 11: South America Chemical Software Industry Revenue Share (%), by Country 2024 & 2032
- Figure 12: North America Chemical Software Industry Revenue (Million), by Application 2024 & 2032
- Figure 13: North America Chemical Software Industry Revenue Share (%), by Application 2024 & 2032
- Figure 14: North America Chemical Software Industry Revenue (Million), by Country 2024 & 2032
- Figure 15: North America Chemical Software Industry Revenue Share (%), by Country 2024 & 2032
- Figure 16: Europe Chemical Software Industry Revenue (Million), by Application 2024 & 2032
- Figure 17: Europe Chemical Software Industry Revenue Share (%), by Application 2024 & 2032
- Figure 18: Europe Chemical Software Industry Revenue (Million), by Country 2024 & 2032
- Figure 19: Europe Chemical Software Industry Revenue Share (%), by Country 2024 & 2032
- Figure 20: Asia Pacific Chemical Software Industry Revenue (Million), by Application 2024 & 2032
- Figure 21: Asia Pacific Chemical Software Industry Revenue Share (%), by Application 2024 & 2032
- Figure 22: Asia Pacific Chemical Software Industry Revenue (Million), by Country 2024 & 2032
- Figure 23: Asia Pacific Chemical Software Industry Revenue Share (%), by Country 2024 & 2032
- Figure 24: Middle East and Africa Chemical Software Industry Revenue (Million), by Application 2024 & 2032
- Figure 25: Middle East and Africa Chemical Software Industry Revenue Share (%), by Application 2024 & 2032
- Figure 26: Middle East and Africa Chemical Software Industry Revenue (Million), by Country 2024 & 2032
- Figure 27: Middle East and Africa Chemical Software Industry Revenue Share (%), by Country 2024 & 2032
- Figure 28: South America Chemical Software Industry Revenue (Million), by Application 2024 & 2032
- Figure 29: South America Chemical Software Industry Revenue Share (%), by Application 2024 & 2032
- Figure 30: South America Chemical Software Industry Revenue (Million), by Country 2024 & 2032
- Figure 31: South America Chemical Software Industry Revenue Share (%), by Country 2024 & 2032
List of Tables
- Table 1: Global Chemical Software Industry Revenue Million Forecast, by Region 2019 & 2032
- Table 2: Global Chemical Software Industry Revenue Million Forecast, by Application 2019 & 2032
- Table 3: Global Chemical Software Industry Revenue Million Forecast, by Region 2019 & 2032
- Table 4: Global Chemical Software Industry Revenue Million Forecast, by Country 2019 & 2032
- Table 5: United States Chemical Software Industry Revenue (Million) Forecast, by Application 2019 & 2032
- Table 6: Canada Chemical Software Industry Revenue (Million) Forecast, by Application 2019 & 2032
- Table 7: Mexico Chemical Software Industry Revenue (Million) Forecast, by Application 2019 & 2032
- Table 8: Global Chemical Software Industry Revenue Million Forecast, by Country 2019 & 2032
- Table 9: Germany Chemical Software Industry Revenue (Million) Forecast, by Application 2019 & 2032
- Table 10: United Kingdom Chemical Software Industry Revenue (Million) Forecast, by Application 2019 & 2032
- Table 11: France Chemical Software Industry Revenue (Million) Forecast, by Application 2019 & 2032
- Table 12: Italy Chemical Software Industry Revenue (Million) Forecast, by Application 2019 & 2032
- Table 13: Spain Chemical Software Industry Revenue (Million) Forecast, by Application 2019 & 2032
- Table 14: Rest of Europe Chemical Software Industry Revenue (Million) Forecast, by Application 2019 & 2032
- Table 15: Global Chemical Software Industry Revenue Million Forecast, by Country 2019 & 2032
- Table 16: China Chemical Software Industry Revenue (Million) Forecast, by Application 2019 & 2032
- Table 17: Japan Chemical Software Industry Revenue (Million) Forecast, by Application 2019 & 2032
- Table 18: India Chemical Software Industry Revenue (Million) Forecast, by Application 2019 & 2032
- Table 19: Australia Chemical Software Industry Revenue (Million) Forecast, by Application 2019 & 2032
- Table 20: South Korea Chemical Software Industry Revenue (Million) Forecast, by Application 2019 & 2032
- Table 21: Rest of Asia Pacific Chemical Software Industry Revenue (Million) Forecast, by Application 2019 & 2032
- Table 22: Global Chemical Software Industry Revenue Million Forecast, by Country 2019 & 2032
- Table 23: GCC Chemical Software Industry Revenue (Million) Forecast, by Application 2019 & 2032
- Table 24: South Africa Chemical Software Industry Revenue (Million) Forecast, by Application 2019 & 2032
- Table 25: Rest of Middle East and Africa Chemical Software Industry Revenue (Million) Forecast, by Application 2019 & 2032
- Table 26: Global Chemical Software Industry Revenue Million Forecast, by Country 2019 & 2032
- Table 27: Brazil Chemical Software Industry Revenue (Million) Forecast, by Application 2019 & 2032
- Table 28: Argentina Chemical Software Industry Revenue (Million) Forecast, by Application 2019 & 2032
- Table 29: Rest of South America Chemical Software Industry Revenue (Million) Forecast, by Application 2019 & 2032
- Table 30: Global Chemical Software Industry Revenue Million Forecast, by Application 2019 & 2032
- Table 31: Global Chemical Software Industry Revenue Million Forecast, by Country 2019 & 2032
- Table 32: United States Chemical Software Industry Revenue (Million) Forecast, by Application 2019 & 2032
- Table 33: Canada Chemical Software Industry Revenue (Million) Forecast, by Application 2019 & 2032
- Table 34: Mexico Chemical Software Industry Revenue (Million) Forecast, by Application 2019 & 2032
- Table 35: Global Chemical Software Industry Revenue Million Forecast, by Application 2019 & 2032
- Table 36: Global Chemical Software Industry Revenue Million Forecast, by Country 2019 & 2032
- Table 37: Germany Chemical Software Industry Revenue (Million) Forecast, by Application 2019 & 2032
- Table 38: United Kingdom Chemical Software Industry Revenue (Million) Forecast, by Application 2019 & 2032
- Table 39: France Chemical Software Industry Revenue (Million) Forecast, by Application 2019 & 2032
- Table 40: Italy Chemical Software Industry Revenue (Million) Forecast, by Application 2019 & 2032
- Table 41: Spain Chemical Software Industry Revenue (Million) Forecast, by Application 2019 & 2032
- Table 42: Rest of Europe Chemical Software Industry Revenue (Million) Forecast, by Application 2019 & 2032
- Table 43: Global Chemical Software Industry Revenue Million Forecast, by Application 2019 & 2032
- Table 44: Global Chemical Software Industry Revenue Million Forecast, by Country 2019 & 2032
- Table 45: China Chemical Software Industry Revenue (Million) Forecast, by Application 2019 & 2032
- Table 46: Japan Chemical Software Industry Revenue (Million) Forecast, by Application 2019 & 2032
- Table 47: India Chemical Software Industry Revenue (Million) Forecast, by Application 2019 & 2032
- Table 48: Australia Chemical Software Industry Revenue (Million) Forecast, by Application 2019 & 2032
- Table 49: South Korea Chemical Software Industry Revenue (Million) Forecast, by Application 2019 & 2032
- Table 50: Rest of Asia Pacific Chemical Software Industry Revenue (Million) Forecast, by Application 2019 & 2032
- Table 51: Global Chemical Software Industry Revenue Million Forecast, by Application 2019 & 2032
- Table 52: Global Chemical Software Industry Revenue Million Forecast, by Country 2019 & 2032
- Table 53: GCC Chemical Software Industry Revenue (Million) Forecast, by Application 2019 & 2032
- Table 54: South Africa Chemical Software Industry Revenue (Million) Forecast, by Application 2019 & 2032
- Table 55: Rest of Middle East and Africa Chemical Software Industry Revenue (Million) Forecast, by Application 2019 & 2032
- Table 56: Global Chemical Software Industry Revenue Million Forecast, by Application 2019 & 2032
- Table 57: Global Chemical Software Industry Revenue Million Forecast, by Country 2019 & 2032
- Table 58: Brazil Chemical Software Industry Revenue (Million) Forecast, by Application 2019 & 2032
- Table 59: Argentina Chemical Software Industry Revenue (Million) Forecast, by Application 2019 & 2032
- Table 60: Rest of South America Chemical Software Industry Revenue (Million) Forecast, by Application 2019 & 2032
Frequently Asked Questions
1. What is the projected Compound Annual Growth Rate (CAGR) of the Chemical Software Industry?
The projected CAGR is approximately 15.50%.
2. Which companies are prominent players in the Chemical Software Industry?
Key companies in the market include Chemaxon Ltd, BioSolveIT GmbH, Chemical Computing Group ULC, Molecular Discovery Ltd, Scilligence, Collaborative Drug Discovery Inc, Jubilant Biosys Ltd, Cadence Design Systems Inc (OpenEye Scientific Software Inc ), Schrödinger Inc, Dassault Systemes.
3. What are the main segments of the Chemical Software Industry?
The market segments include Application.
4. Can you provide details about the market size?
The market size is estimated to be USD 6.10 Million as of 2022.
5. What are some drivers contributing to market growth?
Innovations and Advancements in the Drug Development Process; Increased Demand of Personalized Medicine.
6. What are the notable trends driving market growth?
Virtual Screening Segment is Expected to Witness Growth in the Market Over the Forecast Period.
7. Are there any restraints impacting market growth?
Lack of Skilled Labors.
8. Can you provide examples of recent developments in the market?
In October 2023, Cadence Molecular Sciences (OpenEye) announced that Pfizer Inc. has signed an agreement to extend and expand access to Cadence products and programming toolkits for advanced molecular design. Cadence Molecular Sciences’ physics-and AI-based modelling and cheminformatics computational software is an enabler of early-stage drug discovery innovation.
9. What pricing options are available for accessing the report?
Pricing options include single-user, multi-user, and enterprise licenses priced at USD 4750, USD 5250, and USD 8750 respectively.
10. Is the market size provided in terms of value or volume?
The market size is provided in terms of value, measured in Million.
11. Are there any specific market keywords associated with the report?
Yes, the market keyword associated with the report is "Chemical Software Industry," which aids in identifying and referencing the specific market segment covered.
12. How do I determine which pricing option suits my needs best?
The pricing options vary based on user requirements and access needs. Individual users may opt for single-user licenses, while businesses requiring broader access may choose multi-user or enterprise licenses for cost-effective access to the report.
13. Are there any additional resources or data provided in the Chemical Software Industry report?
While the report offers comprehensive insights, it's advisable to review the specific contents or supplementary materials provided to ascertain if additional resources or data are available.
14. How can I stay updated on further developments or reports in the Chemical Software Industry?
To stay informed about further developments, trends, and reports in the Chemical Software Industry, consider subscribing to industry newsletters, following relevant companies and organizations, or regularly checking reputable industry news sources and publications.
Methodology
Step 1 - Identification of Relevant Samples Size from Population Database


Step 2 - Approaches for Defining Global Market Size (Value, Volume* & Price*)

Note*: In applicable scenarios
Step 3 - Data Sources
Primary Research
- Web Analytics
- Survey Reports
- Research Institute
- Latest Research Reports
- Opinion Leaders
Secondary Research
- Annual Reports
- White Paper
- Latest Press Release
- Industry Association
- Paid Database
- Investor Presentations

Step 4 - Data Triangulation
Involves using different sources of information in order to increase the validity of a study
These sources are likely to be stakeholders in a program - participants, other researchers, program staff, other community members, and so on.
Then we put all data in single framework & apply various statistical tools to find out the dynamic on the market.
During the analysis stage, feedback from the stakeholder groups would be compared to determine areas of agreement as well as areas of divergence
