


Key Insights
The global Chemical Drug Contract Development and Manufacturing Organization (CDMO) market is poised for substantial expansion, projected to reach a valuation of approximately $149,060 million by 2025, with a compelling Compound Annual Growth Rate (CAGR) of 7.2% anticipated through 2033. This robust growth trajectory is underpinned by a confluence of dynamic market drivers, including the escalating demand for specialized pharmaceutical outsourcing services, the increasing complexity of drug development pipelines, and the relentless pursuit of cost-efficiency and streamlined production by pharmaceutical companies. Emerging economies are also playing a pivotal role, with growing healthcare expenditures and a burgeoning pharmaceutical industry creating significant opportunities for CDMOs. The market's expansion is further fueled by advancements in biopharmaceutical manufacturing technologies and a heightened focus on novel therapeutic modalities, necessitating specialized expertise that many drug developers may not possess in-house.
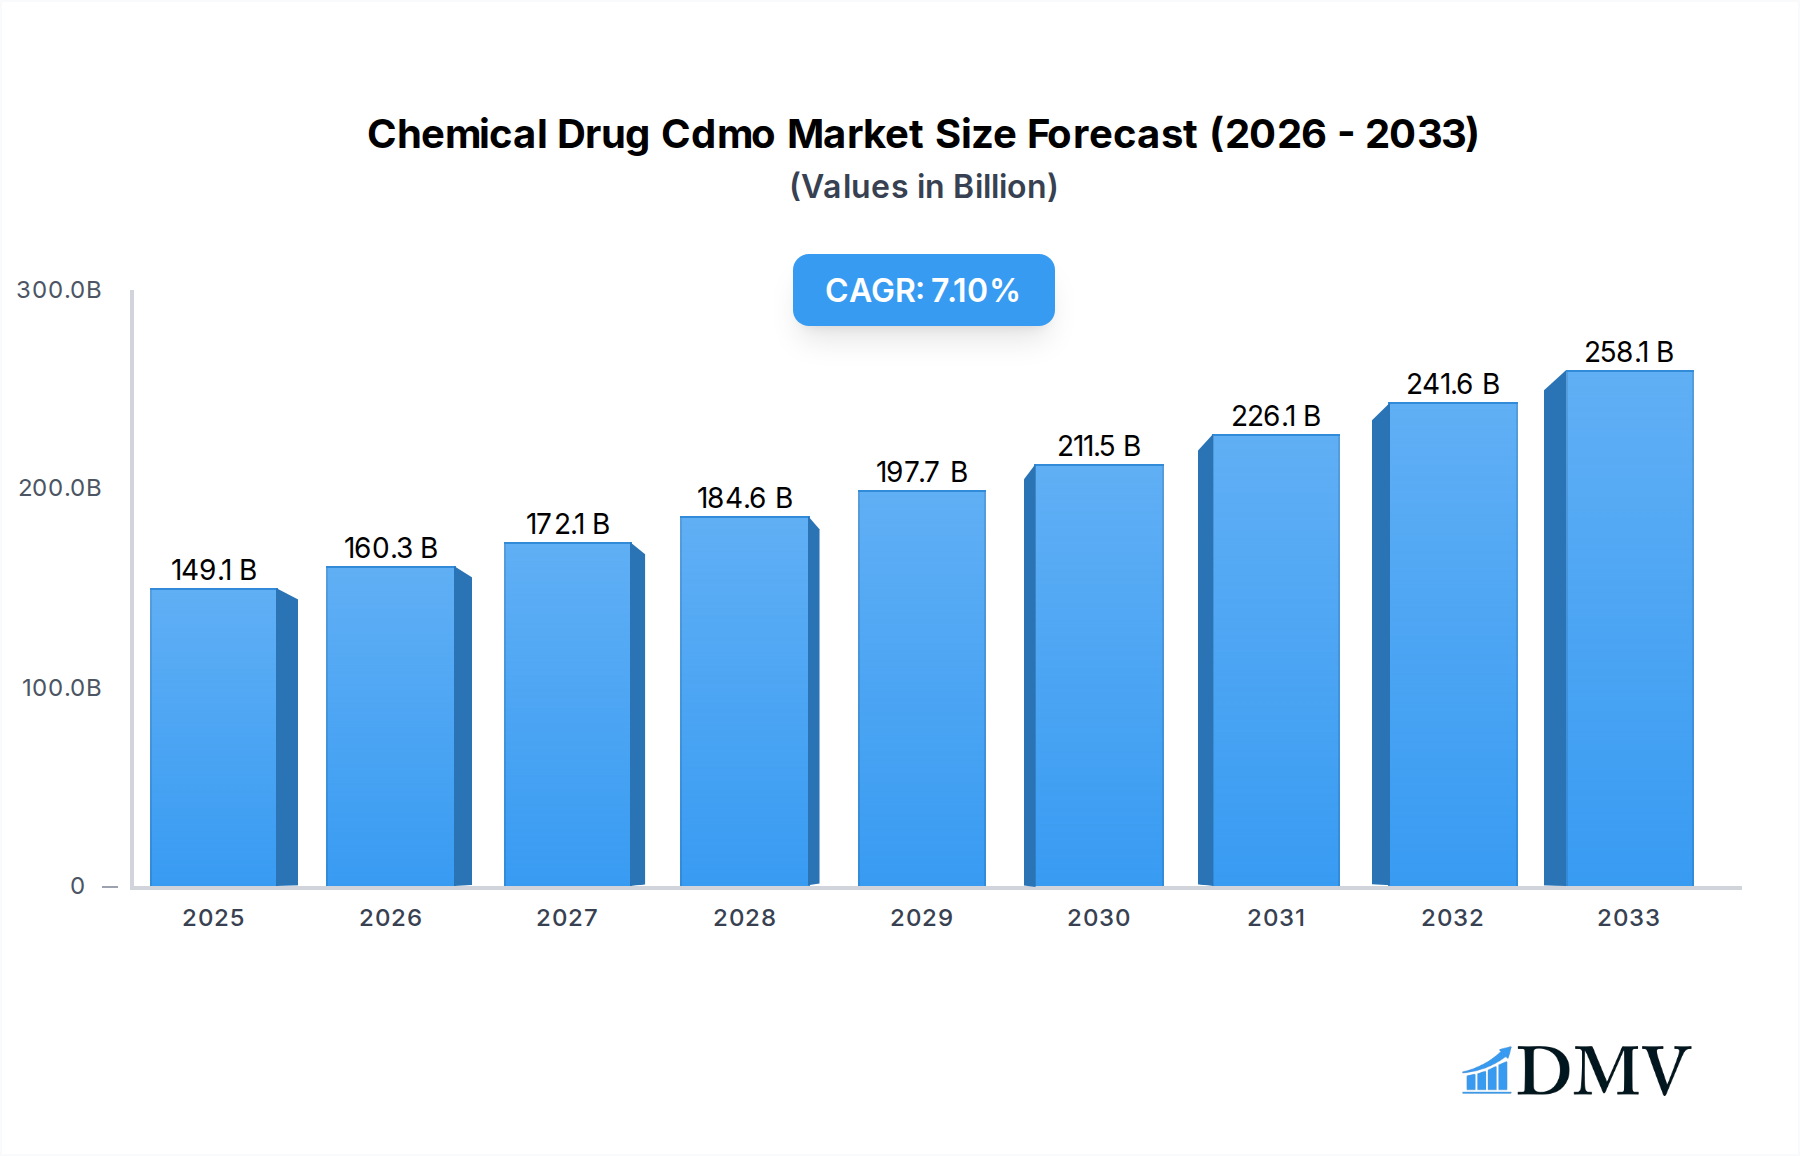
Chemical Drug Cdmo Market Size (In Billion)

The market's segmentation reveals distinct growth opportunities across various applications and service types. Large enterprises, with their extensive drug portfolios and significant outsourcing needs, continue to be a dominant segment. However, Small and Medium Enterprises (SMEs) represent a rapidly growing customer base, driven by their need for flexible and scalable manufacturing solutions to bring innovative treatments to market without substantial capital investment. In terms of service types, API CDMOs are expected to lead the market due to the fundamental importance of active pharmaceutical ingredients in drug formulation. FDF CDMOs and Packaging CDMOs are also experiencing strong demand as companies seek end-to-end solutions. Key restraints include stringent regulatory landscapes, intellectual property concerns, and intense competition among a large number of players. Nevertheless, strategic collaborations, technological innovation, and a focus on niche therapeutic areas are expected to enable market players to navigate these challenges effectively.
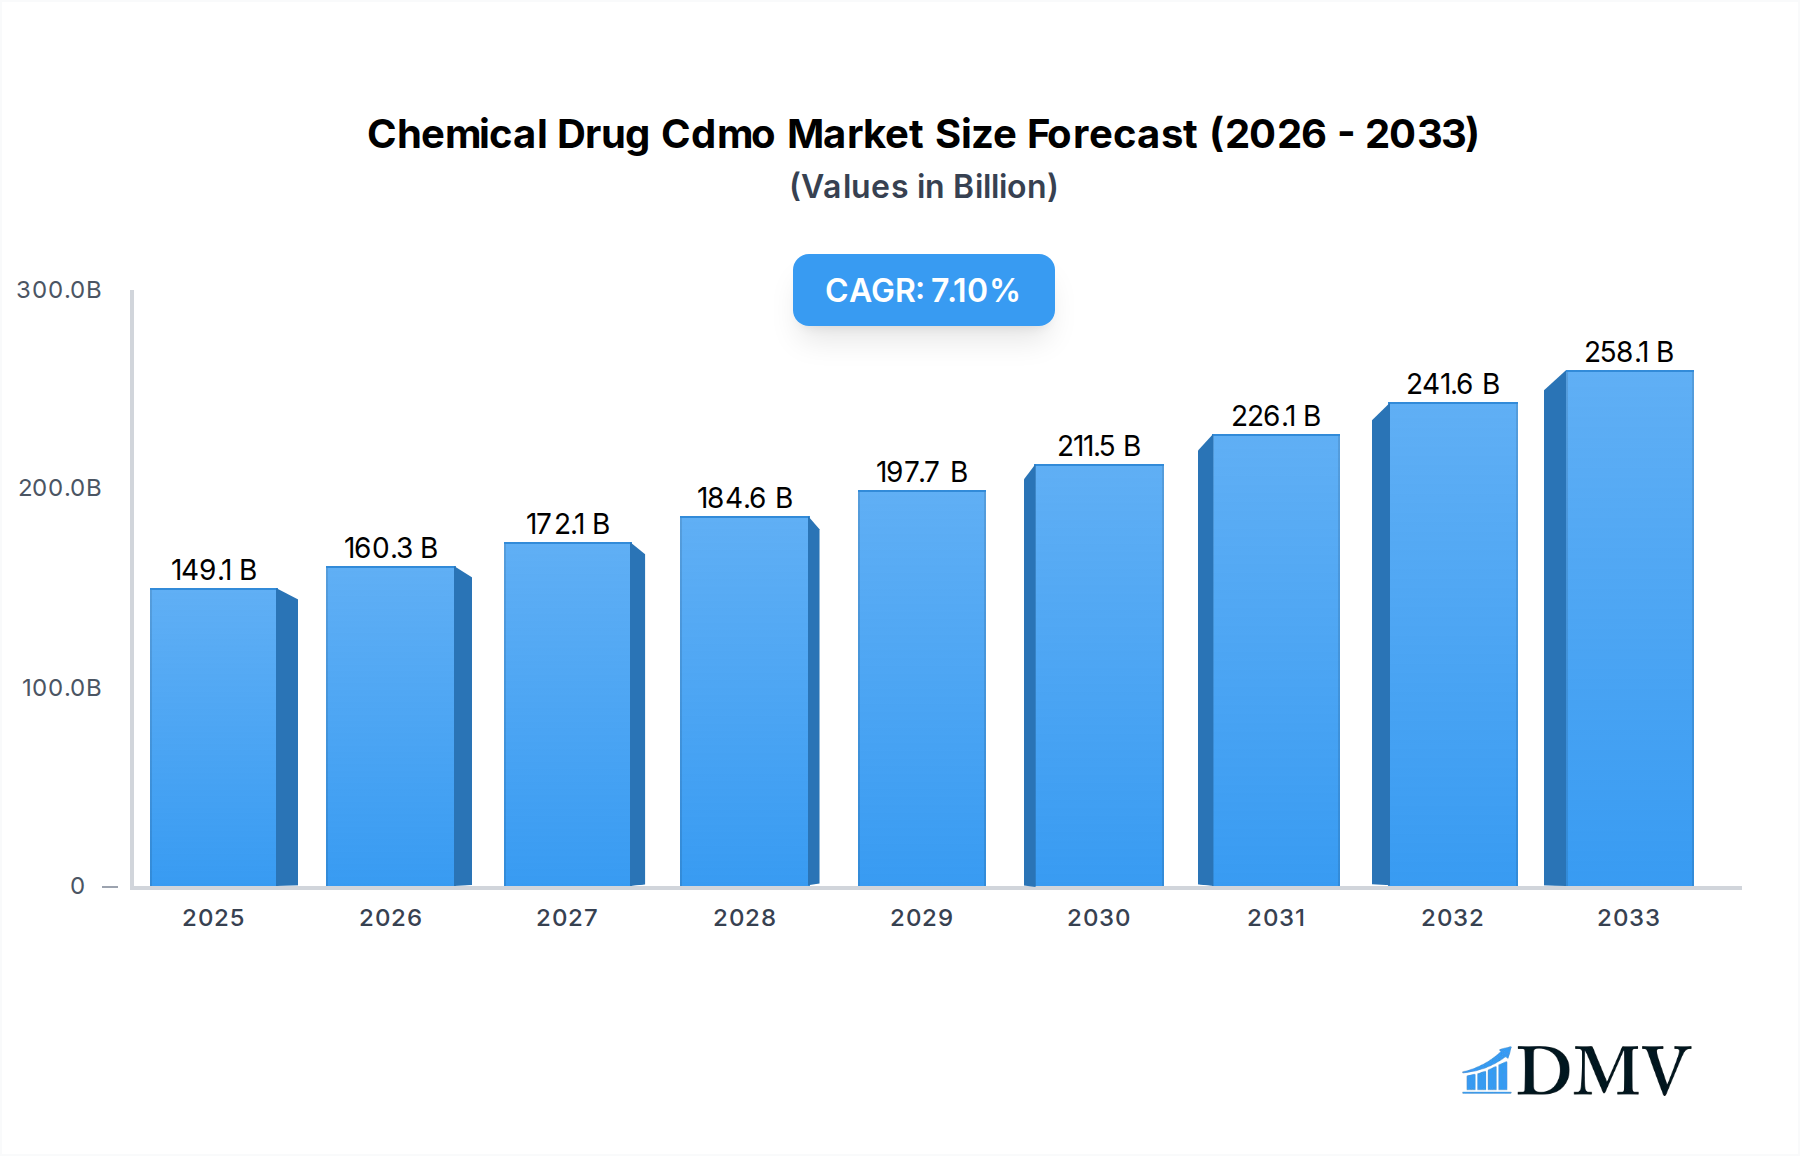
Chemical Drug Cdmo Company Market Share
Chemical Drug CDMO Market: A Comprehensive Analysis and Forecast (2019–2033)
This in-depth report provides a critical assessment of the global Chemical Drug Contract Development and Manufacturing Organization (CDMO) market. Spanning a study period from 2019 to 2033, with a base year of 2025, this analysis delves into market dynamics, growth trajectories, and future potential. Stakeholders seeking to understand the intricate landscape of pharmaceutical outsourcing, from API development to finished dosage forms and packaging solutions, will find invaluable insights. The report meticulously examines key players, emerging trends, and the strategic imperatives shaping this vital sector of the pharmaceutical industry.
Chemical Drug Cdmo Market Composition & Trends
The Chemical Drug CDMO market is characterized by a dynamic blend of consolidation and innovation, with a moderate level of concentration. Leading Contract Development and Manufacturing Organizations (CDMOs) like Catalent, Thermo Fisher Scientific, Lonza, and Siegfried command significant market share, estimated to be over 35% in 2025. The market is driven by increasing outsourcing by pharmaceutical and biotechnology companies, particularly for complex molecule development and manufacturing. Key innovation catalysts include advancements in continuous manufacturing, advanced biologics processing, and personalized medicine solutions. The regulatory landscape, governed by agencies such as the FDA and EMA, plays a crucial role, with stringent quality and compliance standards dictating operational strategies. Substitute products, while not directly replacing the CDMO model, can emerge from in-house manufacturing capabilities of larger pharmaceutical firms. End-user profiles range from large pharmaceutical enterprises seeking reliable partners for their blockbuster drugs to small and medium enterprises (SMEs) and virtual biotech companies requiring end-to-end development and manufacturing support. Mergers and acquisitions (M&A) are a significant trend, with deal values in the Chemical Drug CDMO sector projected to exceed $8,000 million in the forecast period. Notable M&A activities include strategic acquisitions aimed at expanding service offerings, geographic reach, and technological capabilities. For instance, the acquisition of WuXi AppTech by a consortium of investors for an estimated $10,000 million signifies the appetite for high-value assets. The market share distribution, while concentrated among the top players, also presents opportunities for niche CDMOs specializing in specific therapeutic areas or manufacturing technologies.
- Market Share Distribution (2025 Estimate): Top 5 players: ~35%, Top 10 players: ~55%, Rest of the market: ~45%.
- M&A Deal Values (2019-2033 Forecast): Total estimated value exceeding $8,000 million.
- Innovation Focus: Biologics manufacturing, mRNA technology, advanced drug delivery systems, continuous flow chemistry.
- Regulatory Landscape: Strict adherence to cGMP, ICH guidelines, and evolving EMA/FDA mandates.
- End-User Segmentation: Large Enterprise (approx. 70% of demand), Small and Medium Enterprises (approx. 25% of demand), Other (approx. 5% of demand).
Chemical Drug Cdmo Industry Evolution
The Chemical Drug CDMO industry has undergone a remarkable evolution, transforming from a transactional service provider to a strategic partner in drug development and commercialization. Over the historical period of 2019-2024, the market witnessed consistent growth, driven by the relentless demand for outsourced pharmaceutical manufacturing solutions. This growth trajectory has been propelled by several key factors, including the increasing complexity of drug molecules, the rising costs of in-house R&D and manufacturing infrastructure, and the growing trend of pharmaceutical companies focusing on core competencies like drug discovery and marketing. Technological advancements have been instrumental in this evolution. The adoption of advanced manufacturing technologies, such as single-use systems, continuous manufacturing, and process analytical technology (PAT), has enhanced efficiency, reduced lead times, and improved product quality. Furthermore, the burgeoning field of biologics has opened new avenues for CDMOs, with significant investments in capabilities for the development and production of monoclonal antibodies, recombinant proteins, and gene therapies.
The industry has also adapted to shifting consumer demands, particularly the growing emphasis on specialized therapeutics and personalized medicine. This necessitates agile and flexible manufacturing solutions that CDMOs are well-positioned to provide. For instance, the demand for small-batch, high-potency active pharmaceutical ingredients (APIs) for oncology drugs has spurred the development of specialized containment facilities within CDMOs. The market's growth trajectory is further underscored by an average annual growth rate (CAGR) of approximately 8.5% observed during the 2019-2024 period. Looking ahead, the forecast period of 2025-2033 anticipates sustained expansion, with projected CAGR of around 9.0%, fueled by ongoing R&D pipelines and the increasing reliance on external expertise. The rise of virtual and small biotech companies, with limited internal manufacturing capabilities, also contributes significantly to this demand. These entities heavily depend on CDMOs for every stage of their product lifecycle, from preclinical development to commercial launch. Moreover, established pharmaceutical giants are increasingly leveraging CDMOs to manage capacity fluctuations, mitigate supply chain risks, and access specialized technologies. The investment in state-of-the-art facilities and skilled personnel by leading CDMOs, such as Boehringer Ingelheim, WuXi Biologics, and Samsung Biologics, has solidified their positions as integral components of the global pharmaceutical ecosystem. The shift towards integrated CDMO services, encompassing early-stage development, clinical manufacturing, and commercial supply, further exemplifies the industry's maturation and its expanded strategic role.
Leading Regions, Countries, or Segments in Chemical Drug Cdmo
The global Chemical Drug CDMO market exhibits significant regional and segment-specific dominance. Among the Application segments, Large Enterprises represent the most influential category, accounting for an estimated 70% of the market demand in 2025. This dominance stems from their extensive drug portfolios, substantial R&D pipelines, and the sheer volume of manufacturing required to meet global patient needs. Large pharmaceutical companies often engage CDMOs for their specialized expertise in complex manufacturing processes, regulatory navigation, and to optimize their own internal resource allocation. Small and Medium Enterprises (SMEs) constitute the second-largest segment, representing approximately 25% of the market, while the "Other" category, which includes academic institutions and research organizations, comprises the remaining 5%.
In terms of Type, the API CDMO segment is a cornerstone of the industry, driving innovation and supply chains. This segment is projected to capture over 45% of the market share in 2025. The complexity and stringent quality requirements for API manufacturing make it a specialized area where CDMO expertise is highly valued. Following closely is the FDF CDMO (Finished Dosage Form) segment, expected to hold around 35% of the market, reflecting the increasing outsourcing of formulation and final product manufacturing. The Packaging CDMO segment, while essential, represents a smaller but growing portion of the market, estimated at 15%, with a focus on specialized packaging solutions and serialization. The "Other" type segment accounts for the remaining 5%.
Geographically, North America and Europe have historically been the dominant regions, driven by the presence of major pharmaceutical companies, robust regulatory frameworks, and established R&D ecosystems. However, the Asia-Pacific region, particularly China and India, is emerging as a significant manufacturing hub, offering cost-effectiveness and expanding capabilities. For example, investment trends in Asia-Pacific are showing a surge in new facility constructions and technology upgrades, aiming to compete with established Western markets. Regulatory support in these regions is also evolving, with governments actively promoting the pharmaceutical manufacturing sector.
- Dominant Application Segment: Large Enterprise (Estimated 70% market share in 2025).
- Key Drivers: Extensive drug portfolios, high manufacturing volumes, need for specialized expertise, resource optimization.
- Dominant Type Segment: API CDMO (Estimated 45% market share in 2025).
- Key Drivers: Complexity of API synthesis, stringent quality requirements, need for specialized chemical expertise, regulatory compliance.
- Emerging Geographic Hub: Asia-Pacific (China and India).
- Key Drivers: Cost-effectiveness, growing R&D infrastructure, government incentives, expanding technological capabilities.
- Investment Trends: Significant capital expenditure in new facilities, advanced technologies (e.g., continuous manufacturing, biologics processing), and talent acquisition across all major segments.
Chemical Drug Cdmo Product Innovations
The Chemical Drug CDMO sector is at the forefront of product innovation, continually developing and refining manufacturing processes to support novel therapeutics. Innovations focus on enhancing efficiency, improving product quality, and enabling the production of increasingly complex molecules. This includes the development of specialized reactors for high-potency APIs, advanced purification techniques for biologics, and novel formulation strategies for challenging drug substances. CDMOs are also investing in capabilities for the production of next-generation therapies, such as cell and gene therapies, and mRNA vaccines. The unique selling proposition of these innovations lies in their ability to accelerate time-to-market for new drugs, reduce manufacturing costs, and ensure the highest levels of patient safety. For instance, the implementation of continuous manufacturing processes by companies like FUJIFILM Diosynth Biotechnologies has led to a significant reduction in batch times and improved product consistency for several key pharmaceuticals.
Propelling Factors for Chemical Drug Cdmo Growth
Several factors are propelling the growth of the Chemical Drug CDMO market. The increasing complexity of drug development and the rising R&D costs compel pharmaceutical companies to outsource specialized manufacturing needs. Technological advancements, such as continuous manufacturing and advanced biologics processing, enable CDMOs to offer more efficient and cost-effective solutions. The growing pipeline of novel drugs, particularly in oncology, immunology, and rare diseases, demands specialized manufacturing capabilities that many pharma companies may not possess internally. Furthermore, the regulatory landscape, while stringent, also fosters growth as CDMOs invest in compliance and quality systems to meet global standards. Economic factors, including cost savings and risk mitigation associated with outsourcing, also contribute significantly. For example, the ability of CDMOs to scale production rapidly to meet fluctuating demand is a critical economic advantage.
- Rising R&D complexity and costs: Driving outsourcing to leverage specialized expertise.
- Technological advancements: Enabling efficient and high-quality manufacturing.
- Growing drug pipeline: Especially in complex therapeutic areas requiring specialized CDMO capabilities.
- Cost-effectiveness and risk mitigation: Offering financial advantages and supply chain security.
- Focus on core competencies: Allowing pharmaceutical companies to concentrate on R&D and commercialization.
Obstacles in the Chemical Drug Cdmo Market
Despite robust growth, the Chemical Drug CDMO market faces several obstacles. Regulatory hurdles, including evolving cGMP requirements and the complexity of global regulatory submissions, can lead to delays and increased costs. Supply chain disruptions, exacerbated by geopolitical events and natural disasters, pose a significant challenge to reliable production and timely delivery. Intense competition among CDMOs can lead to price pressures and margin erosion, particularly for commoditized services. Intellectual property concerns and the need for robust data security are also critical considerations for clients. Furthermore, the shortage of skilled personnel in specialized manufacturing areas can impact capacity and operational efficiency. The increasing stringency of environmental regulations also adds to operational costs and complexity for CDMOs.
- Evolving Regulatory Landscapes: Requiring continuous investment in compliance and validation.
- Supply Chain Vulnerabilities: Susceptible to global disruptions, impacting raw material availability and delivery timelines.
- Intense Competition and Price Pressures: Especially in standard manufacturing services.
- Intellectual Property Protection: Ensuring robust safeguards for client data and proprietary processes.
- Talent Shortages: In specialized scientific and manufacturing roles, impacting capacity expansion.
Future Opportunities in Chemical Drug Cdmo
The future of the Chemical Drug CDMO market is replete with opportunities. The growing demand for biologics, including monoclonal antibodies, recombinant proteins, and advanced therapies like cell and gene therapies, presents a significant growth avenue. The increasing adoption of personalized medicine and the development of orphan drugs will require specialized, flexible manufacturing solutions that CDMOs are well-equipped to provide. Emerging markets in Asia, Latin America, and Africa offer substantial untapped potential for CDMO services as these regions expand their pharmaceutical manufacturing capabilities. Furthermore, the integration of advanced technologies like artificial intelligence (AI) and machine learning (ML) in process development and optimization presents an opportunity for CDMOs to enhance efficiency and offer predictive analytics to their clients. The ongoing focus on sustainable manufacturing practices also opens doors for CDMOs adopting green chemistry principles and eco-friendly processes.
- Biologics Manufacturing: Especially for advanced therapies like cell and gene therapies.
- Personalized Medicine and Orphan Drugs: Requiring flexible and specialized manufacturing.
- Emerging Markets: Untapped potential in regions with growing pharmaceutical sectors.
- Digital Transformation: Leveraging AI and ML for process optimization and predictive analytics.
- Sustainable Manufacturing: Adopting green chemistry and eco-friendly practices.
Major Players in the Chemical Drug Cdmo Ecosystem
- Catalent
- Thermo Fisher Scientific
- Lonza
- Siegfried
- Recipharm
- Boehringer Ingelheim
- WuXi AppTech
- WuXi Biologics
- Fareva
- Samsung Biologics
- Aenova
- Delpharm
- Strides Pharma
- Piramal
- Famar
- Curia
- Jubilant
- Vetter
- AGC Pharma Chemicals
- Asymchem
- Pharmaron
- Eurofins
- Ascendia Pharmaceuticals
- Ardena
- CPL
- UPM Pharmaceuticals
- FUJIFILM Diosynth Biotechnologies
- Groupe Parima
- TBD Pharmatech
- Avid Bioservices
- NextPharma
- Alcami
- Societal CDMO
- MedPharm
- Euroapi
- BioVectra
- Pfizer CentreOne
- Fermion
Key Developments in Chemical Drug Cdmo Industry
- 2023: Catalent announces significant expansion of its biologics manufacturing capacity to meet growing demand for complex therapies.
- 2023: WuXi Biologics completes a major acquisition, broadening its gene therapy manufacturing capabilities.
- 2023: Lonza invests heavily in advanced continuous manufacturing technologies to enhance efficiency and reduce lead times.
- 2024: Thermo Fisher Scientific launches a new suite of analytical services for biopharmaceutical development, strengthening its end-to-end offering.
- 2024: Samsung Biologics forms a strategic partnership to develop and manufacture mRNA-based vaccines and therapeutics.
- 2024: Siegfried expands its sterile drug product manufacturing capabilities with a new facility in Europe.
- 2024: Boehringer Ingelheim announces substantial investments in its contract manufacturing business to support the growing demand for complex APIs.
- 2024: FUJIFILM Diosynth Biotechnologies secures a significant long-term manufacturing agreement for a novel antibody-drug conjugate (ADC).
Strategic Chemical Drug Cdmo Market Forecast
The strategic outlook for the Chemical Drug CDMO market is exceptionally positive, driven by sustained global demand for outsourced pharmaceutical development and manufacturing services. The increasing complexity of drug molecules, particularly in the biologics and advanced therapy space, will continue to fuel the need for specialized CDMO expertise. Growth catalysts include ongoing investments in cutting-edge technologies like continuous manufacturing and single-use systems, enhancing efficiency and flexibility. The expansion of CDMO capabilities into novel therapeutic modalities and emerging geographic markets will unlock significant new revenue streams. Strategic collaborations and M&A activities are expected to continue shaping the market landscape, leading to further consolidation and the emergence of integrated service providers. The market's ability to adapt to evolving regulatory requirements and supply chain dynamics will be crucial for its continued success, positioning CDMOs as indispensable partners in bringing life-saving medicines to patients worldwide.
Chemical Drug Cdmo Segmentation
-
1. Application
- 1.1. Large Enterprise
- 1.2. Small and Medium Enterprises
- 1.3. Other
-
2. Type
- 2.1. API CDMO
- 2.2. FDF CDMO
- 2.3. Packaging CDMO
- 2.4. Other
Chemical Drug Cdmo Segmentation By Geography
-
1. North America
- 1.1. United States
- 1.2. Canada
- 1.3. Mexico
-
2. South America
- 2.1. Brazil
- 2.2. Argentina
- 2.3. Rest of South America
-
3. Europe
- 3.1. United Kingdom
- 3.2. Germany
- 3.3. France
- 3.4. Italy
- 3.5. Spain
- 3.6. Russia
- 3.7. Benelux
- 3.8. Nordics
- 3.9. Rest of Europe
-
4. Middle East & Africa
- 4.1. Turkey
- 4.2. Israel
- 4.3. GCC
- 4.4. North Africa
- 4.5. South Africa
- 4.6. Rest of Middle East & Africa
-
5. Asia Pacific
- 5.1. China
- 5.2. India
- 5.3. Japan
- 5.4. South Korea
- 5.5. ASEAN
- 5.6. Oceania
- 5.7. Rest of Asia Pacific
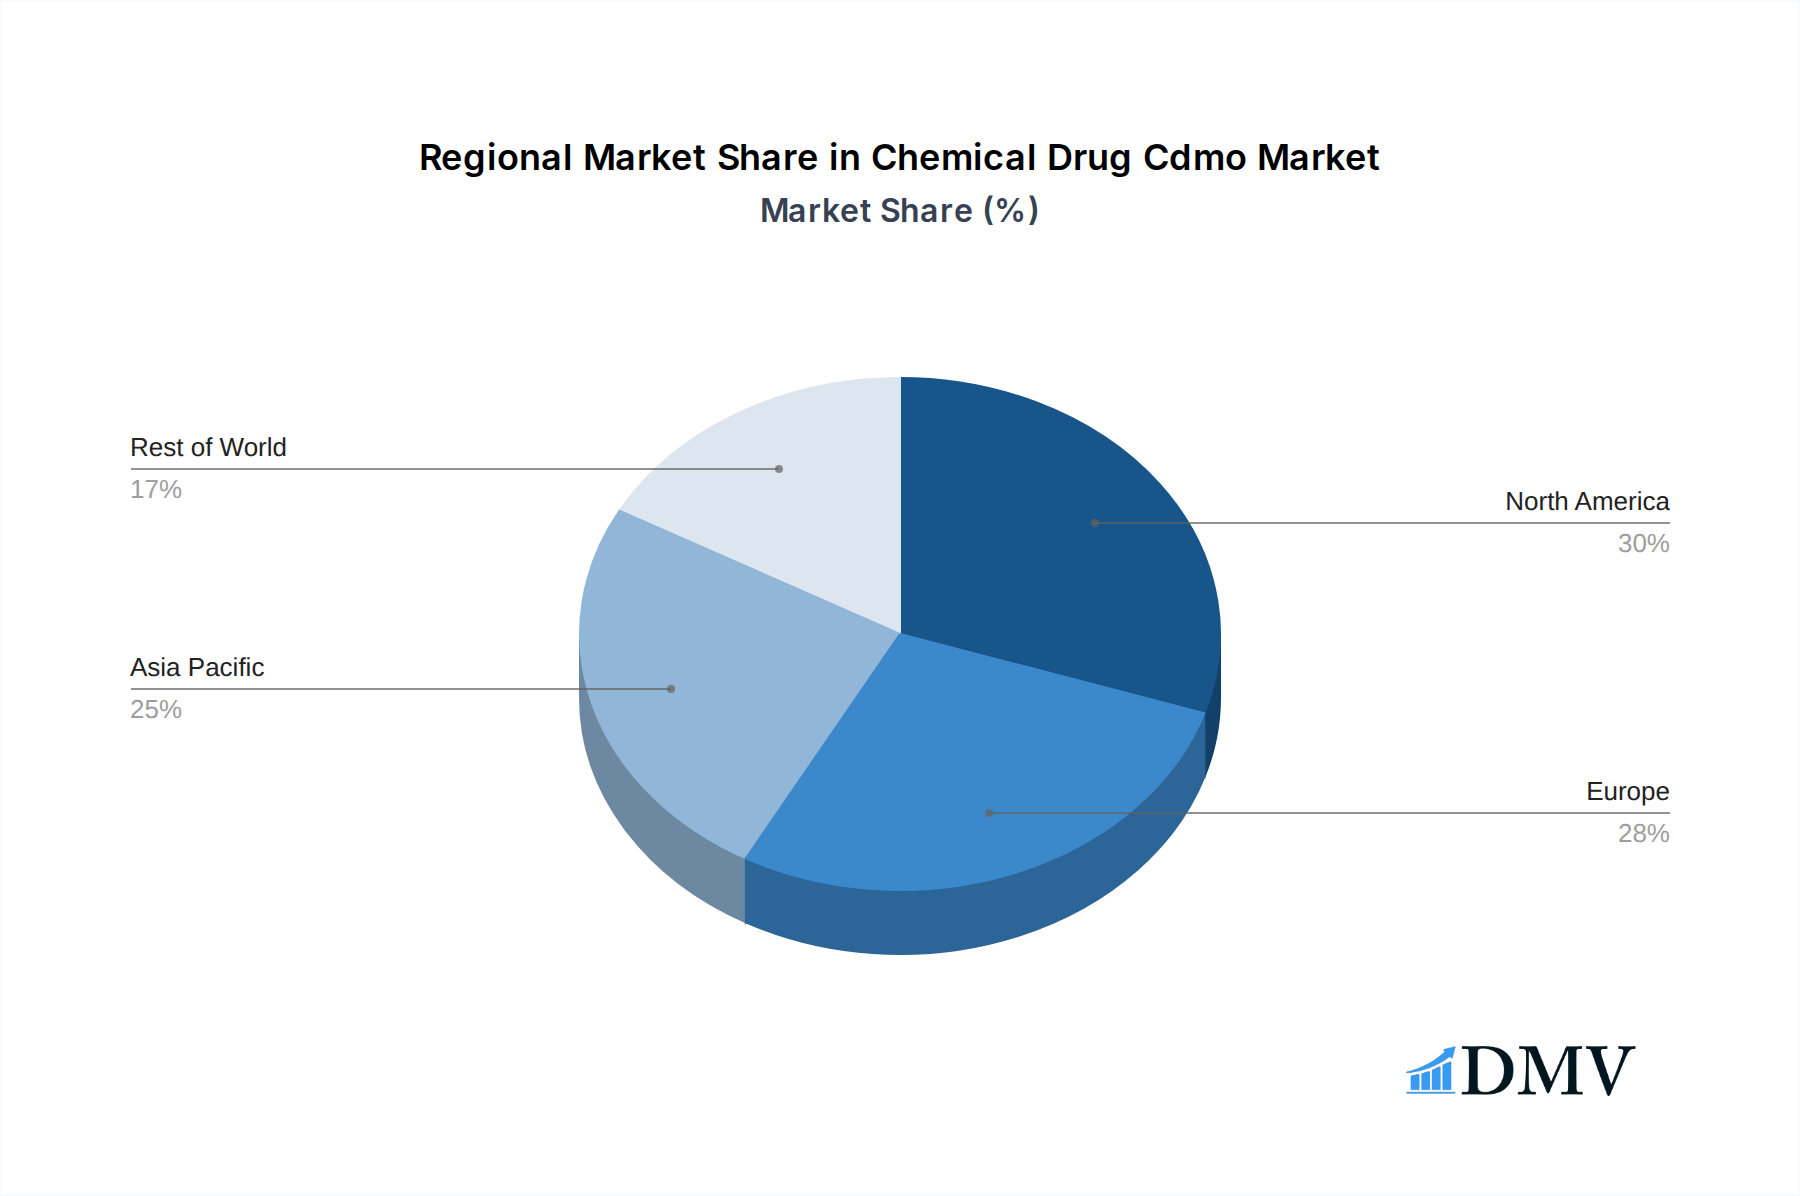
Chemical Drug Cdmo Regional Market Share
Geographic Coverage of Chemical Drug Cdmo
Chemical Drug Cdmo REPORT HIGHLIGHTS
| Aspects | Details |
|---|---|
| Study Period | 2020-2034 |
| Base Year | 2025 |
| Estimated Year | 2026 |
| Forecast Period | 2026-2034 |
| Historical Period | 2020-2025 |
| Growth Rate | CAGR of 7.2% from 2020-2034 |
| Segmentation |
|
Table of Contents
- 1. Introduction
- 1.1. Research Scope
- 1.2. Market Segmentation
- 1.3. Research Objective
- 1.4. Definitions and Assumptions
- 2. Executive Summary
- 2.1. Market Snapshot
- 3. Market Dynamics
- 3.1. Market Drivers
- 3.2. Market Restrains
- 3.3. Market Trends
- 3.4. Market Opportunities
- 4. Market Factor Analysis
- 4.1. Porters Five Forces
- 4.1.1. Bargaining Power of Suppliers
- 4.1.2. Bargaining Power of Buyers
- 4.1.3. Threat of New Entrants
- 4.1.4. Threat of Substitutes
- 4.1.5. Competitive Rivalry
- 4.2. PESTEL analysis
- 4.3. BCG Analysis
- 4.3.1. Stars (High Growth, High Market Share)
- 4.3.2. Cash Cows (Low Growth, High Market Share)
- 4.3.3. Question Mark (High Growth, Low Market Share)
- 4.3.4. Dogs (Low Growth, Low Market Share)
- 4.4. Ansoff Matrix Analysis
- 4.5. Supply Chain Analysis
- 4.6. Regulatory Landscape
- 4.7. Current Market Potential and Opportunity Assessment (TAM–SAM–SOM Framework)
- 4.8. DMV Analyst Note
- 4.1. Porters Five Forces
- 5. Market Analysis, Insights and Forecast 2021-2033
- 5.1. Market Analysis, Insights and Forecast - by Application
- 5.1.1. Large Enterprise
- 5.1.2. Small and Medium Enterprises
- 5.1.3. Other
- 5.2. Market Analysis, Insights and Forecast - by Type
- 5.2.1. API CDMO
- 5.2.2. FDF CDMO
- 5.2.3. Packaging CDMO
- 5.2.4. Other
- 5.3. Market Analysis, Insights and Forecast - by Region
- 5.3.1. North America
- 5.3.2. South America
- 5.3.3. Europe
- 5.3.4. Middle East & Africa
- 5.3.5. Asia Pacific
- 5.1. Market Analysis, Insights and Forecast - by Application
- 6. Global Chemical Drug Cdmo Analysis, Insights and Forecast, 2021-2033
- 6.1. Market Analysis, Insights and Forecast - by Application
- 6.1.1. Large Enterprise
- 6.1.2. Small and Medium Enterprises
- 6.1.3. Other
- 6.2. Market Analysis, Insights and Forecast - by Type
- 6.2.1. API CDMO
- 6.2.2. FDF CDMO
- 6.2.3. Packaging CDMO
- 6.2.4. Other
- 6.1. Market Analysis, Insights and Forecast - by Application
- 7. North America Chemical Drug Cdmo Analysis, Insights and Forecast, 2020-2032
- 7.1. Market Analysis, Insights and Forecast - by Application
- 7.1.1. Large Enterprise
- 7.1.2. Small and Medium Enterprises
- 7.1.3. Other
- 7.2. Market Analysis, Insights and Forecast - by Type
- 7.2.1. API CDMO
- 7.2.2. FDF CDMO
- 7.2.3. Packaging CDMO
- 7.2.4. Other
- 7.1. Market Analysis, Insights and Forecast - by Application
- 8. South America Chemical Drug Cdmo Analysis, Insights and Forecast, 2020-2032
- 8.1. Market Analysis, Insights and Forecast - by Application
- 8.1.1. Large Enterprise
- 8.1.2. Small and Medium Enterprises
- 8.1.3. Other
- 8.2. Market Analysis, Insights and Forecast - by Type
- 8.2.1. API CDMO
- 8.2.2. FDF CDMO
- 8.2.3. Packaging CDMO
- 8.2.4. Other
- 8.1. Market Analysis, Insights and Forecast - by Application
- 9. Europe Chemical Drug Cdmo Analysis, Insights and Forecast, 2020-2032
- 9.1. Market Analysis, Insights and Forecast - by Application
- 9.1.1. Large Enterprise
- 9.1.2. Small and Medium Enterprises
- 9.1.3. Other
- 9.2. Market Analysis, Insights and Forecast - by Type
- 9.2.1. API CDMO
- 9.2.2. FDF CDMO
- 9.2.3. Packaging CDMO
- 9.2.4. Other
- 9.1. Market Analysis, Insights and Forecast - by Application
- 10. Middle East & Africa Chemical Drug Cdmo Analysis, Insights and Forecast, 2020-2032
- 10.1. Market Analysis, Insights and Forecast - by Application
- 10.1.1. Large Enterprise
- 10.1.2. Small and Medium Enterprises
- 10.1.3. Other
- 10.2. Market Analysis, Insights and Forecast - by Type
- 10.2.1. API CDMO
- 10.2.2. FDF CDMO
- 10.2.3. Packaging CDMO
- 10.2.4. Other
- 10.1. Market Analysis, Insights and Forecast - by Application
- 11. Asia Pacific Chemical Drug Cdmo Analysis, Insights and Forecast, 2020-2032
- 11.1. Market Analysis, Insights and Forecast - by Application
- 11.1.1. Large Enterprise
- 11.1.2. Small and Medium Enterprises
- 11.1.3. Other
- 11.2. Market Analysis, Insights and Forecast - by Type
- 11.2.1. API CDMO
- 11.2.2. FDF CDMO
- 11.2.3. Packaging CDMO
- 11.2.4. Other
- 11.1. Market Analysis, Insights and Forecast - by Application
- 12. Competitive Analysis
- 12.1. Company Profiles
- 12.1.1 Catalent
- 12.1.1.1. Company Overview
- 12.1.1.2. Products
- 12.1.1.3. Company Financials
- 12.1.1.4. SWOT Analysis
- 12.1.2 Thermo Fisher Scientific
- 12.1.2.1. Company Overview
- 12.1.2.2. Products
- 12.1.2.3. Company Financials
- 12.1.2.4. SWOT Analysis
- 12.1.3 Lonza
- 12.1.3.1. Company Overview
- 12.1.3.2. Products
- 12.1.3.3. Company Financials
- 12.1.3.4. SWOT Analysis
- 12.1.4 Siegfried
- 12.1.4.1. Company Overview
- 12.1.4.2. Products
- 12.1.4.3. Company Financials
- 12.1.4.4. SWOT Analysis
- 12.1.5 Recipharm
- 12.1.5.1. Company Overview
- 12.1.5.2. Products
- 12.1.5.3. Company Financials
- 12.1.5.4. SWOT Analysis
- 12.1.6 Boehringer Ingelheim
- 12.1.6.1. Company Overview
- 12.1.6.2. Products
- 12.1.6.3. Company Financials
- 12.1.6.4. SWOT Analysis
- 12.1.7 WuXi AppTech
- 12.1.7.1. Company Overview
- 12.1.7.2. Products
- 12.1.7.3. Company Financials
- 12.1.7.4. SWOT Analysis
- 12.1.8 WuXi Biologics
- 12.1.8.1. Company Overview
- 12.1.8.2. Products
- 12.1.8.3. Company Financials
- 12.1.8.4. SWOT Analysis
- 12.1.9 Fareva
- 12.1.9.1. Company Overview
- 12.1.9.2. Products
- 12.1.9.3. Company Financials
- 12.1.9.4. SWOT Analysis
- 12.1.10 Samsung Biologics
- 12.1.10.1. Company Overview
- 12.1.10.2. Products
- 12.1.10.3. Company Financials
- 12.1.10.4. SWOT Analysis
- 12.1.11 Aenova
- 12.1.11.1. Company Overview
- 12.1.11.2. Products
- 12.1.11.3. Company Financials
- 12.1.11.4. SWOT Analysis
- 12.1.12 Delpharm
- 12.1.12.1. Company Overview
- 12.1.12.2. Products
- 12.1.12.3. Company Financials
- 12.1.12.4. SWOT Analysis
- 12.1.13 Strides Pharma
- 12.1.13.1. Company Overview
- 12.1.13.2. Products
- 12.1.13.3. Company Financials
- 12.1.13.4. SWOT Analysis
- 12.1.14 Piramal
- 12.1.14.1. Company Overview
- 12.1.14.2. Products
- 12.1.14.3. Company Financials
- 12.1.14.4. SWOT Analysis
- 12.1.15 Famar
- 12.1.15.1. Company Overview
- 12.1.15.2. Products
- 12.1.15.3. Company Financials
- 12.1.15.4. SWOT Analysis
- 12.1.16 Curia
- 12.1.16.1. Company Overview
- 12.1.16.2. Products
- 12.1.16.3. Company Financials
- 12.1.16.4. SWOT Analysis
- 12.1.17 Jubilant
- 12.1.17.1. Company Overview
- 12.1.17.2. Products
- 12.1.17.3. Company Financials
- 12.1.17.4. SWOT Analysis
- 12.1.18 Vetter
- 12.1.18.1. Company Overview
- 12.1.18.2. Products
- 12.1.18.3. Company Financials
- 12.1.18.4. SWOT Analysis
- 12.1.19 AGC Pharma Chemicals
- 12.1.19.1. Company Overview
- 12.1.19.2. Products
- 12.1.19.3. Company Financials
- 12.1.19.4. SWOT Analysis
- 12.1.20 Asymchem
- 12.1.20.1. Company Overview
- 12.1.20.2. Products
- 12.1.20.3. Company Financials
- 12.1.20.4. SWOT Analysis
- 12.1.21 Pharmaron
- 12.1.21.1. Company Overview
- 12.1.21.2. Products
- 12.1.21.3. Company Financials
- 12.1.21.4. SWOT Analysis
- 12.1.22 Eurofins
- 12.1.22.1. Company Overview
- 12.1.22.2. Products
- 12.1.22.3. Company Financials
- 12.1.22.4. SWOT Analysis
- 12.1.23 Ascendia Pharmaceuticals
- 12.1.23.1. Company Overview
- 12.1.23.2. Products
- 12.1.23.3. Company Financials
- 12.1.23.4. SWOT Analysis
- 12.1.24 Ardena
- 12.1.24.1. Company Overview
- 12.1.24.2. Products
- 12.1.24.3. Company Financials
- 12.1.24.4. SWOT Analysis
- 12.1.25 CPL
- 12.1.25.1. Company Overview
- 12.1.25.2. Products
- 12.1.25.3. Company Financials
- 12.1.25.4. SWOT Analysis
- 12.1.26 UPM Pharmaceuticals
- 12.1.26.1. Company Overview
- 12.1.26.2. Products
- 12.1.26.3. Company Financials
- 12.1.26.4. SWOT Analysis
- 12.1.27 FUJIFILM Diosynth Biotechnologies
- 12.1.27.1. Company Overview
- 12.1.27.2. Products
- 12.1.27.3. Company Financials
- 12.1.27.4. SWOT Analysis
- 12.1.28 Groupe Parima
- 12.1.28.1. Company Overview
- 12.1.28.2. Products
- 12.1.28.3. Company Financials
- 12.1.28.4. SWOT Analysis
- 12.1.29 TBD Pharmatech
- 12.1.29.1. Company Overview
- 12.1.29.2. Products
- 12.1.29.3. Company Financials
- 12.1.29.4. SWOT Analysis
- 12.1.30 Avid Bioservices
- 12.1.30.1. Company Overview
- 12.1.30.2. Products
- 12.1.30.3. Company Financials
- 12.1.30.4. SWOT Analysis
- 12.1.31 NextPharma
- 12.1.31.1. Company Overview
- 12.1.31.2. Products
- 12.1.31.3. Company Financials
- 12.1.31.4. SWOT Analysis
- 12.1.32 Alcami
- 12.1.32.1. Company Overview
- 12.1.32.2. Products
- 12.1.32.3. Company Financials
- 12.1.32.4. SWOT Analysis
- 12.1.33 Societal CDMO
- 12.1.33.1. Company Overview
- 12.1.33.2. Products
- 12.1.33.3. Company Financials
- 12.1.33.4. SWOT Analysis
- 12.1.34 MedPharm
- 12.1.34.1. Company Overview
- 12.1.34.2. Products
- 12.1.34.3. Company Financials
- 12.1.34.4. SWOT Analysis
- 12.1.35 Euroapi
- 12.1.35.1. Company Overview
- 12.1.35.2. Products
- 12.1.35.3. Company Financials
- 12.1.35.4. SWOT Analysis
- 12.1.36 BioVectra
- 12.1.36.1. Company Overview
- 12.1.36.2. Products
- 12.1.36.3. Company Financials
- 12.1.36.4. SWOT Analysis
- 12.1.37 Pfizer CentreOne
- 12.1.37.1. Company Overview
- 12.1.37.2. Products
- 12.1.37.3. Company Financials
- 12.1.37.4. SWOT Analysis
- 12.1.38 Fermion
- 12.1.38.1. Company Overview
- 12.1.38.2. Products
- 12.1.38.3. Company Financials
- 12.1.38.4. SWOT Analysis
- 12.1.1 Catalent
- 12.2. Market Entropy
- 12.2.1 Company's Key Areas Served
- 12.2.2 Recent Developments
- 12.3. Company Market Share Analysis 2025
- 12.3.1 Top 5 Companies Market Share Analysis
- 12.3.2 Top 3 Companies Market Share Analysis
- 12.4. List of Potential Customers
- 13. Research Methodology
List of Figures
- Figure 1: Global Chemical Drug Cdmo Revenue Breakdown (million, %) by Region 2025 & 2033
- Figure 2: North America Chemical Drug Cdmo Revenue (million), by Application 2025 & 2033
- Figure 3: North America Chemical Drug Cdmo Revenue Share (%), by Application 2025 & 2033
- Figure 4: North America Chemical Drug Cdmo Revenue (million), by Type 2025 & 2033
- Figure 5: North America Chemical Drug Cdmo Revenue Share (%), by Type 2025 & 2033
- Figure 6: North America Chemical Drug Cdmo Revenue (million), by Country 2025 & 2033
- Figure 7: North America Chemical Drug Cdmo Revenue Share (%), by Country 2025 & 2033
- Figure 8: South America Chemical Drug Cdmo Revenue (million), by Application 2025 & 2033
- Figure 9: South America Chemical Drug Cdmo Revenue Share (%), by Application 2025 & 2033
- Figure 10: South America Chemical Drug Cdmo Revenue (million), by Type 2025 & 2033
- Figure 11: South America Chemical Drug Cdmo Revenue Share (%), by Type 2025 & 2033
- Figure 12: South America Chemical Drug Cdmo Revenue (million), by Country 2025 & 2033
- Figure 13: South America Chemical Drug Cdmo Revenue Share (%), by Country 2025 & 2033
- Figure 14: Europe Chemical Drug Cdmo Revenue (million), by Application 2025 & 2033
- Figure 15: Europe Chemical Drug Cdmo Revenue Share (%), by Application 2025 & 2033
- Figure 16: Europe Chemical Drug Cdmo Revenue (million), by Type 2025 & 2033
- Figure 17: Europe Chemical Drug Cdmo Revenue Share (%), by Type 2025 & 2033
- Figure 18: Europe Chemical Drug Cdmo Revenue (million), by Country 2025 & 2033
- Figure 19: Europe Chemical Drug Cdmo Revenue Share (%), by Country 2025 & 2033
- Figure 20: Middle East & Africa Chemical Drug Cdmo Revenue (million), by Application 2025 & 2033
- Figure 21: Middle East & Africa Chemical Drug Cdmo Revenue Share (%), by Application 2025 & 2033
- Figure 22: Middle East & Africa Chemical Drug Cdmo Revenue (million), by Type 2025 & 2033
- Figure 23: Middle East & Africa Chemical Drug Cdmo Revenue Share (%), by Type 2025 & 2033
- Figure 24: Middle East & Africa Chemical Drug Cdmo Revenue (million), by Country 2025 & 2033
- Figure 25: Middle East & Africa Chemical Drug Cdmo Revenue Share (%), by Country 2025 & 2033
- Figure 26: Asia Pacific Chemical Drug Cdmo Revenue (million), by Application 2025 & 2033
- Figure 27: Asia Pacific Chemical Drug Cdmo Revenue Share (%), by Application 2025 & 2033
- Figure 28: Asia Pacific Chemical Drug Cdmo Revenue (million), by Type 2025 & 2033
- Figure 29: Asia Pacific Chemical Drug Cdmo Revenue Share (%), by Type 2025 & 2033
- Figure 30: Asia Pacific Chemical Drug Cdmo Revenue (million), by Country 2025 & 2033
- Figure 31: Asia Pacific Chemical Drug Cdmo Revenue Share (%), by Country 2025 & 2033
List of Tables
- Table 1: Global Chemical Drug Cdmo Revenue million Forecast, by Application 2020 & 2033
- Table 2: Global Chemical Drug Cdmo Revenue million Forecast, by Type 2020 & 2033
- Table 3: Global Chemical Drug Cdmo Revenue million Forecast, by Region 2020 & 2033
- Table 4: Global Chemical Drug Cdmo Revenue million Forecast, by Application 2020 & 2033
- Table 5: Global Chemical Drug Cdmo Revenue million Forecast, by Type 2020 & 2033
- Table 6: Global Chemical Drug Cdmo Revenue million Forecast, by Country 2020 & 2033
- Table 7: United States Chemical Drug Cdmo Revenue (million) Forecast, by Application 2020 & 2033
- Table 8: Canada Chemical Drug Cdmo Revenue (million) Forecast, by Application 2020 & 2033
- Table 9: Mexico Chemical Drug Cdmo Revenue (million) Forecast, by Application 2020 & 2033
- Table 10: Global Chemical Drug Cdmo Revenue million Forecast, by Application 2020 & 2033
- Table 11: Global Chemical Drug Cdmo Revenue million Forecast, by Type 2020 & 2033
- Table 12: Global Chemical Drug Cdmo Revenue million Forecast, by Country 2020 & 2033
- Table 13: Brazil Chemical Drug Cdmo Revenue (million) Forecast, by Application 2020 & 2033
- Table 14: Argentina Chemical Drug Cdmo Revenue (million) Forecast, by Application 2020 & 2033
- Table 15: Rest of South America Chemical Drug Cdmo Revenue (million) Forecast, by Application 2020 & 2033
- Table 16: Global Chemical Drug Cdmo Revenue million Forecast, by Application 2020 & 2033
- Table 17: Global Chemical Drug Cdmo Revenue million Forecast, by Type 2020 & 2033
- Table 18: Global Chemical Drug Cdmo Revenue million Forecast, by Country 2020 & 2033
- Table 19: United Kingdom Chemical Drug Cdmo Revenue (million) Forecast, by Application 2020 & 2033
- Table 20: Germany Chemical Drug Cdmo Revenue (million) Forecast, by Application 2020 & 2033
- Table 21: France Chemical Drug Cdmo Revenue (million) Forecast, by Application 2020 & 2033
- Table 22: Italy Chemical Drug Cdmo Revenue (million) Forecast, by Application 2020 & 2033
- Table 23: Spain Chemical Drug Cdmo Revenue (million) Forecast, by Application 2020 & 2033
- Table 24: Russia Chemical Drug Cdmo Revenue (million) Forecast, by Application 2020 & 2033
- Table 25: Benelux Chemical Drug Cdmo Revenue (million) Forecast, by Application 2020 & 2033
- Table 26: Nordics Chemical Drug Cdmo Revenue (million) Forecast, by Application 2020 & 2033
- Table 27: Rest of Europe Chemical Drug Cdmo Revenue (million) Forecast, by Application 2020 & 2033
- Table 28: Global Chemical Drug Cdmo Revenue million Forecast, by Application 2020 & 2033
- Table 29: Global Chemical Drug Cdmo Revenue million Forecast, by Type 2020 & 2033
- Table 30: Global Chemical Drug Cdmo Revenue million Forecast, by Country 2020 & 2033
- Table 31: Turkey Chemical Drug Cdmo Revenue (million) Forecast, by Application 2020 & 2033
- Table 32: Israel Chemical Drug Cdmo Revenue (million) Forecast, by Application 2020 & 2033
- Table 33: GCC Chemical Drug Cdmo Revenue (million) Forecast, by Application 2020 & 2033
- Table 34: North Africa Chemical Drug Cdmo Revenue (million) Forecast, by Application 2020 & 2033
- Table 35: South Africa Chemical Drug Cdmo Revenue (million) Forecast, by Application 2020 & 2033
- Table 36: Rest of Middle East & Africa Chemical Drug Cdmo Revenue (million) Forecast, by Application 2020 & 2033
- Table 37: Global Chemical Drug Cdmo Revenue million Forecast, by Application 2020 & 2033
- Table 38: Global Chemical Drug Cdmo Revenue million Forecast, by Type 2020 & 2033
- Table 39: Global Chemical Drug Cdmo Revenue million Forecast, by Country 2020 & 2033
- Table 40: China Chemical Drug Cdmo Revenue (million) Forecast, by Application 2020 & 2033
- Table 41: India Chemical Drug Cdmo Revenue (million) Forecast, by Application 2020 & 2033
- Table 42: Japan Chemical Drug Cdmo Revenue (million) Forecast, by Application 2020 & 2033
- Table 43: South Korea Chemical Drug Cdmo Revenue (million) Forecast, by Application 2020 & 2033
- Table 44: ASEAN Chemical Drug Cdmo Revenue (million) Forecast, by Application 2020 & 2033
- Table 45: Oceania Chemical Drug Cdmo Revenue (million) Forecast, by Application 2020 & 2033
- Table 46: Rest of Asia Pacific Chemical Drug Cdmo Revenue (million) Forecast, by Application 2020 & 2033
Frequently Asked Questions
1. What is the projected Compound Annual Growth Rate (CAGR) of the Chemical Drug Cdmo?
The projected CAGR is approximately 7.2%.
2. Which companies are prominent players in the Chemical Drug Cdmo?
Key companies in the market include Catalent, Thermo Fisher Scientific, Lonza, Siegfried, Recipharm, Boehringer Ingelheim, WuXi AppTech, WuXi Biologics, Fareva, Samsung Biologics, Aenova, Delpharm, Strides Pharma, Piramal, Famar, Curia, Jubilant, Vetter, AGC Pharma Chemicals, Asymchem, Pharmaron, Eurofins, Ascendia Pharmaceuticals, Ardena, CPL, UPM Pharmaceuticals, FUJIFILM Diosynth Biotechnologies, Groupe Parima, TBD Pharmatech, Avid Bioservices, NextPharma, Alcami, Societal CDMO, MedPharm, Euroapi, BioVectra, Pfizer CentreOne, Fermion.
3. What are the main segments of the Chemical Drug Cdmo?
The market segments include Application, Type.
4. Can you provide details about the market size?
The market size is estimated to be USD 149060 million as of 2022.
5. What are some drivers contributing to market growth?
N/A
6. What are the notable trends driving market growth?
N/A
7. Are there any restraints impacting market growth?
N/A
8. Can you provide examples of recent developments in the market?
N/A
9. What pricing options are available for accessing the report?
Pricing options include single-user, multi-user, and enterprise licenses priced at USD 4250.00, USD 6375.00, and USD 8500.00 respectively.
10. Is the market size provided in terms of value or volume?
The market size is provided in terms of value, measured in million.
11. Are there any specific market keywords associated with the report?
Yes, the market keyword associated with the report is "Chemical Drug Cdmo," which aids in identifying and referencing the specific market segment covered.
12. How do I determine which pricing option suits my needs best?
The pricing options vary based on user requirements and access needs. Individual users may opt for single-user licenses, while businesses requiring broader access may choose multi-user or enterprise licenses for cost-effective access to the report.
13. Are there any additional resources or data provided in the Chemical Drug Cdmo report?
While the report offers comprehensive insights, it's advisable to review the specific contents or supplementary materials provided to ascertain if additional resources or data are available.
14. How can I stay updated on further developments or reports in the Chemical Drug Cdmo?
To stay informed about further developments, trends, and reports in the Chemical Drug Cdmo, consider subscribing to industry newsletters, following relevant companies and organizations, or regularly checking reputable industry news sources and publications.
Methodology
Step 1 - Identification of Relevant Samples Size from Population Database



Step 2 - Approaches for Defining Global Market Size (Value, Volume* & Price*)

Note*: In applicable scenarios
Step 3 - Data Sources
Primary Research
- Web Analytics
- Survey Reports
- Research Institute
- Latest Research Reports
- Opinion Leaders
Secondary Research
- Annual Reports
- White Paper
- Latest Press Release
- Industry Association
- Paid Database
- Investor Presentations

Step 4 - Data Triangulation
Involves using different sources of information in order to increase the validity of a study
These sources are likely to be stakeholders in a program - participants, other researchers, program staff, other community members, and so on.
Then we put all data in single framework & apply various statistical tools to find out the dynamic on the market.
During the analysis stage, feedback from the stakeholder groups would be compared to determine areas of agreement as well as areas of divergence