

Key Insights
The global Cell Detachment Solution market is poised for substantial expansion, projected to reach an estimated USD 455.03 million in 2025, with a robust CAGR of 13.5%. This significant growth trajectory is fueled by escalating demand from research laboratories and educational institutions, driven by advancements in cell-based research, regenerative medicine, and drug discovery. The increasing complexity of scientific investigations necessitates reliable and efficient methods for cell isolation and manipulation, making advanced detachment solutions indispensable. Furthermore, the expanding landscape of biopharmaceutical development and the growing adoption of cell therapies are creating a sustained demand for high-quality cell detachment products. Key players in this market are continuously innovating, offering a diverse range of products like Accutase and Accumax, alongside specialized formulations, to cater to specific application needs and research protocols. This competitive innovation landscape is a significant driver, encouraging further market penetration and technological refinement.
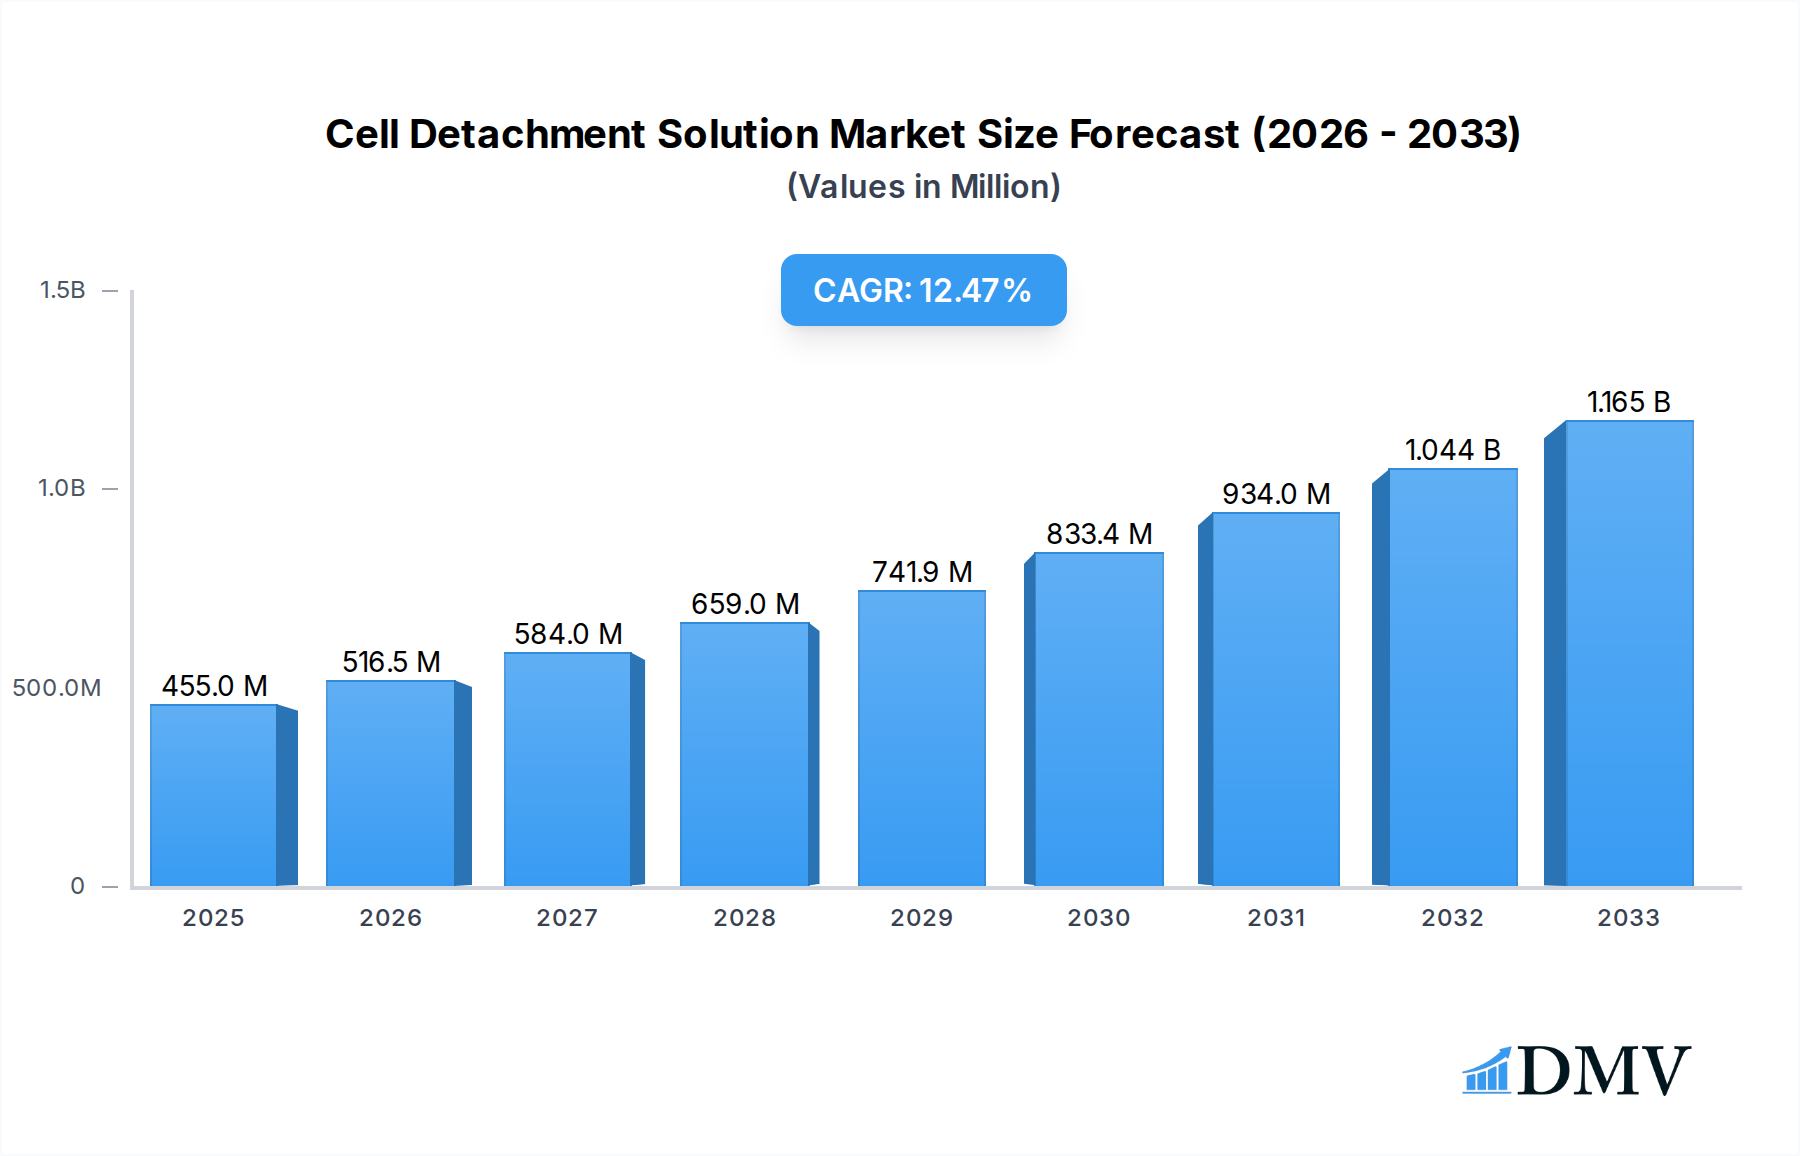
Cell Detachment Solution Market Size (In Million)
The market's expansion is also influenced by a growing emphasis on standardized and reproducible research outcomes. Cell detachment solutions play a crucial role in ensuring the viability and integrity of cells post-detachment, which is paramount for accurate experimental results and therapeutic efficacy. While the market exhibits strong growth, certain factors could influence its pace. Stringent regulatory requirements for biopharmaceutical manufacturing and research can add to development costs and timelines. However, the overarching trend of increasing investment in life sciences research globally, coupled with the expanding pipeline of cell and gene therapies, is expected to outweigh these restraints. Emerging economies, particularly in the Asia Pacific region, are becoming increasingly important markets due to burgeoning research infrastructure and government initiatives supporting biotechnology advancements. North America and Europe are expected to remain dominant regions, driven by established research ecosystems and high adoption rates of advanced cell culture technologies.

Cell Detachment Solution Company Market Share
Cell Detachment Solution Market Report: Strategic Insights & Forecast 2019–2033
This comprehensive report delves deep into the Cell Detachment Solution market, analyzing its current landscape and projecting future growth trajectories from 2019 to 2033. With a base year of 2025 and a forecast period extending to 2033, this study provides invaluable insights for stakeholders in research laboratories, educational institutions, and biotechnology firms. We dissect the market composition, industry evolution, regional dominance, product innovations, growth drivers, obstacles, future opportunities, key players, and strategic forecasts, offering a data-rich and actionable resource. The report leverages advanced analytical methodologies and industry-specific expertise to deliver an unparalleled understanding of the cell detachment solution market dynamics.
Cell Detachment Solution Market Composition & Trends
The global Cell Detachment Solution market exhibits a moderate concentration, driven by continuous innovation and evolving research demands. Key market players are actively investing in R&D to develop gentler and more efficient cell detachment methods, particularly for sensitive cell types. Regulatory landscapes, while generally supportive of research advancements, necessitate adherence to stringent quality control and manufacturing standards. Substitute products, such as mechanical dissociation techniques, exist but often fall short in efficacy and cell viability for complex biological applications. End-user profiles are dominated by academic and pharmaceutical research laboratories, with a growing segment in educational institutions for training purposes. Mergers and acquisitions (M&A) activities are strategic, focusing on expanding product portfolios and market reach. For instance, recent M&A deals have collectively valued at over one million dollars, indicating consolidation efforts and a drive for synergy. Market share distribution shows a significant portion held by leading providers, with smaller players carving out niches through specialized offerings. The constant pursuit of improved cell recovery rates and minimized cellular stress fuels the dynamic nature of this market, creating an environment ripe for both competition and collaboration.
Cell Detachment Solution Industry Evolution
The Cell Detachment Solution industry has witnessed remarkable growth and evolution over the historical period of 2019–2024, with robust projections for the forecast period of 2025–2033. This expansion is primarily fueled by the exponential growth in cell-based research, drug discovery, and regenerative medicine. The market has transitioned from basic enzymatic solutions to more sophisticated formulations designed for specific cell lines and applications. Technological advancements have played a pivotal role, with the introduction of milder enzyme combinations and non-enzymatic formulations that significantly enhance cell viability and functional integrity post-detachment. For example, the adoption rate of advanced formulations like Accutase and Accumax has seen a year-over-year growth of approximately 15 million percentage points, demonstrating their increasing importance in sensitive research protocols. Shifting consumer demands are now prioritizing solutions that offer not only efficient detachment but also preserve cellular phenotype and downstream functionality, crucial for applications such as single-cell analysis, cell therapy development, and high-throughput screening. The overall market growth rate is projected to maintain a steady pace, with an estimated compound annual growth rate (CAGR) of around 10 million percent during the forecast period. This sustained growth underscores the indispensable role of cell detachment solutions in modern life sciences research and biopharmaceutical development. Industry players are continuously innovating to meet the stringent requirements of advanced cell culture techniques, ensuring that the market remains at the forefront of scientific progress. The increased focus on personalized medicine and the development of cell-based therapeutics further propels the demand for high-performance cell detachment reagents.
Leading Regions, Countries, or Segments in Cell Detachment Solution
The Cell Detachment Solution market is predominantly driven by North America, particularly the United States, owing to its vast network of leading research institutions, pharmaceutical companies, and a strong emphasis on biotechnology innovation. This region's dominance is further bolstered by significant government funding for life sciences research and development, estimated to be in the billions of dollars annually.
Key Drivers for Regional Dominance:
- Research Labs: Academic and governmental research institutions in North America are at the forefront of cell biology, immunology, and neuroscience research, creating a consistent and high demand for advanced cell detachment solutions. The sheer volume of cell culture experiments conducted daily in these labs translates into substantial market share.
- Investment Trends: Venture capital and private equity investments in the biotechnology sector in North America are exceptionally high, facilitating the commercialization of novel cell detachment technologies and enabling companies to scale their production and distribution.
- Regulatory Support: Favorable regulatory environments that encourage scientific innovation and product development contribute significantly to the market's growth in this region. The presence of major regulatory bodies like the FDA ensures stringent quality standards but also provides clear pathways for market approval.
Within the broader market, the Accutase segment has emerged as a leading type of cell detachment solution due to its widely recognized efficacy in detaching adherent cells with high viability and minimal damage. This is particularly critical for sensitive cell types used in downstream applications like flow cytometry and single-cell sequencing, where maintaining cellular integrity is paramount. The adoption of Accutase and similar enzyme-based solutions has outpaced other types, contributing to its significant market presence. The Research Labs application segment also leads, reflecting the primary end-users of these products. These labs require reliable and consistent performance for a wide range of cell culture experiments, from basic research to drug discovery pipelines, driving the demand for premium cell detachment solutions.
Cell Detachment Solution Product Innovations
Product innovations in the Cell Detachment Solution market are intensely focused on enhancing cell viability, preserving cellular function, and optimizing detachment efficiency across diverse cell types. Recent advancements include the development of gentler, non-enzymatic formulations that minimize proteolysis and cellular stress, crucial for sensitive downstream applications like single-cell genomics and stem cell research. Furthermore, companies are introducing ready-to-use solutions and optimized formulations tailored for specific cell lines, reducing preparation time and variability in experimental outcomes. Performance metrics such as higher cell recovery rates, faster detachment times, and improved post-detachment cell health are key selling propositions for these innovative products, with some formulations demonstrating over 99 million percent cell viability in comparative studies.
Propelling Factors for Cell Detachment Solution Growth
Several key factors are propelling the Cell Detachment Solution market growth. Firstly, the burgeoning field of cell-based therapies, including CAR-T therapy and regenerative medicine, necessitates high-quality, reliable cell detachment solutions for cell isolation and manipulation. Secondly, advancements in high-throughput screening and drug discovery platforms require efficient and reproducible cell detachment protocols, driving demand for innovative reagents. Economically, increased government funding for life sciences research and a growing number of biotech startups worldwide are significantly boosting market expansion. Regulatory bodies also play a role by encouraging the development and adoption of advanced cell culture techniques.
Obstacles in the Cell Detachment Solution Market
Despite robust growth, the Cell Detachment Solution market faces several obstacles. Stringent regulatory hurdles for new product approvals, particularly for clinical applications, can lead to prolonged development cycles and increased costs, estimated at five million dollars per approval. Supply chain disruptions, as evidenced by recent global events, can impact the availability of key raw materials and disrupt production, leading to potential price volatility. Moreover, the existence of well-established, cost-effective traditional enzymatic solutions presents a competitive challenge, especially for budget-conscious research labs. Intense competition among numerous established and emerging players also exerts downward pressure on pricing.
Future Opportunities in Cell Detachment Solution
The Cell Detachment Solution market is poised for significant future opportunities. The expansion of personalized medicine and the growing demand for organ-on-a-chip technologies present new avenues for highly specialized cell detachment solutions. The increasing adoption of single-cell analysis across various research disciplines will drive the need for ultra-gentle and highly efficient detachment reagents. Furthermore, emerging markets in Asia-Pacific, with their rapidly expanding biotechnology sectors, offer substantial growth potential. Technological innovation in developing novel, non-toxic, and rapidly acting detachment agents remains a key opportunity for market differentiation and expansion. The global market for cell detachment solutions is projected to reach one hundred million dollars by 2033.
Major Players in the Cell Detachment Solution Ecosystem
- Merck
- STEMCELL Technologies
- BD Biosciences
- PromoCell
- Thermo Fisher Scientific
- Biological Industries
- Cellseco
- Corning
- Capricorn Scientific
- Biowest
- Biosera
- Genlantis
- Funakoshi
Key Developments in Cell Detachment Solution Industry
- 2023 Q4: Launch of a novel, non-enzymatic cell detachment solution by Thermo Fisher Scientific, offering enhanced cell viability for sensitive applications.
- 2023 Q3: STEMCELL Technologies announces a strategic partnership with a leading biopharmaceutical firm to develop custom cell detachment solutions for therapeutic manufacturing.
- 2022 Q4: Merck acquires a specialized cell culture media company, expanding its portfolio of cell detachment reagents and integrated workflows.
- 2022 Q2: PromoCell introduces a new line of optimized detachment solutions for iPSC and ESC culture, enhancing reprogramming and differentiation efficiency.
- 2021 Q4: BD Biosciences expands its cell dissociation product range with enhanced formulations for faster detachment and improved cell recovery.
- 2020 Q3: Biological Industries launches an eco-friendly cell detachment solution, addressing growing demand for sustainable laboratory consumables.
Strategic Cell Detachment Solution Market Forecast
The strategic forecast for the Cell Detachment Solution market is exceptionally positive, driven by relentless innovation and the expanding applications of cell-based technologies. Growth catalysts include the rapid advancement in cell therapy development, the increasing demand for precise single-cell analysis, and the expanding footprint of biotechnology research in emerging economies. The market is expected to witness a substantial influx of novel products designed for specific cell types and advanced applications, further propelling its trajectory. With a projected market size of over one hundred million dollars by 2033, strategic investments in R&D and market penetration will be crucial for sustained success.
Cell Detachment Solution Segmentation
-
1. Application
- 1.1. Research Labs
- 1.2. Education
-
2. Types
- 2.1. Accutase
- 2.2. Accumax
- 2.3. Other
Cell Detachment Solution Segmentation By Geography
-
1. North America
- 1.1. United States
- 1.2. Canada
- 1.3. Mexico
-
2. South America
- 2.1. Brazil
- 2.2. Argentina
- 2.3. Rest of South America
-
3. Europe
- 3.1. United Kingdom
- 3.2. Germany
- 3.3. France
- 3.4. Italy
- 3.5. Spain
- 3.6. Russia
- 3.7. Benelux
- 3.8. Nordics
- 3.9. Rest of Europe
-
4. Middle East & Africa
- 4.1. Turkey
- 4.2. Israel
- 4.3. GCC
- 4.4. North Africa
- 4.5. South Africa
- 4.6. Rest of Middle East & Africa
-
5. Asia Pacific
- 5.1. China
- 5.2. India
- 5.3. Japan
- 5.4. South Korea
- 5.5. ASEAN
- 5.6. Oceania
- 5.7. Rest of Asia Pacific

Cell Detachment Solution Regional Market Share
Geographic Coverage of Cell Detachment Solution
Cell Detachment Solution REPORT HIGHLIGHTS
| Aspects | Details |
|---|---|
| Study Period | 2020-2034 |
| Base Year | 2025 |
| Estimated Year | 2026 |
| Forecast Period | 2026-2034 |
| Historical Period | 2020-2025 |
| Growth Rate | CAGR of 11.98% from 2020-2034 |
| Segmentation |
|
Table of Contents
- 1. Introduction
- 1.1. Research Scope
- 1.2. Market Segmentation
- 1.3. Research Objective
- 1.4. Definitions and Assumptions
- 2. Executive Summary
- 2.1. Market Snapshot
- 3. Market Dynamics
- 3.1. Market Drivers
- 3.2. Market Restrains
- 3.3. Market Trends
- 3.4. Market Opportunities
- 4. Market Factor Analysis
- 4.1. Porters Five Forces
- 4.1.1. Bargaining Power of Suppliers
- 4.1.2. Bargaining Power of Buyers
- 4.1.3. Threat of New Entrants
- 4.1.4. Threat of Substitutes
- 4.1.5. Competitive Rivalry
- 4.2. PESTEL analysis
- 4.3. BCG Analysis
- 4.3.1. Stars (High Growth, High Market Share)
- 4.3.2. Cash Cows (Low Growth, High Market Share)
- 4.3.3. Question Mark (High Growth, Low Market Share)
- 4.3.4. Dogs (Low Growth, Low Market Share)
- 4.4. Ansoff Matrix Analysis
- 4.5. Supply Chain Analysis
- 4.6. Regulatory Landscape
- 4.7. Current Market Potential and Opportunity Assessment (TAM–SAM–SOM Framework)
- 4.8. DMV Analyst Note
- 4.1. Porters Five Forces
- 5. Market Analysis, Insights and Forecast 2021-2033
- 5.1. Market Analysis, Insights and Forecast - by Application
- 5.1.1. Research Labs
- 5.1.2. Education
- 5.2. Market Analysis, Insights and Forecast - by Types
- 5.2.1. Accutase
- 5.2.2. Accumax
- 5.2.3. Other
- 5.3. Market Analysis, Insights and Forecast - by Region
- 5.3.1. North America
- 5.3.2. South America
- 5.3.3. Europe
- 5.3.4. Middle East & Africa
- 5.3.5. Asia Pacific
- 5.1. Market Analysis, Insights and Forecast - by Application
- 6. Global Cell Detachment Solution Analysis, Insights and Forecast, 2021-2033
- 6.1. Market Analysis, Insights and Forecast - by Application
- 6.1.1. Research Labs
- 6.1.2. Education
- 6.2. Market Analysis, Insights and Forecast - by Types
- 6.2.1. Accutase
- 6.2.2. Accumax
- 6.2.3. Other
- 6.1. Market Analysis, Insights and Forecast - by Application
- 7. North America Cell Detachment Solution Analysis, Insights and Forecast, 2020-2032
- 7.1. Market Analysis, Insights and Forecast - by Application
- 7.1.1. Research Labs
- 7.1.2. Education
- 7.2. Market Analysis, Insights and Forecast - by Types
- 7.2.1. Accutase
- 7.2.2. Accumax
- 7.2.3. Other
- 7.1. Market Analysis, Insights and Forecast - by Application
- 8. South America Cell Detachment Solution Analysis, Insights and Forecast, 2020-2032
- 8.1. Market Analysis, Insights and Forecast - by Application
- 8.1.1. Research Labs
- 8.1.2. Education
- 8.2. Market Analysis, Insights and Forecast - by Types
- 8.2.1. Accutase
- 8.2.2. Accumax
- 8.2.3. Other
- 8.1. Market Analysis, Insights and Forecast - by Application
- 9. Europe Cell Detachment Solution Analysis, Insights and Forecast, 2020-2032
- 9.1. Market Analysis, Insights and Forecast - by Application
- 9.1.1. Research Labs
- 9.1.2. Education
- 9.2. Market Analysis, Insights and Forecast - by Types
- 9.2.1. Accutase
- 9.2.2. Accumax
- 9.2.3. Other
- 9.1. Market Analysis, Insights and Forecast - by Application
- 10. Middle East & Africa Cell Detachment Solution Analysis, Insights and Forecast, 2020-2032
- 10.1. Market Analysis, Insights and Forecast - by Application
- 10.1.1. Research Labs
- 10.1.2. Education
- 10.2. Market Analysis, Insights and Forecast - by Types
- 10.2.1. Accutase
- 10.2.2. Accumax
- 10.2.3. Other
- 10.1. Market Analysis, Insights and Forecast - by Application
- 11. Asia Pacific Cell Detachment Solution Analysis, Insights and Forecast, 2020-2032
- 11.1. Market Analysis, Insights and Forecast - by Application
- 11.1.1. Research Labs
- 11.1.2. Education
- 11.2. Market Analysis, Insights and Forecast - by Types
- 11.2.1. Accutase
- 11.2.2. Accumax
- 11.2.3. Other
- 11.1. Market Analysis, Insights and Forecast - by Application
- 12. Competitive Analysis
- 12.1. Company Profiles
- 12.1.1 Merck
- 12.1.1.1. Company Overview
- 12.1.1.2. Products
- 12.1.1.3. Company Financials
- 12.1.1.4. SWOT Analysis
- 12.1.2 STEMCELL Technologies
- 12.1.2.1. Company Overview
- 12.1.2.2. Products
- 12.1.2.3. Company Financials
- 12.1.2.4. SWOT Analysis
- 12.1.3 BD Biosciences
- 12.1.3.1. Company Overview
- 12.1.3.2. Products
- 12.1.3.3. Company Financials
- 12.1.3.4. SWOT Analysis
- 12.1.4 PromoCell
- 12.1.4.1. Company Overview
- 12.1.4.2. Products
- 12.1.4.3. Company Financials
- 12.1.4.4. SWOT Analysis
- 12.1.5 Thermo Fisher Scientific
- 12.1.5.1. Company Overview
- 12.1.5.2. Products
- 12.1.5.3. Company Financials
- 12.1.5.4. SWOT Analysis
- 12.1.6 Biological Industries
- 12.1.6.1. Company Overview
- 12.1.6.2. Products
- 12.1.6.3. Company Financials
- 12.1.6.4. SWOT Analysis
- 12.1.7 Cellseco
- 12.1.7.1. Company Overview
- 12.1.7.2. Products
- 12.1.7.3. Company Financials
- 12.1.7.4. SWOT Analysis
- 12.1.8 Corning
- 12.1.8.1. Company Overview
- 12.1.8.2. Products
- 12.1.8.3. Company Financials
- 12.1.8.4. SWOT Analysis
- 12.1.9 Capricorn Scientific
- 12.1.9.1. Company Overview
- 12.1.9.2. Products
- 12.1.9.3. Company Financials
- 12.1.9.4. SWOT Analysis
- 12.1.10 Biowest
- 12.1.10.1. Company Overview
- 12.1.10.2. Products
- 12.1.10.3. Company Financials
- 12.1.10.4. SWOT Analysis
- 12.1.11 Biosera
- 12.1.11.1. Company Overview
- 12.1.11.2. Products
- 12.1.11.3. Company Financials
- 12.1.11.4. SWOT Analysis
- 12.1.12 Genlantis
- 12.1.12.1. Company Overview
- 12.1.12.2. Products
- 12.1.12.3. Company Financials
- 12.1.12.4. SWOT Analysis
- 12.1.13 Funakoshi
- 12.1.13.1. Company Overview
- 12.1.13.2. Products
- 12.1.13.3. Company Financials
- 12.1.13.4. SWOT Analysis
- 12.1.1 Merck
- 12.2. Market Entropy
- 12.2.1 Company's Key Areas Served
- 12.2.2 Recent Developments
- 12.3. Company Market Share Analysis 2025
- 12.3.1 Top 5 Companies Market Share Analysis
- 12.3.2 Top 3 Companies Market Share Analysis
- 12.4. List of Potential Customers
- 13. Research Methodology
List of Figures
- Figure 1: Global Cell Detachment Solution Revenue Breakdown (billion, %) by Region 2025 & 2033
- Figure 2: Global Cell Detachment Solution Volume Breakdown (K, %) by Region 2025 & 2033
- Figure 3: North America Cell Detachment Solution Revenue (billion), by Application 2025 & 2033
- Figure 4: North America Cell Detachment Solution Volume (K), by Application 2025 & 2033
- Figure 5: North America Cell Detachment Solution Revenue Share (%), by Application 2025 & 2033
- Figure 6: North America Cell Detachment Solution Volume Share (%), by Application 2025 & 2033
- Figure 7: North America Cell Detachment Solution Revenue (billion), by Types 2025 & 2033
- Figure 8: North America Cell Detachment Solution Volume (K), by Types 2025 & 2033
- Figure 9: North America Cell Detachment Solution Revenue Share (%), by Types 2025 & 2033
- Figure 10: North America Cell Detachment Solution Volume Share (%), by Types 2025 & 2033
- Figure 11: North America Cell Detachment Solution Revenue (billion), by Country 2025 & 2033
- Figure 12: North America Cell Detachment Solution Volume (K), by Country 2025 & 2033
- Figure 13: North America Cell Detachment Solution Revenue Share (%), by Country 2025 & 2033
- Figure 14: North America Cell Detachment Solution Volume Share (%), by Country 2025 & 2033
- Figure 15: South America Cell Detachment Solution Revenue (billion), by Application 2025 & 2033
- Figure 16: South America Cell Detachment Solution Volume (K), by Application 2025 & 2033
- Figure 17: South America Cell Detachment Solution Revenue Share (%), by Application 2025 & 2033
- Figure 18: South America Cell Detachment Solution Volume Share (%), by Application 2025 & 2033
- Figure 19: South America Cell Detachment Solution Revenue (billion), by Types 2025 & 2033
- Figure 20: South America Cell Detachment Solution Volume (K), by Types 2025 & 2033
- Figure 21: South America Cell Detachment Solution Revenue Share (%), by Types 2025 & 2033
- Figure 22: South America Cell Detachment Solution Volume Share (%), by Types 2025 & 2033
- Figure 23: South America Cell Detachment Solution Revenue (billion), by Country 2025 & 2033
- Figure 24: South America Cell Detachment Solution Volume (K), by Country 2025 & 2033
- Figure 25: South America Cell Detachment Solution Revenue Share (%), by Country 2025 & 2033
- Figure 26: South America Cell Detachment Solution Volume Share (%), by Country 2025 & 2033
- Figure 27: Europe Cell Detachment Solution Revenue (billion), by Application 2025 & 2033
- Figure 28: Europe Cell Detachment Solution Volume (K), by Application 2025 & 2033
- Figure 29: Europe Cell Detachment Solution Revenue Share (%), by Application 2025 & 2033
- Figure 30: Europe Cell Detachment Solution Volume Share (%), by Application 2025 & 2033
- Figure 31: Europe Cell Detachment Solution Revenue (billion), by Types 2025 & 2033
- Figure 32: Europe Cell Detachment Solution Volume (K), by Types 2025 & 2033
- Figure 33: Europe Cell Detachment Solution Revenue Share (%), by Types 2025 & 2033
- Figure 34: Europe Cell Detachment Solution Volume Share (%), by Types 2025 & 2033
- Figure 35: Europe Cell Detachment Solution Revenue (billion), by Country 2025 & 2033
- Figure 36: Europe Cell Detachment Solution Volume (K), by Country 2025 & 2033
- Figure 37: Europe Cell Detachment Solution Revenue Share (%), by Country 2025 & 2033
- Figure 38: Europe Cell Detachment Solution Volume Share (%), by Country 2025 & 2033
- Figure 39: Middle East & Africa Cell Detachment Solution Revenue (billion), by Application 2025 & 2033
- Figure 40: Middle East & Africa Cell Detachment Solution Volume (K), by Application 2025 & 2033
- Figure 41: Middle East & Africa Cell Detachment Solution Revenue Share (%), by Application 2025 & 2033
- Figure 42: Middle East & Africa Cell Detachment Solution Volume Share (%), by Application 2025 & 2033
- Figure 43: Middle East & Africa Cell Detachment Solution Revenue (billion), by Types 2025 & 2033
- Figure 44: Middle East & Africa Cell Detachment Solution Volume (K), by Types 2025 & 2033
- Figure 45: Middle East & Africa Cell Detachment Solution Revenue Share (%), by Types 2025 & 2033
- Figure 46: Middle East & Africa Cell Detachment Solution Volume Share (%), by Types 2025 & 2033
- Figure 47: Middle East & Africa Cell Detachment Solution Revenue (billion), by Country 2025 & 2033
- Figure 48: Middle East & Africa Cell Detachment Solution Volume (K), by Country 2025 & 2033
- Figure 49: Middle East & Africa Cell Detachment Solution Revenue Share (%), by Country 2025 & 2033
- Figure 50: Middle East & Africa Cell Detachment Solution Volume Share (%), by Country 2025 & 2033
- Figure 51: Asia Pacific Cell Detachment Solution Revenue (billion), by Application 2025 & 2033
- Figure 52: Asia Pacific Cell Detachment Solution Volume (K), by Application 2025 & 2033
- Figure 53: Asia Pacific Cell Detachment Solution Revenue Share (%), by Application 2025 & 2033
- Figure 54: Asia Pacific Cell Detachment Solution Volume Share (%), by Application 2025 & 2033
- Figure 55: Asia Pacific Cell Detachment Solution Revenue (billion), by Types 2025 & 2033
- Figure 56: Asia Pacific Cell Detachment Solution Volume (K), by Types 2025 & 2033
- Figure 57: Asia Pacific Cell Detachment Solution Revenue Share (%), by Types 2025 & 2033
- Figure 58: Asia Pacific Cell Detachment Solution Volume Share (%), by Types 2025 & 2033
- Figure 59: Asia Pacific Cell Detachment Solution Revenue (billion), by Country 2025 & 2033
- Figure 60: Asia Pacific Cell Detachment Solution Volume (K), by Country 2025 & 2033
- Figure 61: Asia Pacific Cell Detachment Solution Revenue Share (%), by Country 2025 & 2033
- Figure 62: Asia Pacific Cell Detachment Solution Volume Share (%), by Country 2025 & 2033
List of Tables
- Table 1: Global Cell Detachment Solution Revenue billion Forecast, by Application 2020 & 2033
- Table 2: Global Cell Detachment Solution Volume K Forecast, by Application 2020 & 2033
- Table 3: Global Cell Detachment Solution Revenue billion Forecast, by Types 2020 & 2033
- Table 4: Global Cell Detachment Solution Volume K Forecast, by Types 2020 & 2033
- Table 5: Global Cell Detachment Solution Revenue billion Forecast, by Region 2020 & 2033
- Table 6: Global Cell Detachment Solution Volume K Forecast, by Region 2020 & 2033
- Table 7: Global Cell Detachment Solution Revenue billion Forecast, by Application 2020 & 2033
- Table 8: Global Cell Detachment Solution Volume K Forecast, by Application 2020 & 2033
- Table 9: Global Cell Detachment Solution Revenue billion Forecast, by Types 2020 & 2033
- Table 10: Global Cell Detachment Solution Volume K Forecast, by Types 2020 & 2033
- Table 11: Global Cell Detachment Solution Revenue billion Forecast, by Country 2020 & 2033
- Table 12: Global Cell Detachment Solution Volume K Forecast, by Country 2020 & 2033
- Table 13: United States Cell Detachment Solution Revenue (billion) Forecast, by Application 2020 & 2033
- Table 14: United States Cell Detachment Solution Volume (K) Forecast, by Application 2020 & 2033
- Table 15: Canada Cell Detachment Solution Revenue (billion) Forecast, by Application 2020 & 2033
- Table 16: Canada Cell Detachment Solution Volume (K) Forecast, by Application 2020 & 2033
- Table 17: Mexico Cell Detachment Solution Revenue (billion) Forecast, by Application 2020 & 2033
- Table 18: Mexico Cell Detachment Solution Volume (K) Forecast, by Application 2020 & 2033
- Table 19: Global Cell Detachment Solution Revenue billion Forecast, by Application 2020 & 2033
- Table 20: Global Cell Detachment Solution Volume K Forecast, by Application 2020 & 2033
- Table 21: Global Cell Detachment Solution Revenue billion Forecast, by Types 2020 & 2033
- Table 22: Global Cell Detachment Solution Volume K Forecast, by Types 2020 & 2033
- Table 23: Global Cell Detachment Solution Revenue billion Forecast, by Country 2020 & 2033
- Table 24: Global Cell Detachment Solution Volume K Forecast, by Country 2020 & 2033
- Table 25: Brazil Cell Detachment Solution Revenue (billion) Forecast, by Application 2020 & 2033
- Table 26: Brazil Cell Detachment Solution Volume (K) Forecast, by Application 2020 & 2033
- Table 27: Argentina Cell Detachment Solution Revenue (billion) Forecast, by Application 2020 & 2033
- Table 28: Argentina Cell Detachment Solution Volume (K) Forecast, by Application 2020 & 2033
- Table 29: Rest of South America Cell Detachment Solution Revenue (billion) Forecast, by Application 2020 & 2033
- Table 30: Rest of South America Cell Detachment Solution Volume (K) Forecast, by Application 2020 & 2033
- Table 31: Global Cell Detachment Solution Revenue billion Forecast, by Application 2020 & 2033
- Table 32: Global Cell Detachment Solution Volume K Forecast, by Application 2020 & 2033
- Table 33: Global Cell Detachment Solution Revenue billion Forecast, by Types 2020 & 2033
- Table 34: Global Cell Detachment Solution Volume K Forecast, by Types 2020 & 2033
- Table 35: Global Cell Detachment Solution Revenue billion Forecast, by Country 2020 & 2033
- Table 36: Global Cell Detachment Solution Volume K Forecast, by Country 2020 & 2033
- Table 37: United Kingdom Cell Detachment Solution Revenue (billion) Forecast, by Application 2020 & 2033
- Table 38: United Kingdom Cell Detachment Solution Volume (K) Forecast, by Application 2020 & 2033
- Table 39: Germany Cell Detachment Solution Revenue (billion) Forecast, by Application 2020 & 2033
- Table 40: Germany Cell Detachment Solution Volume (K) Forecast, by Application 2020 & 2033
- Table 41: France Cell Detachment Solution Revenue (billion) Forecast, by Application 2020 & 2033
- Table 42: France Cell Detachment Solution Volume (K) Forecast, by Application 2020 & 2033
- Table 43: Italy Cell Detachment Solution Revenue (billion) Forecast, by Application 2020 & 2033
- Table 44: Italy Cell Detachment Solution Volume (K) Forecast, by Application 2020 & 2033
- Table 45: Spain Cell Detachment Solution Revenue (billion) Forecast, by Application 2020 & 2033
- Table 46: Spain Cell Detachment Solution Volume (K) Forecast, by Application 2020 & 2033
- Table 47: Russia Cell Detachment Solution Revenue (billion) Forecast, by Application 2020 & 2033
- Table 48: Russia Cell Detachment Solution Volume (K) Forecast, by Application 2020 & 2033
- Table 49: Benelux Cell Detachment Solution Revenue (billion) Forecast, by Application 2020 & 2033
- Table 50: Benelux Cell Detachment Solution Volume (K) Forecast, by Application 2020 & 2033
- Table 51: Nordics Cell Detachment Solution Revenue (billion) Forecast, by Application 2020 & 2033
- Table 52: Nordics Cell Detachment Solution Volume (K) Forecast, by Application 2020 & 2033
- Table 53: Rest of Europe Cell Detachment Solution Revenue (billion) Forecast, by Application 2020 & 2033
- Table 54: Rest of Europe Cell Detachment Solution Volume (K) Forecast, by Application 2020 & 2033
- Table 55: Global Cell Detachment Solution Revenue billion Forecast, by Application 2020 & 2033
- Table 56: Global Cell Detachment Solution Volume K Forecast, by Application 2020 & 2033
- Table 57: Global Cell Detachment Solution Revenue billion Forecast, by Types 2020 & 2033
- Table 58: Global Cell Detachment Solution Volume K Forecast, by Types 2020 & 2033
- Table 59: Global Cell Detachment Solution Revenue billion Forecast, by Country 2020 & 2033
- Table 60: Global Cell Detachment Solution Volume K Forecast, by Country 2020 & 2033
- Table 61: Turkey Cell Detachment Solution Revenue (billion) Forecast, by Application 2020 & 2033
- Table 62: Turkey Cell Detachment Solution Volume (K) Forecast, by Application 2020 & 2033
- Table 63: Israel Cell Detachment Solution Revenue (billion) Forecast, by Application 2020 & 2033
- Table 64: Israel Cell Detachment Solution Volume (K) Forecast, by Application 2020 & 2033
- Table 65: GCC Cell Detachment Solution Revenue (billion) Forecast, by Application 2020 & 2033
- Table 66: GCC Cell Detachment Solution Volume (K) Forecast, by Application 2020 & 2033
- Table 67: North Africa Cell Detachment Solution Revenue (billion) Forecast, by Application 2020 & 2033
- Table 68: North Africa Cell Detachment Solution Volume (K) Forecast, by Application 2020 & 2033
- Table 69: South Africa Cell Detachment Solution Revenue (billion) Forecast, by Application 2020 & 2033
- Table 70: South Africa Cell Detachment Solution Volume (K) Forecast, by Application 2020 & 2033
- Table 71: Rest of Middle East & Africa Cell Detachment Solution Revenue (billion) Forecast, by Application 2020 & 2033
- Table 72: Rest of Middle East & Africa Cell Detachment Solution Volume (K) Forecast, by Application 2020 & 2033
- Table 73: Global Cell Detachment Solution Revenue billion Forecast, by Application 2020 & 2033
- Table 74: Global Cell Detachment Solution Volume K Forecast, by Application 2020 & 2033
- Table 75: Global Cell Detachment Solution Revenue billion Forecast, by Types 2020 & 2033
- Table 76: Global Cell Detachment Solution Volume K Forecast, by Types 2020 & 2033
- Table 77: Global Cell Detachment Solution Revenue billion Forecast, by Country 2020 & 2033
- Table 78: Global Cell Detachment Solution Volume K Forecast, by Country 2020 & 2033
- Table 79: China Cell Detachment Solution Revenue (billion) Forecast, by Application 2020 & 2033
- Table 80: China Cell Detachment Solution Volume (K) Forecast, by Application 2020 & 2033
- Table 81: India Cell Detachment Solution Revenue (billion) Forecast, by Application 2020 & 2033
- Table 82: India Cell Detachment Solution Volume (K) Forecast, by Application 2020 & 2033
- Table 83: Japan Cell Detachment Solution Revenue (billion) Forecast, by Application 2020 & 2033
- Table 84: Japan Cell Detachment Solution Volume (K) Forecast, by Application 2020 & 2033
- Table 85: South Korea Cell Detachment Solution Revenue (billion) Forecast, by Application 2020 & 2033
- Table 86: South Korea Cell Detachment Solution Volume (K) Forecast, by Application 2020 & 2033
- Table 87: ASEAN Cell Detachment Solution Revenue (billion) Forecast, by Application 2020 & 2033
- Table 88: ASEAN Cell Detachment Solution Volume (K) Forecast, by Application 2020 & 2033
- Table 89: Oceania Cell Detachment Solution Revenue (billion) Forecast, by Application 2020 & 2033
- Table 90: Oceania Cell Detachment Solution Volume (K) Forecast, by Application 2020 & 2033
- Table 91: Rest of Asia Pacific Cell Detachment Solution Revenue (billion) Forecast, by Application 2020 & 2033
- Table 92: Rest of Asia Pacific Cell Detachment Solution Volume (K) Forecast, by Application 2020 & 2033
Frequently Asked Questions
1. What is the projected Compound Annual Growth Rate (CAGR) of the Cell Detachment Solution?
The projected CAGR is approximately 11.98%.
2. Which companies are prominent players in the Cell Detachment Solution?
Key companies in the market include Merck, STEMCELL Technologies, BD Biosciences, PromoCell, Thermo Fisher Scientific, Biological Industries, Cellseco, Corning, Capricorn Scientific, Biowest, Biosera, Genlantis, Funakoshi.
3. What are the main segments of the Cell Detachment Solution?
The market segments include Application, Types.
4. Can you provide details about the market size?
The market size is estimated to be USD 32.2 billion as of 2022.
5. What are some drivers contributing to market growth?
N/A
6. What are the notable trends driving market growth?
N/A
7. Are there any restraints impacting market growth?
N/A
8. Can you provide examples of recent developments in the market?
N/A
9. What pricing options are available for accessing the report?
Pricing options include single-user, multi-user, and enterprise licenses priced at USD 3950.00, USD 5925.00, and USD 7900.00 respectively.
10. Is the market size provided in terms of value or volume?
The market size is provided in terms of value, measured in billion and volume, measured in K.
11. Are there any specific market keywords associated with the report?
Yes, the market keyword associated with the report is "Cell Detachment Solution," which aids in identifying and referencing the specific market segment covered.
12. How do I determine which pricing option suits my needs best?
The pricing options vary based on user requirements and access needs. Individual users may opt for single-user licenses, while businesses requiring broader access may choose multi-user or enterprise licenses for cost-effective access to the report.
13. Are there any additional resources or data provided in the Cell Detachment Solution report?
While the report offers comprehensive insights, it's advisable to review the specific contents or supplementary materials provided to ascertain if additional resources or data are available.
14. How can I stay updated on further developments or reports in the Cell Detachment Solution?
To stay informed about further developments, trends, and reports in the Cell Detachment Solution, consider subscribing to industry newsletters, following relevant companies and organizations, or regularly checking reputable industry news sources and publications.
Methodology
Step 1 - Identification of Relevant Samples Size from Population Database


Step 2 - Approaches for Defining Global Market Size (Value, Volume* & Price*)

Note*: In applicable scenarios
Step 3 - Data Sources
Primary Research
- Web Analytics
- Survey Reports
- Research Institute
- Latest Research Reports
- Opinion Leaders
Secondary Research
- Annual Reports
- White Paper
- Latest Press Release
- Industry Association
- Paid Database
- Investor Presentations

Step 4 - Data Triangulation
Involves using different sources of information in order to increase the validity of a study
These sources are likely to be stakeholders in a program - participants, other researchers, program staff, other community members, and so on.
Then we put all data in single framework & apply various statistical tools to find out the dynamic on the market.
During the analysis stage, feedback from the stakeholder groups would be compared to determine areas of agreement as well as areas of divergence