


Key Insights
The global bleeding disorders market is projected for substantial growth, fueled by heightened awareness, therapeutic advancements, and an expanding patient base. The market was valued at 109.8 million in the base year of 2025, and is expected to achieve a Compound Annual Growth Rate (CAGR) of 8.1% through 2033. Key drivers include the increasing incidence of hemophilia A and B, alongside greater utilization of both plasma-derived and recombinant coagulation factor concentrates. The emergence of innovative treatments, such as gene therapies and advanced prophylactic regimens, significantly contributes to market expansion. Furthermore, enhanced diagnostic capabilities and improved healthcare accessibility in developing economies are anticipated to create new market avenues. The prevalence of acquired bleeding disorders and the development of more effective management protocols for these conditions will also be pivotal in shaping the market's future.
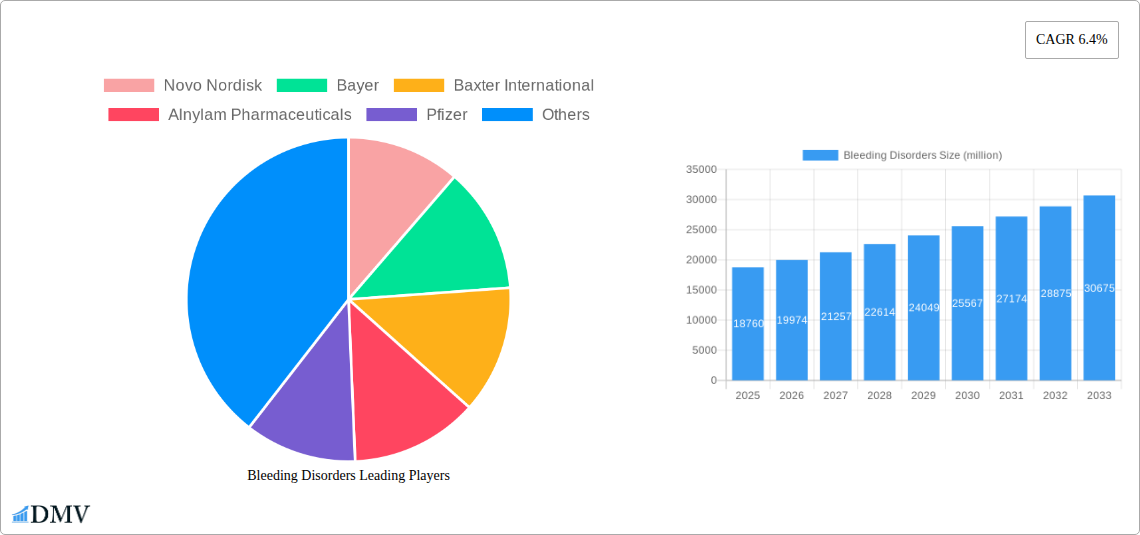
Bleeding Disorders Market Size (In Million)

While the market outlook is positive, several factors may influence growth dynamics. The significant cost of advanced therapies and potential reimbursement hurdles in specific regions could act as constraints. Additionally, the lifelong treatment requirements for many bleeding disorder patients and the complexities in managing rare bleeding disorders necessitate continuous innovation and accessible healthcare solutions. However, ongoing research and development, supported by strategic industry collaborations, are actively addressing these challenges. The market is increasingly focusing on personalized treatment strategies and home-infusion therapies to enhance patient convenience and outcomes. This evolving landscape, marked by both opportunities and obstacles, is expected to foster a more sophisticated and patient-centered approach to bleeding disorder management in the foreseeable future.
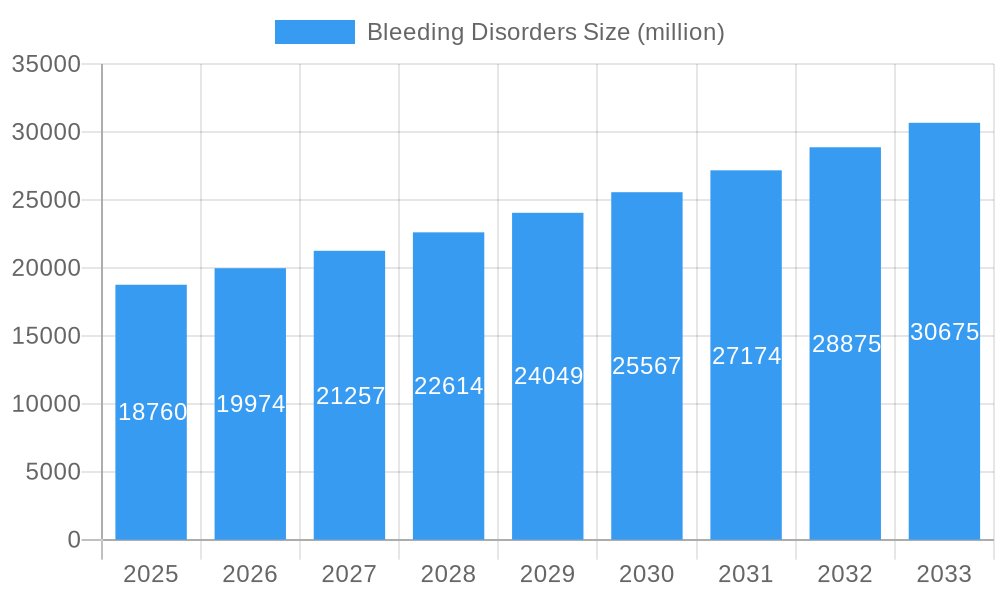
Bleeding Disorders Company Market Share
Bleeding Disorders Market Report: Comprehensive Analysis and Strategic Outlook (2019-2033)
This in-depth report provides a strategic analysis of the global bleeding disorders market, a critical segment of the hematology sector. With a study period spanning from 2019 to 2033, and a base year of 2025, this comprehensive research offers unparalleled insights for stakeholders including pharmaceutical companies, investors, healthcare providers, and regulatory bodies. We meticulously examine market composition, industry evolution, regional dominance, product innovations, growth drivers, obstacles, and future opportunities, culminating in a robust strategic forecast. The report leverages advanced analytics and expert opinions to deliver actionable intelligence, focusing on key applications like Hemophilia A and Hemophilia B, and treatment types including Plasma-derived Coagulation Factor Concentrates, Recombinant Coagulation Factor Concentrates, Desmopressin, Antifibrinolytics, and Fibrin Sealants. The market is projected to reach multi-million dollar valuations, driven by significant investment and unmet medical needs.
Bleeding Disorders Market Composition & Trends
The global bleeding disorders market exhibits a dynamic composition characterized by concentrated market share among major pharmaceutical giants and a steady influx of innovative therapies. Key innovation catalysts include advancements in gene therapy, novel antibody engineering, and improved drug delivery systems, all aimed at enhancing efficacy and patient compliance. The regulatory landscape, while stringent, is increasingly supportive of groundbreaking treatments, facilitating faster market access for novel solutions. Substitute products, though limited in the primary treatment of severe bleeding disorders, are evolving in areas of supportive care and prevention. End-user profiles are diverse, encompassing individuals with hemophilia A, hemophilia B, von Willebrand disease, and other rare bleeding disorders, with a growing emphasis on personalized medicine approaches. Mergers and acquisitions (M&A) activities are prevalent, driven by the pursuit of synergistic portfolios and market consolidation. M&A deal values are anticipated to reach several hundred million dollars, as larger entities acquire promising early-stage biotech firms. For instance, the market share distribution indicates that Novo Nordisk and Bayer currently hold significant portions of the market.
- Market Share Distribution (Estimated 2025):
- Leading players (e.g., Novo Nordisk, Bayer): 60-70%
- Mid-tier companies (e.g., Baxter International, Pfizer): 20-30%
- Emerging players (e.g., Alnylam Pharmaceuticals, Xenetic Biosciences): 5-10%
- M&A Activity Insights:
- Recent M&A deals in the bleeding disorders space have averaged between $200 million and $500 million.
- Strategic acquisitions focus on gene therapy platforms and novel hemostatic agents.
- Innovation Landscape:
- Significant R&D investment in gene therapies for hemophilia A and B.
- Development of extended half-life recombinant factor concentrates.
Bleeding Disorders Industry Evolution
The bleeding disorders industry has undergone a profound evolution, marked by remarkable growth trajectories and transformative technological advancements over the historical period of 2019-2024, with robust projections for the forecast period of 2025-2033. Initially dominated by plasma-derived coagulation factor concentrates, the market has witnessed a paradigm shift towards recombinant factor concentrates, offering enhanced safety profiles and greater control over manufacturing. This evolution has been driven by a confluence of factors including increasing global prevalence of bleeding disorders, improved diagnostic capabilities leading to earlier identification, and a growing demand for more effective and convenient treatment options. The adoption of recombinant therapies has accelerated significantly, driven by their superior efficacy and reduced risk of viral transmission compared to older plasma-derived products.
Furthermore, the advent of novel therapeutic modalities, such as gene therapy and non-factor therapeutics, is poised to revolutionize treatment paradigms. Gene therapy, in particular, holds immense promise for offering potentially curative solutions for hemophilia, with early clinical trials demonstrating significant reductions in bleeding events and factor replacement needs. This shift towards more durable and potentially curative treatments is a testament to the industry's commitment to innovation. Consumer demands are increasingly focused on quality of life improvements, reduced treatment burden, and the long-term management of chronic conditions. This has spurred the development of less frequent dosing regimens, such as extended half-life factor concentrates, and prophylactic treatment strategies that aim to prevent bleeds rather than just treat them. The market growth rate has been consistently in the high single digits, and is projected to maintain this momentum, reaching multi-million dollar valuations annually. The estimated market size for 2025 is projected to be in excess of several billion dollars, with the forecast period anticipating continued exponential growth driven by these technological and demand-driven shifts.
- Historical Growth (2019-2024): Average annual growth rate of approximately 7-9%.
- Projected Growth (2025-2033): Anticipated average annual growth rate of 9-12%.
- Technological Adoption Metrics:
- Recombinant Factor Concentrates: Over 85% market share in developed nations.
- Gene Therapy: Initial adoption in niche patient populations, expected to expand significantly by 2030.
- Shifting Consumer Demands:
- Increased demand for prophylactic treatments to prevent joint damage.
- Preference for less frequent infusions and at-home treatment options.
Leading Regions, Countries, or Segments in Bleeding Disorders
The bleeding disorders market is characterized by distinct regional leadership, with North America and Europe emerging as the dominant forces due to robust healthcare infrastructure, high disease awareness, and significant investment in research and development. Within the Application segment, Hemophilia A commands the largest market share, followed by Hemophilia B, and then Others which includes conditions like von Willebrand disease and rare factor deficiencies. This dominance is attributed to the higher prevalence of Hemophilia A and the availability of advanced treatment options.
In terms of Type, Recombinant Coagulation Factor Concentrates are leading the market, surpassing Plasma-derived Coagulation Factor Concentrates in terms of market penetration and growth potential. This shift is driven by their improved safety profiles and consistent availability. Desmopressin plays a significant role in managing mild Hemophilia A and von Willebrand disease. Antifibrinolytics and Fibrin Sealants are crucial for managing bleeding in various surgical and trauma settings, contributing to the "Others" category in treatment types. The dominance of specific regions and segments is propelled by several key drivers:
- North America:
- Key Drivers: High per capita healthcare spending, advanced diagnostic and treatment centers, strong presence of leading pharmaceutical companies like Pfizer and Bristol-Myers Squibb Company, and favorable reimbursement policies for novel therapies.
- Dominance Factors: Early adoption of gene therapies and extended half-life factor concentrates, a well-established patient advocacy network driving awareness and demand.
- Europe:
- Key Drivers: Universal healthcare systems facilitating broad access to treatments, significant government funding for R&D, and a growing pipeline of innovative therapies from companies like Sanofi and Janssen Global Services.
- Dominance Factors: Strict regulatory approvals that ensure high product quality, proactive hemophilia management programs, and increasing demand for personalized treatment approaches.
- Application Segments:
- Hemophilia A: Dominant due to higher incidence rates and continuous innovation in factor VIII replacement therapies and gene therapy.
- Hemophilia B: A rapidly growing segment with significant investment in factor IX replacement and gene therapy research.
- Treatment Type Segments:
- Recombinant Coagulation Factor Concentrates: Leading due to superior safety, efficacy, and improved manufacturing processes, offering a more predictable supply chain than plasma-derived products.
- Plasma-derived Coagulation Factor Concentrates: Still significant, particularly in regions with limited access to recombinant alternatives, but facing gradual decline.
Bleeding Disorders Product Innovations
Product innovation in the bleeding disorders market is rapidly transforming patient care, with a strong focus on developing safer, more effective, and convenient treatment options. Gene therapies are at the forefront, offering the potential for long-term remission by correcting the underlying genetic defect. Extended half-life recombinant coagulation factor concentrates are another significant advancement, reducing the frequency of infusions and improving adherence and quality of life for patients with hemophilia. Novel antibody-based therapies are also emerging, providing alternative treatment pathways for patients who have developed inhibitors. These innovations are characterized by their unique selling propositions, such as single-dose potential for gene therapies or monthly dosing for extended half-life products, addressing the unmet need for less burdensome and more durable treatment solutions. Technological advancements include sophisticated gene editing tools, improved viral vector delivery systems, and the development of bispecific antibodies that mimic natural clotting factors.
Propelling Factors for Bleeding Disorders Growth
The global bleeding disorders market is experiencing robust growth propelled by several key factors. Increasing global prevalence of rare bleeding disorders, coupled with enhanced diagnostic capabilities leading to earlier and more accurate diagnoses, significantly expands the patient pool. Technological advancements, particularly in gene therapy and the development of extended half-life recombinant factor concentrates, are driving the adoption of novel and more effective treatments. Favorable regulatory environments in key markets, coupled with substantial R&D investments by leading companies such as Novo Nordisk, Bayer, and Pfizer, are accelerating the development and approval of innovative therapies. Economic growth in emerging markets is also contributing to increased healthcare expenditure and access to advanced treatments.
- Technological Advancements: Gene therapy, extended half-life concentrates, bispecific antibodies.
- Increased Disease Awareness and Diagnosis: Early detection leading to higher treatment rates.
- Favorable Reimbursement Policies: Supporting access to high-cost innovative treatments.
- Growing R&D Investments: Pipeline expansion by major players like Alnylam Pharmaceuticals and Sanofi.
Obstacles in the Bleeding Disorders Market
Despite significant progress, the bleeding disorders market faces several obstacles that can impede growth and patient access. The high cost of innovative therapies, particularly gene therapies, presents a significant challenge for healthcare systems and patients globally, leading to questions of affordability and reimbursement. Stringent and complex regulatory approval processes, while ensuring product safety, can lead to prolonged development timelines and market entry delays. Supply chain disruptions, especially for plasma-derived products, can impact availability and consistency. Furthermore, the development of inhibitors in patients receiving factor replacement therapy remains a clinical challenge, necessitating alternative treatment strategies. Competitive pressures among established players and emerging biotech firms can also lead to pricing challenges and market fragmentation.
- High Treatment Costs: Gene therapies and novel biologics are exceptionally expensive.
- Regulatory Hurdles: Lengthy approval processes can delay market access.
- Supply Chain Vulnerabilities: Particularly for plasma-derived products.
- Development of Inhibitors: A persistent clinical challenge for hemophilia patients.
Future Opportunities in Bleeding Disorders
The bleeding disorders landscape is ripe with emerging opportunities for innovation and market expansion. The untapped potential in rare bleeding disorders beyond hemophilia presents a significant growth avenue. Advancements in precision medicine and diagnostics will enable more personalized treatment approaches, tailoring therapies to individual patient profiles and genetic makeup. The global expansion of gene therapy into new indications and broader patient populations is a major opportunity, promising potentially curative solutions. Furthermore, the increasing focus on home-based treatments and digital health solutions will improve patient convenience and adherence. Emerging markets in Asia-Pacific and Latin America, with their growing economies and increasing healthcare investments, represent significant untapped markets for advanced bleeding disorder therapies.
- Personalized Medicine: Tailoring treatments based on genetic profiles.
- Gene Therapy Expansion: Moving beyond current indications to broader patient groups.
- Emerging Markets: Significant untapped potential in developing economies.
- Digital Health Integration: Enhancing patient monitoring and support.
Major Players in the Bleeding Disorders Ecosystem
The bleeding disorders ecosystem is characterized by the presence of leading pharmaceutical and biotechnology companies that are at the forefront of research, development, and commercialization of treatments. These companies are actively engaged in addressing the unmet needs of patients with various bleeding disorders through a diversified portfolio of innovative therapies.
- Novo Nordisk
- Bayer
- Baxter International
- Alnylam Pharmaceuticals
- Pfizer
- Xenetic Biosciences
- Bristol-Myers Squibb Company
- Sanofi
- Janssen Global Services
- Bioverativ
- Amgen
Key Developments in Bleeding Disorders Industry
The bleeding disorders industry has witnessed significant developments that have reshaped the treatment landscape and improved patient outcomes. These advancements span from novel product launches to strategic partnerships and regulatory approvals, underscoring the dynamic nature of this therapeutic area.
- 2023/2024: Continued clinical trials for multiple gene therapy candidates for Hemophilia A and B, showing promising results in reducing bleeding events and factor replacement needs.
- 2023: Regulatory approval of new extended half-life factor concentrates offering less frequent dosing intervals, improving patient convenience.
- 2022: Strategic collaborations between biotech firms and large pharmaceutical companies to accelerate the development of novel non-factor therapeutics and gene editing technologies.
- 2021: Increased focus on real-world evidence studies to demonstrate the long-term effectiveness and cost-effectiveness of advanced bleeding disorder treatments.
- 2020: Advancements in diagnostic tools and genetic testing enabling earlier and more accurate identification of bleeding disorder subtypes.
Strategic Bleeding Disorders Market Forecast
The strategic forecast for the bleeding disorders market predicts continued robust growth, driven by an unprecedented wave of innovation and expanding global access to advanced therapies. Gene therapy is poised to become a transformative force, offering potentially curative options and fundamentally altering treatment paradigms. The development of next-generation extended half-life factor concentrates and novel non-factor therapies will further enhance patient convenience and treatment efficacy. Increased investment in emerging markets and a growing focus on rare bleeding disorders beyond hemophilia will unlock new growth avenues. The market is projected to reach multi-million dollar valuations annually, driven by these catalysts and a sustained commitment to improving the lives of individuals affected by bleeding disorders.
Bleeding Disorders Segmentation
-
1. Application
- 1.1. Hemophilia A
- 1.2. Hemophilia B
- 1.3. Others
-
2. Type
- 2.1. Plasma-derived Coagulation Factor Concentrates
- 2.2. Recombinant Coagulation Factor Concentrates
- 2.3. Desmopressin
- 2.4. Antifibrinolytics
- 2.5. Fibrin Sealants
- 2.6. Others
Bleeding Disorders Segmentation By Geography
-
1. North America
- 1.1. United States
- 1.2. Canada
- 1.3. Mexico
-
2. South America
- 2.1. Brazil
- 2.2. Argentina
- 2.3. Rest of South America
-
3. Europe
- 3.1. United Kingdom
- 3.2. Germany
- 3.3. France
- 3.4. Italy
- 3.5. Spain
- 3.6. Russia
- 3.7. Benelux
- 3.8. Nordics
- 3.9. Rest of Europe
-
4. Middle East & Africa
- 4.1. Turkey
- 4.2. Israel
- 4.3. GCC
- 4.4. North Africa
- 4.5. South Africa
- 4.6. Rest of Middle East & Africa
-
5. Asia Pacific
- 5.1. China
- 5.2. India
- 5.3. Japan
- 5.4. South Korea
- 5.5. ASEAN
- 5.6. Oceania
- 5.7. Rest of Asia Pacific
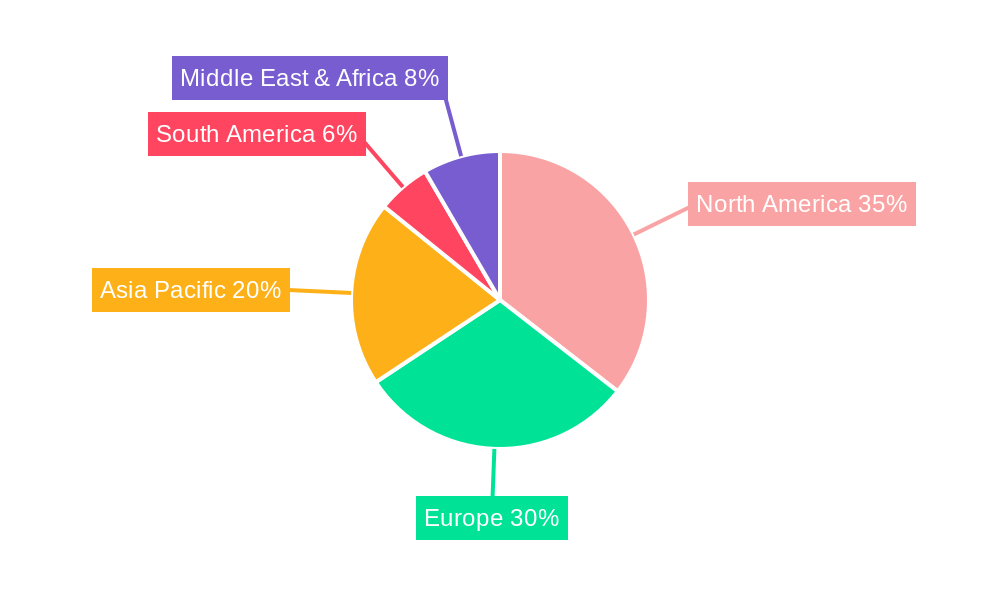
Bleeding Disorders Regional Market Share
Geographic Coverage of Bleeding Disorders
Bleeding Disorders REPORT HIGHLIGHTS
| Aspects | Details |
|---|---|
| Study Period | 2020-2034 |
| Base Year | 2025 |
| Estimated Year | 2026 |
| Forecast Period | 2026-2034 |
| Historical Period | 2020-2025 |
| Growth Rate | CAGR of 8.1% from 2020-2034 |
| Segmentation |
|
Table of Contents
- 1. Introduction
- 1.1. Research Scope
- 1.2. Market Segmentation
- 1.3. Research Objective
- 1.4. Definitions and Assumptions
- 2. Executive Summary
- 2.1. Market Snapshot
- 3. Market Dynamics
- 3.1. Market Drivers
- 3.2. Market Restrains
- 3.3. Market Trends
- 3.4. Market Opportunities
- 4. Market Factor Analysis
- 4.1. Porters Five Forces
- 4.1.1. Bargaining Power of Suppliers
- 4.1.2. Bargaining Power of Buyers
- 4.1.3. Threat of New Entrants
- 4.1.4. Threat of Substitutes
- 4.1.5. Competitive Rivalry
- 4.2. PESTEL analysis
- 4.3. BCG Analysis
- 4.3.1. Stars (High Growth, High Market Share)
- 4.3.2. Cash Cows (Low Growth, High Market Share)
- 4.3.3. Question Mark (High Growth, Low Market Share)
- 4.3.4. Dogs (Low Growth, Low Market Share)
- 4.4. Ansoff Matrix Analysis
- 4.5. Supply Chain Analysis
- 4.6. Regulatory Landscape
- 4.7. Current Market Potential and Opportunity Assessment (TAM–SAM–SOM Framework)
- 4.8. DMV Analyst Note
- 4.1. Porters Five Forces
- 5. Market Analysis, Insights and Forecast 2021-2033
- 5.1. Market Analysis, Insights and Forecast - by Application
- 5.1.1. Hemophilia A
- 5.1.2. Hemophilia B
- 5.1.3. Others
- 5.2. Market Analysis, Insights and Forecast - by Type
- 5.2.1. Plasma-derived Coagulation Factor Concentrates
- 5.2.2. Recombinant Coagulation Factor Concentrates
- 5.2.3. Desmopressin
- 5.2.4. Antifibrinolytics
- 5.2.5. Fibrin Sealants
- 5.2.6. Others
- 5.3. Market Analysis, Insights and Forecast - by Region
- 5.3.1. North America
- 5.3.2. South America
- 5.3.3. Europe
- 5.3.4. Middle East & Africa
- 5.3.5. Asia Pacific
- 5.1. Market Analysis, Insights and Forecast - by Application
- 6. Global Bleeding Disorders Analysis, Insights and Forecast, 2021-2033
- 6.1. Market Analysis, Insights and Forecast - by Application
- 6.1.1. Hemophilia A
- 6.1.2. Hemophilia B
- 6.1.3. Others
- 6.2. Market Analysis, Insights and Forecast - by Type
- 6.2.1. Plasma-derived Coagulation Factor Concentrates
- 6.2.2. Recombinant Coagulation Factor Concentrates
- 6.2.3. Desmopressin
- 6.2.4. Antifibrinolytics
- 6.2.5. Fibrin Sealants
- 6.2.6. Others
- 6.1. Market Analysis, Insights and Forecast - by Application
- 7. North America Bleeding Disorders Analysis, Insights and Forecast, 2020-2032
- 7.1. Market Analysis, Insights and Forecast - by Application
- 7.1.1. Hemophilia A
- 7.1.2. Hemophilia B
- 7.1.3. Others
- 7.2. Market Analysis, Insights and Forecast - by Type
- 7.2.1. Plasma-derived Coagulation Factor Concentrates
- 7.2.2. Recombinant Coagulation Factor Concentrates
- 7.2.3. Desmopressin
- 7.2.4. Antifibrinolytics
- 7.2.5. Fibrin Sealants
- 7.2.6. Others
- 7.1. Market Analysis, Insights and Forecast - by Application
- 8. South America Bleeding Disorders Analysis, Insights and Forecast, 2020-2032
- 8.1. Market Analysis, Insights and Forecast - by Application
- 8.1.1. Hemophilia A
- 8.1.2. Hemophilia B
- 8.1.3. Others
- 8.2. Market Analysis, Insights and Forecast - by Type
- 8.2.1. Plasma-derived Coagulation Factor Concentrates
- 8.2.2. Recombinant Coagulation Factor Concentrates
- 8.2.3. Desmopressin
- 8.2.4. Antifibrinolytics
- 8.2.5. Fibrin Sealants
- 8.2.6. Others
- 8.1. Market Analysis, Insights and Forecast - by Application
- 9. Europe Bleeding Disorders Analysis, Insights and Forecast, 2020-2032
- 9.1. Market Analysis, Insights and Forecast - by Application
- 9.1.1. Hemophilia A
- 9.1.2. Hemophilia B
- 9.1.3. Others
- 9.2. Market Analysis, Insights and Forecast - by Type
- 9.2.1. Plasma-derived Coagulation Factor Concentrates
- 9.2.2. Recombinant Coagulation Factor Concentrates
- 9.2.3. Desmopressin
- 9.2.4. Antifibrinolytics
- 9.2.5. Fibrin Sealants
- 9.2.6. Others
- 9.1. Market Analysis, Insights and Forecast - by Application
- 10. Middle East & Africa Bleeding Disorders Analysis, Insights and Forecast, 2020-2032
- 10.1. Market Analysis, Insights and Forecast - by Application
- 10.1.1. Hemophilia A
- 10.1.2. Hemophilia B
- 10.1.3. Others
- 10.2. Market Analysis, Insights and Forecast - by Type
- 10.2.1. Plasma-derived Coagulation Factor Concentrates
- 10.2.2. Recombinant Coagulation Factor Concentrates
- 10.2.3. Desmopressin
- 10.2.4. Antifibrinolytics
- 10.2.5. Fibrin Sealants
- 10.2.6. Others
- 10.1. Market Analysis, Insights and Forecast - by Application
- 11. Asia Pacific Bleeding Disorders Analysis, Insights and Forecast, 2020-2032
- 11.1. Market Analysis, Insights and Forecast - by Application
- 11.1.1. Hemophilia A
- 11.1.2. Hemophilia B
- 11.1.3. Others
- 11.2. Market Analysis, Insights and Forecast - by Type
- 11.2.1. Plasma-derived Coagulation Factor Concentrates
- 11.2.2. Recombinant Coagulation Factor Concentrates
- 11.2.3. Desmopressin
- 11.2.4. Antifibrinolytics
- 11.2.5. Fibrin Sealants
- 11.2.6. Others
- 11.1. Market Analysis, Insights and Forecast - by Application
- 12. Competitive Analysis
- 12.1. Company Profiles
- 12.1.1 Novo Nordisk
- 12.1.1.1. Company Overview
- 12.1.1.2. Products
- 12.1.1.3. Company Financials
- 12.1.1.4. SWOT Analysis
- 12.1.2 Bayer
- 12.1.2.1. Company Overview
- 12.1.2.2. Products
- 12.1.2.3. Company Financials
- 12.1.2.4. SWOT Analysis
- 12.1.3 Baxter International
- 12.1.3.1. Company Overview
- 12.1.3.2. Products
- 12.1.3.3. Company Financials
- 12.1.3.4. SWOT Analysis
- 12.1.4 Alnylam Pharmaceuticals
- 12.1.4.1. Company Overview
- 12.1.4.2. Products
- 12.1.4.3. Company Financials
- 12.1.4.4. SWOT Analysis
- 12.1.5 Pfizer
- 12.1.5.1. Company Overview
- 12.1.5.2. Products
- 12.1.5.3. Company Financials
- 12.1.5.4. SWOT Analysis
- 12.1.6 Xenetic Biosciences
- 12.1.6.1. Company Overview
- 12.1.6.2. Products
- 12.1.6.3. Company Financials
- 12.1.6.4. SWOT Analysis
- 12.1.7 Bristol-Myers Squibb Company
- 12.1.7.1. Company Overview
- 12.1.7.2. Products
- 12.1.7.3. Company Financials
- 12.1.7.4. SWOT Analysis
- 12.1.8 Sanofi
- 12.1.8.1. Company Overview
- 12.1.8.2. Products
- 12.1.8.3. Company Financials
- 12.1.8.4. SWOT Analysis
- 12.1.9 Janssen Global Services
- 12.1.9.1. Company Overview
- 12.1.9.2. Products
- 12.1.9.3. Company Financials
- 12.1.9.4. SWOT Analysis
- 12.1.10 Bioverativ
- 12.1.10.1. Company Overview
- 12.1.10.2. Products
- 12.1.10.3. Company Financials
- 12.1.10.4. SWOT Analysis
- 12.1.11 Amgen
- 12.1.11.1. Company Overview
- 12.1.11.2. Products
- 12.1.11.3. Company Financials
- 12.1.11.4. SWOT Analysis
- 12.1.1 Novo Nordisk
- 12.2. Market Entropy
- 12.2.1 Company's Key Areas Served
- 12.2.2 Recent Developments
- 12.3. Company Market Share Analysis 2025
- 12.3.1 Top 5 Companies Market Share Analysis
- 12.3.2 Top 3 Companies Market Share Analysis
- 12.4. List of Potential Customers
- 13. Research Methodology
List of Figures
- Figure 1: Global Bleeding Disorders Revenue Breakdown (million, %) by Region 2025 & 2033
- Figure 2: North America Bleeding Disorders Revenue (million), by Application 2025 & 2033
- Figure 3: North America Bleeding Disorders Revenue Share (%), by Application 2025 & 2033
- Figure 4: North America Bleeding Disorders Revenue (million), by Type 2025 & 2033
- Figure 5: North America Bleeding Disorders Revenue Share (%), by Type 2025 & 2033
- Figure 6: North America Bleeding Disorders Revenue (million), by Country 2025 & 2033
- Figure 7: North America Bleeding Disorders Revenue Share (%), by Country 2025 & 2033
- Figure 8: South America Bleeding Disorders Revenue (million), by Application 2025 & 2033
- Figure 9: South America Bleeding Disorders Revenue Share (%), by Application 2025 & 2033
- Figure 10: South America Bleeding Disorders Revenue (million), by Type 2025 & 2033
- Figure 11: South America Bleeding Disorders Revenue Share (%), by Type 2025 & 2033
- Figure 12: South America Bleeding Disorders Revenue (million), by Country 2025 & 2033
- Figure 13: South America Bleeding Disorders Revenue Share (%), by Country 2025 & 2033
- Figure 14: Europe Bleeding Disorders Revenue (million), by Application 2025 & 2033
- Figure 15: Europe Bleeding Disorders Revenue Share (%), by Application 2025 & 2033
- Figure 16: Europe Bleeding Disorders Revenue (million), by Type 2025 & 2033
- Figure 17: Europe Bleeding Disorders Revenue Share (%), by Type 2025 & 2033
- Figure 18: Europe Bleeding Disorders Revenue (million), by Country 2025 & 2033
- Figure 19: Europe Bleeding Disorders Revenue Share (%), by Country 2025 & 2033
- Figure 20: Middle East & Africa Bleeding Disorders Revenue (million), by Application 2025 & 2033
- Figure 21: Middle East & Africa Bleeding Disorders Revenue Share (%), by Application 2025 & 2033
- Figure 22: Middle East & Africa Bleeding Disorders Revenue (million), by Type 2025 & 2033
- Figure 23: Middle East & Africa Bleeding Disorders Revenue Share (%), by Type 2025 & 2033
- Figure 24: Middle East & Africa Bleeding Disorders Revenue (million), by Country 2025 & 2033
- Figure 25: Middle East & Africa Bleeding Disorders Revenue Share (%), by Country 2025 & 2033
- Figure 26: Asia Pacific Bleeding Disorders Revenue (million), by Application 2025 & 2033
- Figure 27: Asia Pacific Bleeding Disorders Revenue Share (%), by Application 2025 & 2033
- Figure 28: Asia Pacific Bleeding Disorders Revenue (million), by Type 2025 & 2033
- Figure 29: Asia Pacific Bleeding Disorders Revenue Share (%), by Type 2025 & 2033
- Figure 30: Asia Pacific Bleeding Disorders Revenue (million), by Country 2025 & 2033
- Figure 31: Asia Pacific Bleeding Disorders Revenue Share (%), by Country 2025 & 2033
List of Tables
- Table 1: Global Bleeding Disorders Revenue million Forecast, by Application 2020 & 2033
- Table 2: Global Bleeding Disorders Revenue million Forecast, by Type 2020 & 2033
- Table 3: Global Bleeding Disorders Revenue million Forecast, by Region 2020 & 2033
- Table 4: Global Bleeding Disorders Revenue million Forecast, by Application 2020 & 2033
- Table 5: Global Bleeding Disorders Revenue million Forecast, by Type 2020 & 2033
- Table 6: Global Bleeding Disorders Revenue million Forecast, by Country 2020 & 2033
- Table 7: United States Bleeding Disorders Revenue (million) Forecast, by Application 2020 & 2033
- Table 8: Canada Bleeding Disorders Revenue (million) Forecast, by Application 2020 & 2033
- Table 9: Mexico Bleeding Disorders Revenue (million) Forecast, by Application 2020 & 2033
- Table 10: Global Bleeding Disorders Revenue million Forecast, by Application 2020 & 2033
- Table 11: Global Bleeding Disorders Revenue million Forecast, by Type 2020 & 2033
- Table 12: Global Bleeding Disorders Revenue million Forecast, by Country 2020 & 2033
- Table 13: Brazil Bleeding Disorders Revenue (million) Forecast, by Application 2020 & 2033
- Table 14: Argentina Bleeding Disorders Revenue (million) Forecast, by Application 2020 & 2033
- Table 15: Rest of South America Bleeding Disorders Revenue (million) Forecast, by Application 2020 & 2033
- Table 16: Global Bleeding Disorders Revenue million Forecast, by Application 2020 & 2033
- Table 17: Global Bleeding Disorders Revenue million Forecast, by Type 2020 & 2033
- Table 18: Global Bleeding Disorders Revenue million Forecast, by Country 2020 & 2033
- Table 19: United Kingdom Bleeding Disorders Revenue (million) Forecast, by Application 2020 & 2033
- Table 20: Germany Bleeding Disorders Revenue (million) Forecast, by Application 2020 & 2033
- Table 21: France Bleeding Disorders Revenue (million) Forecast, by Application 2020 & 2033
- Table 22: Italy Bleeding Disorders Revenue (million) Forecast, by Application 2020 & 2033
- Table 23: Spain Bleeding Disorders Revenue (million) Forecast, by Application 2020 & 2033
- Table 24: Russia Bleeding Disorders Revenue (million) Forecast, by Application 2020 & 2033
- Table 25: Benelux Bleeding Disorders Revenue (million) Forecast, by Application 2020 & 2033
- Table 26: Nordics Bleeding Disorders Revenue (million) Forecast, by Application 2020 & 2033
- Table 27: Rest of Europe Bleeding Disorders Revenue (million) Forecast, by Application 2020 & 2033
- Table 28: Global Bleeding Disorders Revenue million Forecast, by Application 2020 & 2033
- Table 29: Global Bleeding Disorders Revenue million Forecast, by Type 2020 & 2033
- Table 30: Global Bleeding Disorders Revenue million Forecast, by Country 2020 & 2033
- Table 31: Turkey Bleeding Disorders Revenue (million) Forecast, by Application 2020 & 2033
- Table 32: Israel Bleeding Disorders Revenue (million) Forecast, by Application 2020 & 2033
- Table 33: GCC Bleeding Disorders Revenue (million) Forecast, by Application 2020 & 2033
- Table 34: North Africa Bleeding Disorders Revenue (million) Forecast, by Application 2020 & 2033
- Table 35: South Africa Bleeding Disorders Revenue (million) Forecast, by Application 2020 & 2033
- Table 36: Rest of Middle East & Africa Bleeding Disorders Revenue (million) Forecast, by Application 2020 & 2033
- Table 37: Global Bleeding Disorders Revenue million Forecast, by Application 2020 & 2033
- Table 38: Global Bleeding Disorders Revenue million Forecast, by Type 2020 & 2033
- Table 39: Global Bleeding Disorders Revenue million Forecast, by Country 2020 & 2033
- Table 40: China Bleeding Disorders Revenue (million) Forecast, by Application 2020 & 2033
- Table 41: India Bleeding Disorders Revenue (million) Forecast, by Application 2020 & 2033
- Table 42: Japan Bleeding Disorders Revenue (million) Forecast, by Application 2020 & 2033
- Table 43: South Korea Bleeding Disorders Revenue (million) Forecast, by Application 2020 & 2033
- Table 44: ASEAN Bleeding Disorders Revenue (million) Forecast, by Application 2020 & 2033
- Table 45: Oceania Bleeding Disorders Revenue (million) Forecast, by Application 2020 & 2033
- Table 46: Rest of Asia Pacific Bleeding Disorders Revenue (million) Forecast, by Application 2020 & 2033
Frequently Asked Questions
1. What is the projected Compound Annual Growth Rate (CAGR) of the Bleeding Disorders?
The projected CAGR is approximately 8.1%.
2. Which companies are prominent players in the Bleeding Disorders?
Key companies in the market include Novo Nordisk, Bayer, Baxter International, Alnylam Pharmaceuticals, Pfizer, Xenetic Biosciences, Bristol-Myers Squibb Company, Sanofi, Janssen Global Services, Bioverativ, Amgen.
3. What are the main segments of the Bleeding Disorders?
The market segments include Application, Type.
4. Can you provide details about the market size?
The market size is estimated to be USD 109.8 million as of 2022.
5. What are some drivers contributing to market growth?
N/A
6. What are the notable trends driving market growth?
N/A
7. Are there any restraints impacting market growth?
N/A
8. Can you provide examples of recent developments in the market?
N/A
9. What pricing options are available for accessing the report?
Pricing options include single-user, multi-user, and enterprise licenses priced at USD 2900.00, USD 4350.00, and USD 5800.00 respectively.
10. Is the market size provided in terms of value or volume?
The market size is provided in terms of value, measured in million.
11. Are there any specific market keywords associated with the report?
Yes, the market keyword associated with the report is "Bleeding Disorders," which aids in identifying and referencing the specific market segment covered.
12. How do I determine which pricing option suits my needs best?
The pricing options vary based on user requirements and access needs. Individual users may opt for single-user licenses, while businesses requiring broader access may choose multi-user or enterprise licenses for cost-effective access to the report.
13. Are there any additional resources or data provided in the Bleeding Disorders report?
While the report offers comprehensive insights, it's advisable to review the specific contents or supplementary materials provided to ascertain if additional resources or data are available.
14. How can I stay updated on further developments or reports in the Bleeding Disorders?
To stay informed about further developments, trends, and reports in the Bleeding Disorders, consider subscribing to industry newsletters, following relevant companies and organizations, or regularly checking reputable industry news sources and publications.
Methodology
Step 1 - Identification of Relevant Samples Size from Population Database



Step 2 - Approaches for Defining Global Market Size (Value, Volume* & Price*)

Note*: In applicable scenarios
Step 3 - Data Sources
Primary Research
- Web Analytics
- Survey Reports
- Research Institute
- Latest Research Reports
- Opinion Leaders
Secondary Research
- Annual Reports
- White Paper
- Latest Press Release
- Industry Association
- Paid Database
- Investor Presentations

Step 4 - Data Triangulation
Involves using different sources of information in order to increase the validity of a study
These sources are likely to be stakeholders in a program - participants, other researchers, program staff, other community members, and so on.
Then we put all data in single framework & apply various statistical tools to find out the dynamic on the market.
During the analysis stage, feedback from the stakeholder groups would be compared to determine areas of agreement as well as areas of divergence