

Key Insights
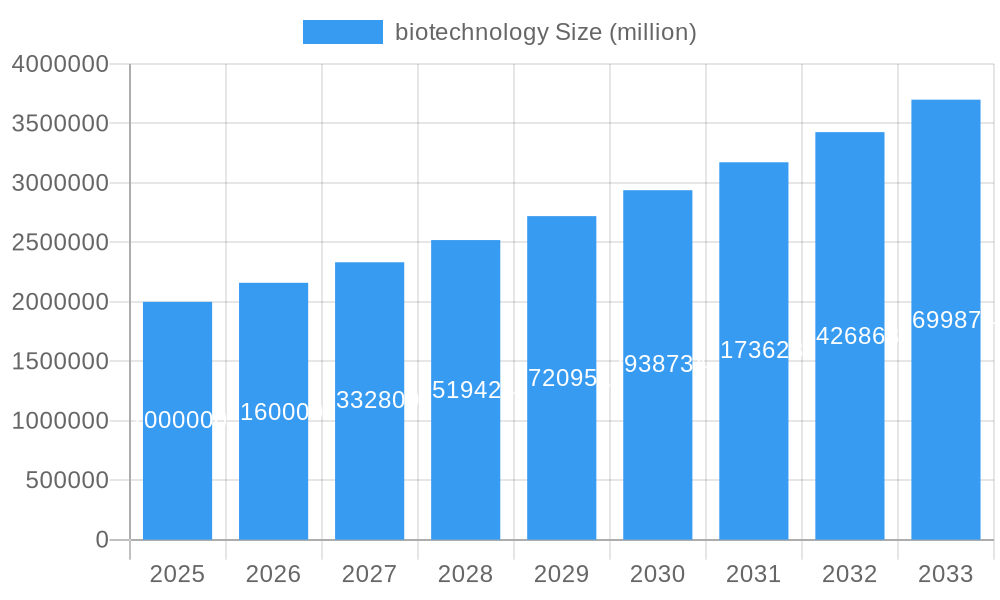
The biotechnology market is experiencing robust growth, driven by escalating demand for innovative therapies, an aging global population with increased prevalence of chronic diseases, and significant investments in research and development. The market's compound annual growth rate (CAGR) is estimated to be around 8% between 2025 and 2033, projecting substantial market expansion from an estimated $2 trillion in 2025 to over $3.5 trillion by 2033. This growth is fueled by breakthroughs in areas such as gene therapy, immunotherapy, and personalized medicine. Major pharmaceutical companies like Johnson & Johnson, Roche, Pfizer, and Merck, alongside emerging biotech firms, are actively contributing to this expansion through aggressive R&D pipelines and strategic collaborations. Significant advancements in genomics and proteomics are leading to the development of more targeted and effective treatments, further bolstering market expansion. However, the industry also faces challenges including stringent regulatory approvals, high research and development costs, and the complexities of bringing innovative therapies to market.
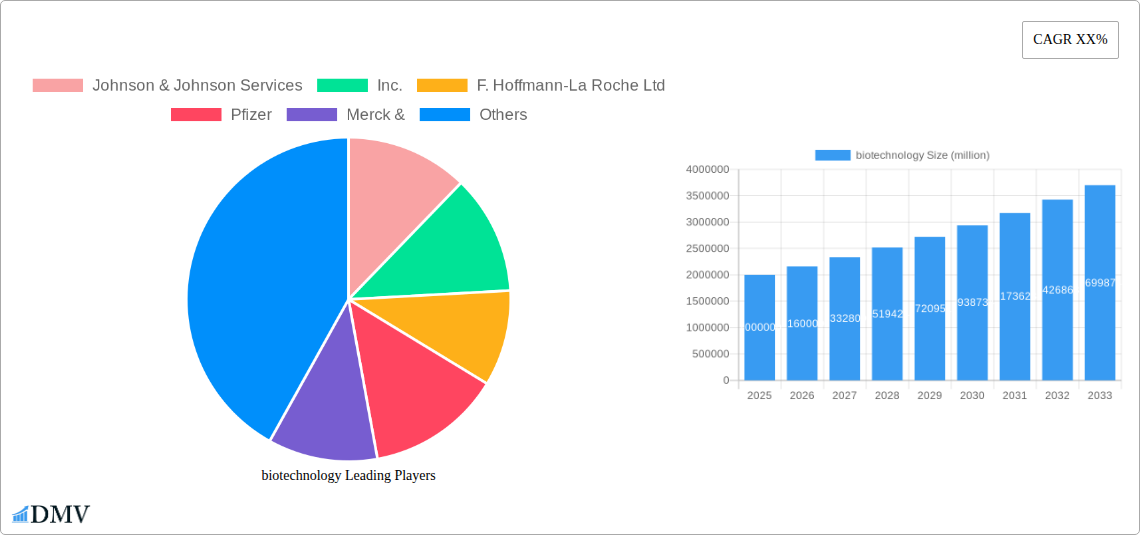
biotechnology Market Size (In Million)
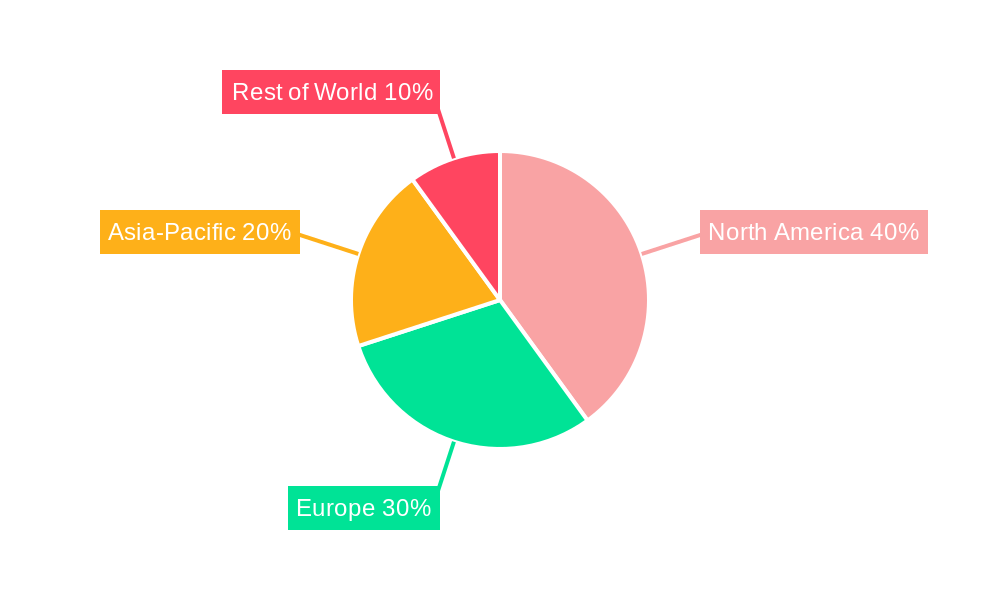
Despite these challenges, the long-term outlook remains positive. The increasing prevalence of chronic diseases like cancer, diabetes, and autoimmune disorders, combined with the growing awareness and acceptance of advanced therapies, will drive sustained demand for biotechnological products and services. Furthermore, government initiatives focused on fostering innovation in the life sciences sector, such as increased research funding and supportive regulatory frameworks, are expected to further accelerate market growth. The segmentation of the market into various therapeutic areas presents opportunities for specialized players to emerge and compete effectively. Regional variations exist, with North America and Europe currently holding the largest market shares, though other regions, particularly Asia-Pacific, are expected to demonstrate rapid growth in the coming years due to rising healthcare spending and expanding populations.
biotechnology Company Market Share
Unlocking the $XX Million Biotechnology Market: A Comprehensive Report (2019-2033)
This comprehensive report provides a detailed analysis of the global biotechnology market, projecting a value of $XX million by 2033. It offers crucial insights into market dynamics, technological advancements, and future growth potential, equipping stakeholders with the knowledge needed to navigate this rapidly evolving landscape. The study covers the historical period (2019-2024), the base year (2025), and forecasts up to 2033, offering a complete picture of market trends and their long-term implications. Key players analyzed include Johnson & Johnson Services, Inc., F. Hoffmann-La Roche Ltd, Pfizer, Merck, Sanofi, AstraZeneca, Gilead, CELGENE CORPORATION, Biogen, Amgen, Inc., Abbott, Novo Nordisk A/S, Novartis AG, and Lonza.
Biotechnology Market Composition & Trends
The global biotechnology market exhibits a moderately concentrated structure, with a few key players commanding significant market share. In 2025, the top five companies are estimated to hold approximately xx% of the market, reflecting the high capital investment and specialized expertise required in this sector. Innovation is a key driver, with significant investments in R&D leading to the development of novel therapies and diagnostic tools. The regulatory landscape plays a crucial role, impacting product approvals and market entry strategies. Substitute products and competitive pressures are also influencing market dynamics. Significant M&A activity has shaped the industry landscape, with deal values exceeding $XX million in recent years.
- Market Share Distribution (2025): Top 5 players - xx%; Next 10 players - xx%; Others - xx%.
- M&A Activity (2019-2024): Total deal value exceeding $XX million; average deal size of $XX million.
- Key Innovation Catalysts: Advanced gene editing technologies (CRISPR), personalized medicine, AI-driven drug discovery.
- Regulatory Landscape: Stringent approval processes impacting timelines and costs.
- End-User Profile: Hospitals, clinics, research institutions, pharmaceutical companies.
Biotechnology Industry Evolution
The biotechnology industry has witnessed exponential growth over the past decade, driven by breakthroughs in genetic engineering, proteomics, and bioinformatics. Between 2019 and 2024, the market experienced a Compound Annual Growth Rate (CAGR) of xx%, primarily fueled by the increasing prevalence of chronic diseases and rising demand for effective therapies. Technological advancements such as next-generation sequencing and high-throughput screening have significantly accelerated drug discovery and development. A shift towards personalized medicine, focusing on tailoring treatments to individual patient needs, is transforming the industry. Consumer demand for innovative, effective, and safe therapies is steadily increasing, driving market expansion.
Leading Regions, Countries, or Segments in Biotechnology
North America currently dominates the global biotechnology market, accounting for approximately xx% of the total revenue in 2025. This dominance is driven by several factors:
- High R&D Investment: Significant government and private funding for biotechnology research and development.
- Favorable Regulatory Environment: Relatively streamlined approval processes compared to other regions.
- Strong Presence of Biotech Companies: A large cluster of established and emerging biotech firms.
- Advanced Healthcare Infrastructure: Well-developed healthcare systems supporting the adoption of new technologies.
Europe and Asia-Pacific are also significant markets, experiencing substantial growth, though at a slightly lower pace compared to North America. The therapeutic area of oncology drives the largest segment, followed by immunology and infectious diseases.
Biotechnology Product Innovations
Recent years have seen remarkable product innovations within the biotechnology sector, including novel antibody-drug conjugates exhibiting enhanced efficacy and reduced toxicity, personalized cancer therapies utilizing advanced genomic profiling, and innovative gene therapies addressing previously incurable genetic disorders. These innovations represent significant advancements in patient care and market expansion, with unique selling propositions built around increased efficacy, improved safety profiles, and tailored treatment approaches.
Propelling Factors for Biotechnology Growth
Several factors are driving the growth of the biotechnology market:
- Technological Advancements: Continuous improvements in gene editing, diagnostics, and drug delivery mechanisms.
- Economic Factors: Increased healthcare spending and rising prevalence of chronic diseases.
- Favorable Regulatory Landscape (in certain regions): Supportive policies encouraging innovation and investment.
- Growing Awareness: Increased public awareness about biotechnology-based solutions for disease treatment.
Obstacles in the Biotechnology Market
The biotechnology market faces several challenges:
- High R&D Costs: Substantial investments required for drug development and commercialization, impacting profitability.
- Stringent Regulatory Approvals: Lengthy and complex regulatory processes causing delays in product launches.
- Supply Chain Disruptions: Potential disruptions in the sourcing of raw materials and manufacturing processes.
- Intense Competition: A highly competitive market with numerous players vying for market share.
Future Opportunities in Biotechnology
Future opportunities lie in several areas:
- Expansion into Emerging Markets: Untapped potential in developing countries with growing healthcare needs.
- Advancements in Gene Editing Technologies: Further development and application of CRISPR and other gene editing techniques.
- Artificial Intelligence (AI) in Drug Discovery: Leveraging AI to accelerate drug development and reduce costs.
- Personalized Medicine: Tailored therapies based on individual genetic profiles.
Major Players in the Biotechnology Ecosystem
Key Developments in Biotechnology Industry
- 2022: FDA approval of a novel gene therapy for a rare genetic disorder.
- 2023: Strategic partnership between two major biotechnology companies leading to accelerated drug development.
- 2024: Launch of a first-in-class immunotherapy demonstrating significant improvement in patient outcomes.
- 2025: Acquisition of a smaller biotech firm by a large pharmaceutical company expanding its portfolio.
Strategic Biotechnology Market Forecast
The biotechnology market is poised for continued robust growth driven by ongoing technological advancements, increasing healthcare spending, and a growing awareness of the potential of biotechnology-based treatments. The market is expected to witness significant expansion in emerging markets and continued innovation across various therapeutic areas, creating substantial opportunities for established players and new entrants alike. The forecast period of 2025-2033 presents a promising landscape for investment and growth in this transformative sector.
biotechnology Segmentation
-
1. Application
- 1.1. Health
- 1.2. Food & Agriculture
- 1.3. Natural Resources & Environment
- 1.4. Industrial Processing
- 1.5. Bioinformatics
- 1.6. Others
-
2. Types
- 2.1. DNA Sequencing
- 2.2. Nanobiotechnology
- 2.3. Tissue Engineering and Regeneration
- 2.4. Fermentation
- 2.5. Cell Based Assay
- 2.6. PCR Technology
- 2.7. Chromatography Market
- 2.8. Others
biotechnology Segmentation By Geography
-
1. North America
- 1.1. United States
- 1.2. Canada
- 1.3. Mexico
-
2. South America
- 2.1. Brazil
- 2.2. Argentina
- 2.3. Rest of South America
-
3. Europe
- 3.1. United Kingdom
- 3.2. Germany
- 3.3. France
- 3.4. Italy
- 3.5. Spain
- 3.6. Russia
- 3.7. Benelux
- 3.8. Nordics
- 3.9. Rest of Europe
-
4. Middle East & Africa
- 4.1. Turkey
- 4.2. Israel
- 4.3. GCC
- 4.4. North Africa
- 4.5. South Africa
- 4.6. Rest of Middle East & Africa
-
5. Asia Pacific
- 5.1. China
- 5.2. India
- 5.3. Japan
- 5.4. South Korea
- 5.5. ASEAN
- 5.6. Oceania
- 5.7. Rest of Asia Pacific
biotechnology Regional Market Share
Geographic Coverage of biotechnology
biotechnology REPORT HIGHLIGHTS
| Aspects | Details |
|---|---|
| Study Period | 2020-2034 |
| Base Year | 2025 |
| Estimated Year | 2026 |
| Forecast Period | 2026-2034 |
| Historical Period | 2020-2025 |
| Growth Rate | CAGR of XX% from 2020-2034 |
| Segmentation |
|
Table of Contents
- 1. Introduction
- 1.1. Research Scope
- 1.2. Market Segmentation
- 1.3. Research Objective
- 1.4. Definitions and Assumptions
- 2. Executive Summary
- 2.1. Market Snapshot
- 3. Market Dynamics
- 3.1. Market Drivers
- 3.2. Market Restrains
- 3.3. Market Trends
- 3.4. Market Opportunities
- 4. Market Factor Analysis
- 4.1. Porters Five Forces
- 4.1.1. Bargaining Power of Suppliers
- 4.1.2. Bargaining Power of Buyers
- 4.1.3. Threat of New Entrants
- 4.1.4. Threat of Substitutes
- 4.1.5. Competitive Rivalry
- 4.2. PESTEL analysis
- 4.3. BCG Analysis
- 4.3.1. Stars (High Growth, High Market Share)
- 4.3.2. Cash Cows (Low Growth, High Market Share)
- 4.3.3. Question Mark (High Growth, Low Market Share)
- 4.3.4. Dogs (Low Growth, Low Market Share)
- 4.4. Ansoff Matrix Analysis
- 4.5. Supply Chain Analysis
- 4.6. Regulatory Landscape
- 4.7. Current Market Potential and Opportunity Assessment (TAM–SAM–SOM Framework)
- 4.8. DMV Analyst Note
- 4.1. Porters Five Forces
- 5. Market Analysis, Insights and Forecast 2021-2033
- 5.1. Market Analysis, Insights and Forecast - by Application
- 5.1.1. Health
- 5.1.2. Food & Agriculture
- 5.1.3. Natural Resources & Environment
- 5.1.4. Industrial Processing
- 5.1.5. Bioinformatics
- 5.1.6. Others
- 5.2. Market Analysis, Insights and Forecast - by Types
- 5.2.1. DNA Sequencing
- 5.2.2. Nanobiotechnology
- 5.2.3. Tissue Engineering and Regeneration
- 5.2.4. Fermentation
- 5.2.5. Cell Based Assay
- 5.2.6. PCR Technology
- 5.2.7. Chromatography Market
- 5.2.8. Others
- 5.3. Market Analysis, Insights and Forecast - by Region
- 5.3.1. North America
- 5.3.2. South America
- 5.3.3. Europe
- 5.3.4. Middle East & Africa
- 5.3.5. Asia Pacific
- 5.1. Market Analysis, Insights and Forecast - by Application
- 6. Global biotechnology Analysis, Insights and Forecast, 2021-2033
- 6.1. Market Analysis, Insights and Forecast - by Application
- 6.1.1. Health
- 6.1.2. Food & Agriculture
- 6.1.3. Natural Resources & Environment
- 6.1.4. Industrial Processing
- 6.1.5. Bioinformatics
- 6.1.6. Others
- 6.2. Market Analysis, Insights and Forecast - by Types
- 6.2.1. DNA Sequencing
- 6.2.2. Nanobiotechnology
- 6.2.3. Tissue Engineering and Regeneration
- 6.2.4. Fermentation
- 6.2.5. Cell Based Assay
- 6.2.6. PCR Technology
- 6.2.7. Chromatography Market
- 6.2.8. Others
- 6.1. Market Analysis, Insights and Forecast - by Application
- 7. North America biotechnology Analysis, Insights and Forecast, 2020-2032
- 7.1. Market Analysis, Insights and Forecast - by Application
- 7.1.1. Health
- 7.1.2. Food & Agriculture
- 7.1.3. Natural Resources & Environment
- 7.1.4. Industrial Processing
- 7.1.5. Bioinformatics
- 7.1.6. Others
- 7.2. Market Analysis, Insights and Forecast - by Types
- 7.2.1. DNA Sequencing
- 7.2.2. Nanobiotechnology
- 7.2.3. Tissue Engineering and Regeneration
- 7.2.4. Fermentation
- 7.2.5. Cell Based Assay
- 7.2.6. PCR Technology
- 7.2.7. Chromatography Market
- 7.2.8. Others
- 7.1. Market Analysis, Insights and Forecast - by Application
- 8. South America biotechnology Analysis, Insights and Forecast, 2020-2032
- 8.1. Market Analysis, Insights and Forecast - by Application
- 8.1.1. Health
- 8.1.2. Food & Agriculture
- 8.1.3. Natural Resources & Environment
- 8.1.4. Industrial Processing
- 8.1.5. Bioinformatics
- 8.1.6. Others
- 8.2. Market Analysis, Insights and Forecast - by Types
- 8.2.1. DNA Sequencing
- 8.2.2. Nanobiotechnology
- 8.2.3. Tissue Engineering and Regeneration
- 8.2.4. Fermentation
- 8.2.5. Cell Based Assay
- 8.2.6. PCR Technology
- 8.2.7. Chromatography Market
- 8.2.8. Others
- 8.1. Market Analysis, Insights and Forecast - by Application
- 9. Europe biotechnology Analysis, Insights and Forecast, 2020-2032
- 9.1. Market Analysis, Insights and Forecast - by Application
- 9.1.1. Health
- 9.1.2. Food & Agriculture
- 9.1.3. Natural Resources & Environment
- 9.1.4. Industrial Processing
- 9.1.5. Bioinformatics
- 9.1.6. Others
- 9.2. Market Analysis, Insights and Forecast - by Types
- 9.2.1. DNA Sequencing
- 9.2.2. Nanobiotechnology
- 9.2.3. Tissue Engineering and Regeneration
- 9.2.4. Fermentation
- 9.2.5. Cell Based Assay
- 9.2.6. PCR Technology
- 9.2.7. Chromatography Market
- 9.2.8. Others
- 9.1. Market Analysis, Insights and Forecast - by Application
- 10. Middle East & Africa biotechnology Analysis, Insights and Forecast, 2020-2032
- 10.1. Market Analysis, Insights and Forecast - by Application
- 10.1.1. Health
- 10.1.2. Food & Agriculture
- 10.1.3. Natural Resources & Environment
- 10.1.4. Industrial Processing
- 10.1.5. Bioinformatics
- 10.1.6. Others
- 10.2. Market Analysis, Insights and Forecast - by Types
- 10.2.1. DNA Sequencing
- 10.2.2. Nanobiotechnology
- 10.2.3. Tissue Engineering and Regeneration
- 10.2.4. Fermentation
- 10.2.5. Cell Based Assay
- 10.2.6. PCR Technology
- 10.2.7. Chromatography Market
- 10.2.8. Others
- 10.1. Market Analysis, Insights and Forecast - by Application
- 11. Asia Pacific biotechnology Analysis, Insights and Forecast, 2020-2032
- 11.1. Market Analysis, Insights and Forecast - by Application
- 11.1.1. Health
- 11.1.2. Food & Agriculture
- 11.1.3. Natural Resources & Environment
- 11.1.4. Industrial Processing
- 11.1.5. Bioinformatics
- 11.1.6. Others
- 11.2. Market Analysis, Insights and Forecast - by Types
- 11.2.1. DNA Sequencing
- 11.2.2. Nanobiotechnology
- 11.2.3. Tissue Engineering and Regeneration
- 11.2.4. Fermentation
- 11.2.5. Cell Based Assay
- 11.2.6. PCR Technology
- 11.2.7. Chromatography Market
- 11.2.8. Others
- 11.1. Market Analysis, Insights and Forecast - by Application
- 12. Competitive Analysis
- 12.1. Company Profiles
- 12.1.1 Johnson & Johnson Services
- 12.1.1.1. Company Overview
- 12.1.1.2. Products
- 12.1.1.3. Company Financials
- 12.1.1.4. SWOT Analysis
- 12.1.2 Inc.
- 12.1.2.1. Company Overview
- 12.1.2.2. Products
- 12.1.2.3. Company Financials
- 12.1.2.4. SWOT Analysis
- 12.1.3 F. Hoffmann-La Roche Ltd
- 12.1.3.1. Company Overview
- 12.1.3.2. Products
- 12.1.3.3. Company Financials
- 12.1.3.4. SWOT Analysis
- 12.1.4 Pfizer
- 12.1.4.1. Company Overview
- 12.1.4.2. Products
- 12.1.4.3. Company Financials
- 12.1.4.4. SWOT Analysis
- 12.1.5 Merck &
- 12.1.5.1. Company Overview
- 12.1.5.2. Products
- 12.1.5.3. Company Financials
- 12.1.5.4. SWOT Analysis
- 12.1.6 Sanofi
- 12.1.6.1. Company Overview
- 12.1.6.2. Products
- 12.1.6.3. Company Financials
- 12.1.6.4. SWOT Analysis
- 12.1.7 AstraZeneca
- 12.1.7.1. Company Overview
- 12.1.7.2. Products
- 12.1.7.3. Company Financials
- 12.1.7.4. SWOT Analysis
- 12.1.8 Gilead
- 12.1.8.1. Company Overview
- 12.1.8.2. Products
- 12.1.8.3. Company Financials
- 12.1.8.4. SWOT Analysis
- 12.1.9 CELGENE CORPORATION
- 12.1.9.1. Company Overview
- 12.1.9.2. Products
- 12.1.9.3. Company Financials
- 12.1.9.4. SWOT Analysis
- 12.1.10 Biogen
- 12.1.10.1. Company Overview
- 12.1.10.2. Products
- 12.1.10.3. Company Financials
- 12.1.10.4. SWOT Analysis
- 12.1.11 Amgen
- 12.1.11.1. Company Overview
- 12.1.11.2. Products
- 12.1.11.3. Company Financials
- 12.1.11.4. SWOT Analysis
- 12.1.12 Inc
- 12.1.12.1. Company Overview
- 12.1.12.2. Products
- 12.1.12.3. Company Financials
- 12.1.12.4. SWOT Analysis
- 12.1.13 Abbott
- 12.1.13.1. Company Overview
- 12.1.13.2. Products
- 12.1.13.3. Company Financials
- 12.1.13.4. SWOT Analysis
- 12.1.14 Novo Nordisk A/S
- 12.1.14.1. Company Overview
- 12.1.14.2. Products
- 12.1.14.3. Company Financials
- 12.1.14.4. SWOT Analysis
- 12.1.15 Novartis AG
- 12.1.15.1. Company Overview
- 12.1.15.2. Products
- 12.1.15.3. Company Financials
- 12.1.15.4. SWOT Analysis
- 12.1.16 Lonza
- 12.1.16.1. Company Overview
- 12.1.16.2. Products
- 12.1.16.3. Company Financials
- 12.1.16.4. SWOT Analysis
- 12.1.1 Johnson & Johnson Services
- 12.2. Market Entropy
- 12.2.1 Company's Key Areas Served
- 12.2.2 Recent Developments
- 12.3. Company Market Share Analysis 2025
- 12.3.1 Top 5 Companies Market Share Analysis
- 12.3.2 Top 3 Companies Market Share Analysis
- 12.4. List of Potential Customers
- 13. Research Methodology
List of Figures
- Figure 1: Global biotechnology Revenue Breakdown (million, %) by Region 2025 & 2033
- Figure 2: North America biotechnology Revenue (million), by Application 2025 & 2033
- Figure 3: North America biotechnology Revenue Share (%), by Application 2025 & 2033
- Figure 4: North America biotechnology Revenue (million), by Types 2025 & 2033
- Figure 5: North America biotechnology Revenue Share (%), by Types 2025 & 2033
- Figure 6: North America biotechnology Revenue (million), by Country 2025 & 2033
- Figure 7: North America biotechnology Revenue Share (%), by Country 2025 & 2033
- Figure 8: South America biotechnology Revenue (million), by Application 2025 & 2033
- Figure 9: South America biotechnology Revenue Share (%), by Application 2025 & 2033
- Figure 10: South America biotechnology Revenue (million), by Types 2025 & 2033
- Figure 11: South America biotechnology Revenue Share (%), by Types 2025 & 2033
- Figure 12: South America biotechnology Revenue (million), by Country 2025 & 2033
- Figure 13: South America biotechnology Revenue Share (%), by Country 2025 & 2033
- Figure 14: Europe biotechnology Revenue (million), by Application 2025 & 2033
- Figure 15: Europe biotechnology Revenue Share (%), by Application 2025 & 2033
- Figure 16: Europe biotechnology Revenue (million), by Types 2025 & 2033
- Figure 17: Europe biotechnology Revenue Share (%), by Types 2025 & 2033
- Figure 18: Europe biotechnology Revenue (million), by Country 2025 & 2033
- Figure 19: Europe biotechnology Revenue Share (%), by Country 2025 & 2033
- Figure 20: Middle East & Africa biotechnology Revenue (million), by Application 2025 & 2033
- Figure 21: Middle East & Africa biotechnology Revenue Share (%), by Application 2025 & 2033
- Figure 22: Middle East & Africa biotechnology Revenue (million), by Types 2025 & 2033
- Figure 23: Middle East & Africa biotechnology Revenue Share (%), by Types 2025 & 2033
- Figure 24: Middle East & Africa biotechnology Revenue (million), by Country 2025 & 2033
- Figure 25: Middle East & Africa biotechnology Revenue Share (%), by Country 2025 & 2033
- Figure 26: Asia Pacific biotechnology Revenue (million), by Application 2025 & 2033
- Figure 27: Asia Pacific biotechnology Revenue Share (%), by Application 2025 & 2033
- Figure 28: Asia Pacific biotechnology Revenue (million), by Types 2025 & 2033
- Figure 29: Asia Pacific biotechnology Revenue Share (%), by Types 2025 & 2033
- Figure 30: Asia Pacific biotechnology Revenue (million), by Country 2025 & 2033
- Figure 31: Asia Pacific biotechnology Revenue Share (%), by Country 2025 & 2033
List of Tables
- Table 1: Global biotechnology Revenue million Forecast, by Application 2020 & 2033
- Table 2: Global biotechnology Revenue million Forecast, by Types 2020 & 2033
- Table 3: Global biotechnology Revenue million Forecast, by Region 2020 & 2033
- Table 4: Global biotechnology Revenue million Forecast, by Application 2020 & 2033
- Table 5: Global biotechnology Revenue million Forecast, by Types 2020 & 2033
- Table 6: Global biotechnology Revenue million Forecast, by Country 2020 & 2033
- Table 7: United States biotechnology Revenue (million) Forecast, by Application 2020 & 2033
- Table 8: Canada biotechnology Revenue (million) Forecast, by Application 2020 & 2033
- Table 9: Mexico biotechnology Revenue (million) Forecast, by Application 2020 & 2033
- Table 10: Global biotechnology Revenue million Forecast, by Application 2020 & 2033
- Table 11: Global biotechnology Revenue million Forecast, by Types 2020 & 2033
- Table 12: Global biotechnology Revenue million Forecast, by Country 2020 & 2033
- Table 13: Brazil biotechnology Revenue (million) Forecast, by Application 2020 & 2033
- Table 14: Argentina biotechnology Revenue (million) Forecast, by Application 2020 & 2033
- Table 15: Rest of South America biotechnology Revenue (million) Forecast, by Application 2020 & 2033
- Table 16: Global biotechnology Revenue million Forecast, by Application 2020 & 2033
- Table 17: Global biotechnology Revenue million Forecast, by Types 2020 & 2033
- Table 18: Global biotechnology Revenue million Forecast, by Country 2020 & 2033
- Table 19: United Kingdom biotechnology Revenue (million) Forecast, by Application 2020 & 2033
- Table 20: Germany biotechnology Revenue (million) Forecast, by Application 2020 & 2033
- Table 21: France biotechnology Revenue (million) Forecast, by Application 2020 & 2033
- Table 22: Italy biotechnology Revenue (million) Forecast, by Application 2020 & 2033
- Table 23: Spain biotechnology Revenue (million) Forecast, by Application 2020 & 2033
- Table 24: Russia biotechnology Revenue (million) Forecast, by Application 2020 & 2033
- Table 25: Benelux biotechnology Revenue (million) Forecast, by Application 2020 & 2033
- Table 26: Nordics biotechnology Revenue (million) Forecast, by Application 2020 & 2033
- Table 27: Rest of Europe biotechnology Revenue (million) Forecast, by Application 2020 & 2033
- Table 28: Global biotechnology Revenue million Forecast, by Application 2020 & 2033
- Table 29: Global biotechnology Revenue million Forecast, by Types 2020 & 2033
- Table 30: Global biotechnology Revenue million Forecast, by Country 2020 & 2033
- Table 31: Turkey biotechnology Revenue (million) Forecast, by Application 2020 & 2033
- Table 32: Israel biotechnology Revenue (million) Forecast, by Application 2020 & 2033
- Table 33: GCC biotechnology Revenue (million) Forecast, by Application 2020 & 2033
- Table 34: North Africa biotechnology Revenue (million) Forecast, by Application 2020 & 2033
- Table 35: South Africa biotechnology Revenue (million) Forecast, by Application 2020 & 2033
- Table 36: Rest of Middle East & Africa biotechnology Revenue (million) Forecast, by Application 2020 & 2033
- Table 37: Global biotechnology Revenue million Forecast, by Application 2020 & 2033
- Table 38: Global biotechnology Revenue million Forecast, by Types 2020 & 2033
- Table 39: Global biotechnology Revenue million Forecast, by Country 2020 & 2033
- Table 40: China biotechnology Revenue (million) Forecast, by Application 2020 & 2033
- Table 41: India biotechnology Revenue (million) Forecast, by Application 2020 & 2033
- Table 42: Japan biotechnology Revenue (million) Forecast, by Application 2020 & 2033
- Table 43: South Korea biotechnology Revenue (million) Forecast, by Application 2020 & 2033
- Table 44: ASEAN biotechnology Revenue (million) Forecast, by Application 2020 & 2033
- Table 45: Oceania biotechnology Revenue (million) Forecast, by Application 2020 & 2033
- Table 46: Rest of Asia Pacific biotechnology Revenue (million) Forecast, by Application 2020 & 2033
Frequently Asked Questions
1. What is the projected Compound Annual Growth Rate (CAGR) of the biotechnology?
The projected CAGR is approximately XX%.
2. Which companies are prominent players in the biotechnology?
Key companies in the market include Johnson & Johnson Services, Inc., F. Hoffmann-La Roche Ltd, Pfizer, Merck &, Sanofi, AstraZeneca, Gilead, CELGENE CORPORATION, Biogen, Amgen, Inc, Abbott, Novo Nordisk A/S, Novartis AG, Lonza.
3. What are the main segments of the biotechnology?
The market segments include Application, Types.
4. Can you provide details about the market size?
The market size is estimated to be USD XXX million as of 2022.
5. What are some drivers contributing to market growth?
N/A
6. What are the notable trends driving market growth?
N/A
7. Are there any restraints impacting market growth?
N/A
8. Can you provide examples of recent developments in the market?
N/A
9. What pricing options are available for accessing the report?
Pricing options include single-user, multi-user, and enterprise licenses priced at USD 4350.00, USD 6525.00, and USD 8700.00 respectively.
10. Is the market size provided in terms of value or volume?
The market size is provided in terms of value, measured in million.
11. Are there any specific market keywords associated with the report?
Yes, the market keyword associated with the report is "biotechnology," which aids in identifying and referencing the specific market segment covered.
12. How do I determine which pricing option suits my needs best?
The pricing options vary based on user requirements and access needs. Individual users may opt for single-user licenses, while businesses requiring broader access may choose multi-user or enterprise licenses for cost-effective access to the report.
13. Are there any additional resources or data provided in the biotechnology report?
While the report offers comprehensive insights, it's advisable to review the specific contents or supplementary materials provided to ascertain if additional resources or data are available.
14. How can I stay updated on further developments or reports in the biotechnology?
To stay informed about further developments, trends, and reports in the biotechnology, consider subscribing to industry newsletters, following relevant companies and organizations, or regularly checking reputable industry news sources and publications.
Methodology
Step 1 - Identification of Relevant Samples Size from Population Database


Step 2 - Approaches for Defining Global Market Size (Value, Volume* & Price*)

Note*: In applicable scenarios
Step 3 - Data Sources
Primary Research
- Web Analytics
- Survey Reports
- Research Institute
- Latest Research Reports
- Opinion Leaders
Secondary Research
- Annual Reports
- White Paper
- Latest Press Release
- Industry Association
- Paid Database
- Investor Presentations

Step 4 - Data Triangulation
Involves using different sources of information in order to increase the validity of a study
These sources are likely to be stakeholders in a program - participants, other researchers, program staff, other community members, and so on.
Then we put all data in single framework & apply various statistical tools to find out the dynamic on the market.
During the analysis stage, feedback from the stakeholder groups would be compared to determine areas of agreement as well as areas of divergence