

Key Insights
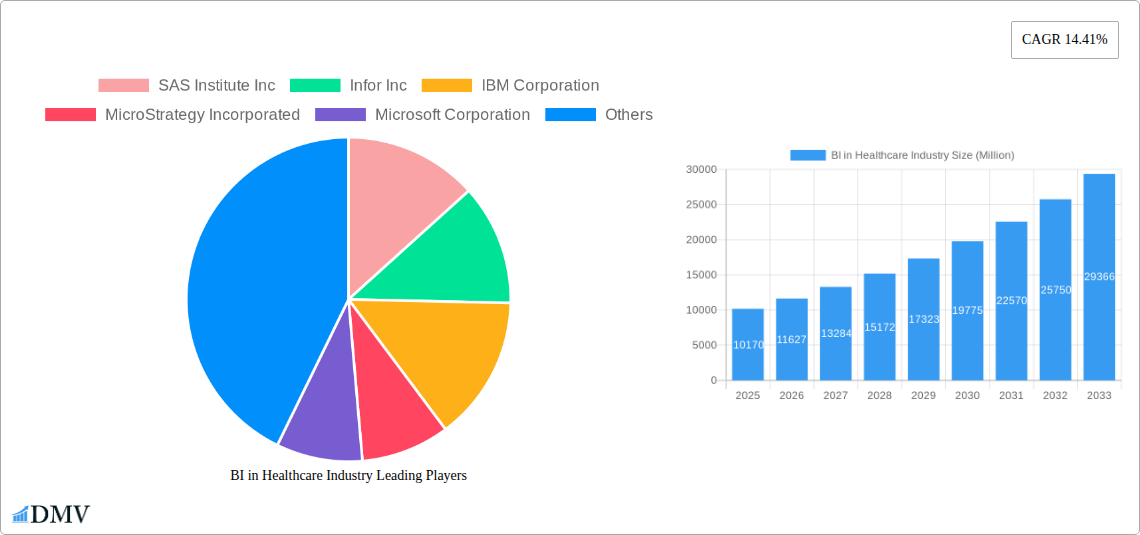
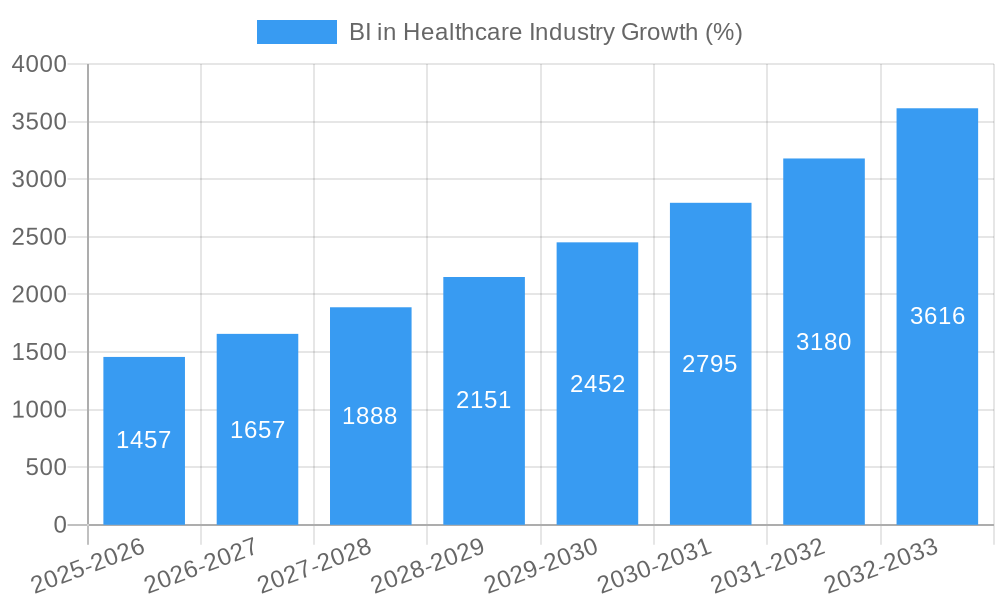
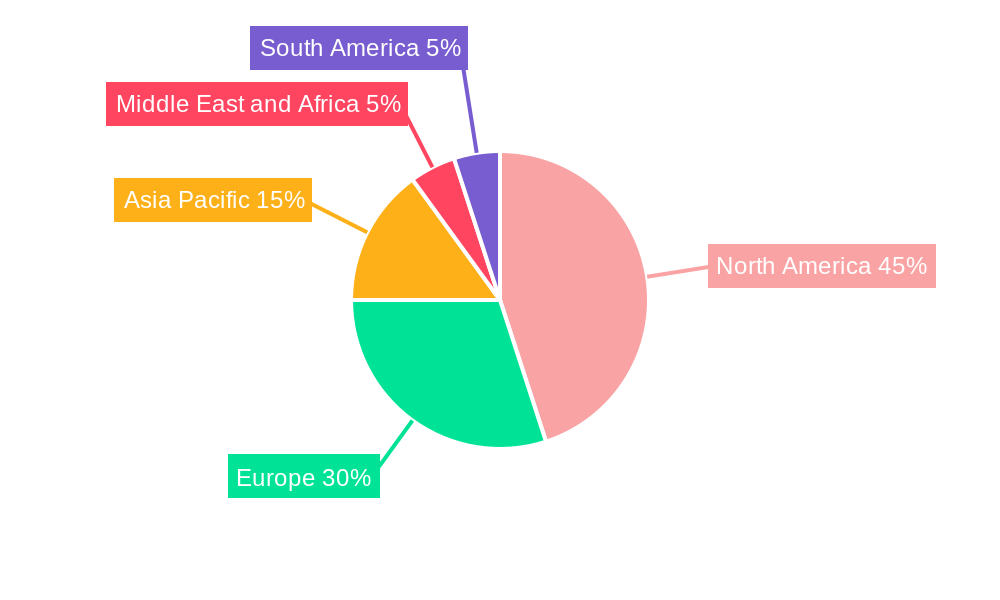
The Business Intelligence (BI) in Healthcare market is experiencing robust growth, projected to reach \$10.17 billion in 2025 and exhibiting a Compound Annual Growth Rate (CAGR) of 14.41% from 2025 to 2033. This expansion is fueled by several key drivers. The increasing need for data-driven decision-making within healthcare organizations, coupled with the rising adoption of electronic health records (EHRs) and the proliferation of wearable health technology, are generating massive datasets requiring sophisticated analysis. Furthermore, the emphasis on improving patient outcomes, reducing healthcare costs, and enhancing operational efficiency is driving the demand for BI solutions. Specific applications like financial analysis, clinical data analysis, and patient care analysis are witnessing significant growth, enabling better resource allocation, improved treatment strategies, and enhanced patient engagement. The market is segmented across various components (software and services), modes of delivery (on-premise, hybrid, and cloud-based), and end-users (payers, providers, and others). Cloud-based models are rapidly gaining traction due to their scalability, cost-effectiveness, and accessibility. North America currently holds a significant market share, but the Asia-Pacific region is expected to demonstrate substantial growth due to increasing healthcare investments and technological advancements.
The competitive landscape is characterized by a mix of established players like SAS Institute, IBM, and Microsoft, alongside specialized healthcare BI providers like CareCloud and Epic Systems. The ongoing development of advanced analytics capabilities, including artificial intelligence (AI) and machine learning (ML) integration, is further propelling market growth. However, challenges remain, including data security and privacy concerns, the complexity of integrating diverse data sources, and the need for skilled professionals to effectively utilize BI tools. Despite these challenges, the long-term outlook for the BI in Healthcare market remains positive, driven by persistent demand for improved healthcare efficiency and better patient care. The market's evolution is likely to involve further consolidation among providers, increased focus on interoperability, and the continuous integration of innovative technologies to extract meaningful insights from healthcare data.
BI in Healthcare Industry: A Comprehensive Market Report (2019-2033)
This insightful report provides a detailed analysis of the Business Intelligence (BI) in Healthcare Industry market, projecting a market value of $xx Million by 2033. It covers market composition, trends, leading players, technological advancements, and future opportunities, offering invaluable insights for stakeholders across the healthcare ecosystem. The study period spans from 2019 to 2033, with 2025 serving as both the base and estimated year. The forecast period is 2025-2033, and the historical period covers 2019-2024.
BI in Healthcare Industry Market Composition & Trends
The global BI in Healthcare Industry market exhibits a moderately concentrated landscape, with key players like SAS Institute Inc, Infor Inc, IBM Corporation, MicroStrategy Incorporated, and Microsoft Corporation holding significant market share. Innovation is driven by the increasing need for data-driven decision-making, advancements in AI and machine learning, and the growing adoption of cloud-based solutions. Stringent data privacy regulations (HIPAA, GDPR) shape the market, while substitute products like basic reporting tools pose competitive pressure. The market comprises diverse end-users, including payers, healthcare providers, and other entities. Significant M&A activity, such as Oracle's acquisition of Cerner in 2022 (valued at $xx Million), further reshapes the competitive dynamics.
- Market Share Distribution (2025): Top 5 players hold approximately 60% of the market.
- M&A Deal Value (2019-2024): Total value exceeded $xx Million.
- End-User Profile: Healthcare providers constitute the largest segment, driven by the need for efficient operational management and improved patient outcomes.
BI in Healthcare Industry Industry Evolution
The BI in Healthcare Industry market is experiencing robust growth, fueled by the exponential increase in healthcare data and the demand for actionable insights. From 2019 to 2024, the market grew at a CAGR of xx%, reaching $xx Million. The forecast period (2025-2033) projects a CAGR of xx%, driven by technological advancements such as AI-powered analytics, cloud computing, and the Internet of Medical Things (IoMT). The increasing adoption of value-based care models, coupled with a growing emphasis on population health management, further fuels market expansion. Consumer demands are shifting towards personalized medicine and improved patient experiences, necessitating the use of sophisticated BI tools for enhanced efficiency and decision-making. The increasing adoption of cloud-based BI solutions is a key trend, driven by its scalability, cost-effectiveness, and accessibility.
Leading Regions, Countries, or Segments in BI in Healthcare Industry
North America currently dominates the BI in Healthcare Industry market, owing to robust healthcare infrastructure, high technological adoption rates, and significant investments in healthcare IT. Within segments:
- By Component: Software dominates, accounting for approximately 70% of the market due to the increasing need for sophisticated analytics solutions.
- By Mode of Delivery: The Cloud-based model exhibits the highest growth rate, surpassing xx% CAGR from 2025 to 2033, driven by its inherent scalability, cost-efficiency, and enhanced accessibility.
- By Application: Clinical Data Analysis leads, reflecting the increasing emphasis on evidence-based medicine and personalized care.
- By End User: Healthcare Providers are the major consumers of BI solutions, owing to the need for optimizing operations and improving patient care.
Key Drivers:
- High investments in healthcare IT infrastructure.
- Government initiatives promoting the adoption of advanced technologies.
- Growing demand for improved operational efficiency and patient outcomes.
BI in Healthcare Industry Product Innovations
Recent innovations include the integration of AI and machine learning for predictive analytics, improved visualization tools for enhanced data interpretation, and the development of user-friendly interfaces for broader accessibility. These advancements enable healthcare providers to gain deeper insights into patient data, leading to more efficient operations, optimized resource allocation, and improved patient outcomes. Unique selling propositions include real-time data analysis capabilities, seamless integration with existing healthcare systems, and advanced security features ensuring data privacy and protection.
Propelling Factors for BI in Healthcare Industry Growth
Technological advancements in AI, machine learning, and big data analytics are fundamental drivers, along with increasing government initiatives promoting the use of health IT. Economic factors like the shift towards value-based care and rising healthcare costs incentivize the use of BI for cost optimization and improved efficiency. Regulatory frameworks, while stringent, also propel market growth by demanding better data management and reporting.
Obstacles in the BI in Healthcare Industry Market
Data security and privacy concerns remain a significant hurdle, requiring robust compliance with regulations like HIPAA. High implementation costs and the need for skilled professionals can hinder widespread adoption, particularly among smaller healthcare providers. Competitive pressure from established players and emerging startups also creates challenges for market participants. Supply chain disruptions can impact the availability of hardware and software components.
Future Opportunities in BI in Healthcare Industry
The integration of blockchain technology for enhanced data security and interoperability presents a promising opportunity. The expansion into emerging markets and the development of tailored solutions for specific healthcare sub-segments (e.g., telehealth, home healthcare) holds considerable potential. The growing adoption of wearable technology and remote patient monitoring generates a wealth of new data ripe for BI-driven analysis.
Major Players in the BI in Healthcare Industry Ecosystem
- SAS Institute Inc
- Infor Inc
- IBM Corporation
- MicroStrategy Incorporated
- Microsoft Corporation
- CareCloud Inc
- EPIC SYSTEMS
- QlikTech International AB
- Information Builders
- Oracle Corporation
- Salesforce
- Sisense Inc
- Domo Inc
- SAP SE
Key Developments in BI in Healthcare Industry Industry
- June 2022: Oracle Corporation's acquisition of Cerner Corporation significantly impacted market consolidation and expanded Oracle's healthcare IT portfolio.
- January 2022: PINC AI's launch of INsights provided a vendor-agnostic analytics platform, enhancing access to standardized healthcare data and boosting self-service analytics capabilities.
- January 2022: CareCloud Inc.'s launch of PrecisionBI Lite expanded the reach of BI solutions to smaller healthcare practices.
Strategic BI in Healthcare Industry Market Forecast
The BI in Healthcare Industry market is poised for sustained growth, driven by technological innovations, increased data volumes, and the ongoing shift towards value-based care. Emerging opportunities in AI-driven predictive analytics, personalized medicine, and remote patient monitoring will shape future market dynamics. The continued consolidation through M&A activities and the expansion into untapped markets will further propel market expansion, creating significant opportunities for both established players and new entrants.
BI in Healthcare Industry Segmentation
-
1. Component
- 1.1. Software
- 1.2. Services
-
2. Mode of Delivery
- 2.1. On-premise Model
- 2.2. Hybrid Model
- 2.3. Cloud-based Model
-
3. Application
- 3.1. Financial Analysis
- 3.2. Clinical Data Analysis
- 3.3. Patient Care Analysis
- 3.4. Other Applications
-
4. End User
- 4.1. Payers
- 4.2. Healthcare Providers
- 4.3. Other End Users
BI in Healthcare Industry Segmentation By Geography
-
1. North America
- 1.1. United States
- 1.2. Canada
- 1.3. Mexico
-
2. Europe
- 2.1. Germany
- 2.2. United Kingdom
- 2.3. France
- 2.4. Italy
- 2.5. Spain
- 2.6. Rest of Europe
-
3. Asia Pacific
- 3.1. China
- 3.2. Japan
- 3.3. India
- 3.4. Australia
- 3.5. South Korea
- 3.6. Rest of Asia Pacific
-
4. Middle East and Africa
- 4.1. GCC
- 4.2. South Africa
- 4.3. Rest of Middle East and Africa
-
5. South America
- 5.1. Brazil
- 5.2. Argentina
- 5.3. Rest of South America
BI in Healthcare Industry REPORT HIGHLIGHTS
| Aspects | Details |
|---|---|
| Study Period | 2019-2033 |
| Base Year | 2024 |
| Estimated Year | 2025 |
| Forecast Period | 2025-2033 |
| Historical Period | 2019-2024 |
| Growth Rate | CAGR of 14.41% from 2019-2033 |
| Segmentation |
|
Table of Contents
- 1. Introduction
- 1.1. Research Scope
- 1.2. Market Segmentation
- 1.3. Research Methodology
- 1.4. Definitions and Assumptions
- 2. Executive Summary
- 2.1. Introduction
- 3. Market Dynamics
- 3.1. Introduction
- 3.2. Market Drivers
- 3.2.1 Growing Government Initiatives for Healthcare Digitalization
- 3.2.2 Like Adoption of EHR; Increasing Number of Patient Registries; The Emergence of Big Data in the Healthcare Industry
- 3.3. Market Restrains
- 3.3.1. High Cost of Implementation; Lack of Skilled Professionals
- 3.4. Market Trends
- 3.4.1. Cloud-based Model is Expected to Grow Significantly in the Healthcare BI Market Over the Forecast Period
- 4. Market Factor Analysis
- 4.1. Porters Five Forces
- 4.2. Supply/Value Chain
- 4.3. PESTEL analysis
- 4.4. Market Entropy
- 4.5. Patent/Trademark Analysis
- 5. Global BI in Healthcare Industry Analysis, Insights and Forecast, 2019-2031
- 5.1. Market Analysis, Insights and Forecast - by Component
- 5.1.1. Software
- 5.1.2. Services
- 5.2. Market Analysis, Insights and Forecast - by Mode of Delivery
- 5.2.1. On-premise Model
- 5.2.2. Hybrid Model
- 5.2.3. Cloud-based Model
- 5.3. Market Analysis, Insights and Forecast - by Application
- 5.3.1. Financial Analysis
- 5.3.2. Clinical Data Analysis
- 5.3.3. Patient Care Analysis
- 5.3.4. Other Applications
- 5.4. Market Analysis, Insights and Forecast - by End User
- 5.4.1. Payers
- 5.4.2. Healthcare Providers
- 5.4.3. Other End Users
- 5.5. Market Analysis, Insights and Forecast - by Region
- 5.5.1. North America
- 5.5.2. Europe
- 5.5.3. Asia Pacific
- 5.5.4. Middle East and Africa
- 5.5.5. South America
- 5.1. Market Analysis, Insights and Forecast - by Component
- 6. North America BI in Healthcare Industry Analysis, Insights and Forecast, 2019-2031
- 6.1. Market Analysis, Insights and Forecast - by Component
- 6.1.1. Software
- 6.1.2. Services
- 6.2. Market Analysis, Insights and Forecast - by Mode of Delivery
- 6.2.1. On-premise Model
- 6.2.2. Hybrid Model
- 6.2.3. Cloud-based Model
- 6.3. Market Analysis, Insights and Forecast - by Application
- 6.3.1. Financial Analysis
- 6.3.2. Clinical Data Analysis
- 6.3.3. Patient Care Analysis
- 6.3.4. Other Applications
- 6.4. Market Analysis, Insights and Forecast - by End User
- 6.4.1. Payers
- 6.4.2. Healthcare Providers
- 6.4.3. Other End Users
- 6.1. Market Analysis, Insights and Forecast - by Component
- 7. Europe BI in Healthcare Industry Analysis, Insights and Forecast, 2019-2031
- 7.1. Market Analysis, Insights and Forecast - by Component
- 7.1.1. Software
- 7.1.2. Services
- 7.2. Market Analysis, Insights and Forecast - by Mode of Delivery
- 7.2.1. On-premise Model
- 7.2.2. Hybrid Model
- 7.2.3. Cloud-based Model
- 7.3. Market Analysis, Insights and Forecast - by Application
- 7.3.1. Financial Analysis
- 7.3.2. Clinical Data Analysis
- 7.3.3. Patient Care Analysis
- 7.3.4. Other Applications
- 7.4. Market Analysis, Insights and Forecast - by End User
- 7.4.1. Payers
- 7.4.2. Healthcare Providers
- 7.4.3. Other End Users
- 7.1. Market Analysis, Insights and Forecast - by Component
- 8. Asia Pacific BI in Healthcare Industry Analysis, Insights and Forecast, 2019-2031
- 8.1. Market Analysis, Insights and Forecast - by Component
- 8.1.1. Software
- 8.1.2. Services
- 8.2. Market Analysis, Insights and Forecast - by Mode of Delivery
- 8.2.1. On-premise Model
- 8.2.2. Hybrid Model
- 8.2.3. Cloud-based Model
- 8.3. Market Analysis, Insights and Forecast - by Application
- 8.3.1. Financial Analysis
- 8.3.2. Clinical Data Analysis
- 8.3.3. Patient Care Analysis
- 8.3.4. Other Applications
- 8.4. Market Analysis, Insights and Forecast - by End User
- 8.4.1. Payers
- 8.4.2. Healthcare Providers
- 8.4.3. Other End Users
- 8.1. Market Analysis, Insights and Forecast - by Component
- 9. Middle East and Africa BI in Healthcare Industry Analysis, Insights and Forecast, 2019-2031
- 9.1. Market Analysis, Insights and Forecast - by Component
- 9.1.1. Software
- 9.1.2. Services
- 9.2. Market Analysis, Insights and Forecast - by Mode of Delivery
- 9.2.1. On-premise Model
- 9.2.2. Hybrid Model
- 9.2.3. Cloud-based Model
- 9.3. Market Analysis, Insights and Forecast - by Application
- 9.3.1. Financial Analysis
- 9.3.2. Clinical Data Analysis
- 9.3.3. Patient Care Analysis
- 9.3.4. Other Applications
- 9.4. Market Analysis, Insights and Forecast - by End User
- 9.4.1. Payers
- 9.4.2. Healthcare Providers
- 9.4.3. Other End Users
- 9.1. Market Analysis, Insights and Forecast - by Component
- 10. South America BI in Healthcare Industry Analysis, Insights and Forecast, 2019-2031
- 10.1. Market Analysis, Insights and Forecast - by Component
- 10.1.1. Software
- 10.1.2. Services
- 10.2. Market Analysis, Insights and Forecast - by Mode of Delivery
- 10.2.1. On-premise Model
- 10.2.2. Hybrid Model
- 10.2.3. Cloud-based Model
- 10.3. Market Analysis, Insights and Forecast - by Application
- 10.3.1. Financial Analysis
- 10.3.2. Clinical Data Analysis
- 10.3.3. Patient Care Analysis
- 10.3.4. Other Applications
- 10.4. Market Analysis, Insights and Forecast - by End User
- 10.4.1. Payers
- 10.4.2. Healthcare Providers
- 10.4.3. Other End Users
- 10.1. Market Analysis, Insights and Forecast - by Component
- 11. North America BI in Healthcare Industry Analysis, Insights and Forecast, 2019-2031
- 11.1. Market Analysis, Insights and Forecast - By Country/Sub-region
- 11.1.1 United States
- 11.1.2 Canada
- 11.1.3 Mexico
- 12. Europe BI in Healthcare Industry Analysis, Insights and Forecast, 2019-2031
- 12.1. Market Analysis, Insights and Forecast - By Country/Sub-region
- 12.1.1 Germany
- 12.1.2 United Kingdom
- 12.1.3 France
- 12.1.4 Italy
- 12.1.5 Spain
- 12.1.6 Rest of Europe
- 13. Asia Pacific BI in Healthcare Industry Analysis, Insights and Forecast, 2019-2031
- 13.1. Market Analysis, Insights and Forecast - By Country/Sub-region
- 13.1.1 China
- 13.1.2 Japan
- 13.1.3 India
- 13.1.4 Australia
- 13.1.5 South Korea
- 13.1.6 Rest of Asia Pacific
- 14. Middle East and Africa BI in Healthcare Industry Analysis, Insights and Forecast, 2019-2031
- 14.1. Market Analysis, Insights and Forecast - By Country/Sub-region
- 14.1.1 GCC
- 14.1.2 South Africa
- 14.1.3 Rest of Middle East and Africa
- 15. South America BI in Healthcare Industry Analysis, Insights and Forecast, 2019-2031
- 15.1. Market Analysis, Insights and Forecast - By Country/Sub-region
- 15.1.1 Brazil
- 15.1.2 Argentina
- 15.1.3 Rest of South America
- 16. Competitive Analysis
- 16.1. Global Market Share Analysis 2024
- 16.2. Company Profiles
- 16.2.1 SAS Institute Inc
- 16.2.1.1. Overview
- 16.2.1.2. Products
- 16.2.1.3. SWOT Analysis
- 16.2.1.4. Recent Developments
- 16.2.1.5. Financials (Based on Availability)
- 16.2.2 Infor Inc
- 16.2.2.1. Overview
- 16.2.2.2. Products
- 16.2.2.3. SWOT Analysis
- 16.2.2.4. Recent Developments
- 16.2.2.5. Financials (Based on Availability)
- 16.2.3 IBM Corporation
- 16.2.3.1. Overview
- 16.2.3.2. Products
- 16.2.3.3. SWOT Analysis
- 16.2.3.4. Recent Developments
- 16.2.3.5. Financials (Based on Availability)
- 16.2.4 MicroStrategy Incorporated
- 16.2.4.1. Overview
- 16.2.4.2. Products
- 16.2.4.3. SWOT Analysis
- 16.2.4.4. Recent Developments
- 16.2.4.5. Financials (Based on Availability)
- 16.2.5 Microsoft Corporation
- 16.2.5.1. Overview
- 16.2.5.2. Products
- 16.2.5.3. SWOT Analysis
- 16.2.5.4. Recent Developments
- 16.2.5.5. Financials (Based on Availability)
- 16.2.6 CareCloud Inc
- 16.2.6.1. Overview
- 16.2.6.2. Products
- 16.2.6.3. SWOT Analysis
- 16.2.6.4. Recent Developments
- 16.2.6.5. Financials (Based on Availability)
- 16.2.7 EPIC SYSTEMS
- 16.2.7.1. Overview
- 16.2.7.2. Products
- 16.2.7.3. SWOT Analysis
- 16.2.7.4. Recent Developments
- 16.2.7.5. Financials (Based on Availability)
- 16.2.8 QlikTech International AB
- 16.2.8.1. Overview
- 16.2.8.2. Products
- 16.2.8.3. SWOT Analysis
- 16.2.8.4. Recent Developments
- 16.2.8.5. Financials (Based on Availability)
- 16.2.9 Information Builders
- 16.2.9.1. Overview
- 16.2.9.2. Products
- 16.2.9.3. SWOT Analysis
- 16.2.9.4. Recent Developments
- 16.2.9.5. Financials (Based on Availability)
- 16.2.10 Oracle Corporation
- 16.2.10.1. Overview
- 16.2.10.2. Products
- 16.2.10.3. SWOT Analysis
- 16.2.10.4. Recent Developments
- 16.2.10.5. Financials (Based on Availability)
- 16.2.11 Salesforce
- 16.2.11.1. Overview
- 16.2.11.2. Products
- 16.2.11.3. SWOT Analysis
- 16.2.11.4. Recent Developments
- 16.2.11.5. Financials (Based on Availability)
- 16.2.12 Sisense Inc
- 16.2.12.1. Overview
- 16.2.12.2. Products
- 16.2.12.3. SWOT Analysis
- 16.2.12.4. Recent Developments
- 16.2.12.5. Financials (Based on Availability)
- 16.2.13 Domo Inc
- 16.2.13.1. Overview
- 16.2.13.2. Products
- 16.2.13.3. SWOT Analysis
- 16.2.13.4. Recent Developments
- 16.2.13.5. Financials (Based on Availability)
- 16.2.14 SAP SE
- 16.2.14.1. Overview
- 16.2.14.2. Products
- 16.2.14.3. SWOT Analysis
- 16.2.14.4. Recent Developments
- 16.2.14.5. Financials (Based on Availability)
- 16.2.1 SAS Institute Inc
List of Figures
- Figure 1: Global BI in Healthcare Industry Revenue Breakdown (Million, %) by Region 2024 & 2032
- Figure 2: Global BI in Healthcare Industry Volume Breakdown (K Unit, %) by Region 2024 & 2032
- Figure 3: North America BI in Healthcare Industry Revenue (Million), by Country 2024 & 2032
- Figure 4: North America BI in Healthcare Industry Volume (K Unit), by Country 2024 & 2032
- Figure 5: North America BI in Healthcare Industry Revenue Share (%), by Country 2024 & 2032
- Figure 6: North America BI in Healthcare Industry Volume Share (%), by Country 2024 & 2032
- Figure 7: Europe BI in Healthcare Industry Revenue (Million), by Country 2024 & 2032
- Figure 8: Europe BI in Healthcare Industry Volume (K Unit), by Country 2024 & 2032
- Figure 9: Europe BI in Healthcare Industry Revenue Share (%), by Country 2024 & 2032
- Figure 10: Europe BI in Healthcare Industry Volume Share (%), by Country 2024 & 2032
- Figure 11: Asia Pacific BI in Healthcare Industry Revenue (Million), by Country 2024 & 2032
- Figure 12: Asia Pacific BI in Healthcare Industry Volume (K Unit), by Country 2024 & 2032
- Figure 13: Asia Pacific BI in Healthcare Industry Revenue Share (%), by Country 2024 & 2032
- Figure 14: Asia Pacific BI in Healthcare Industry Volume Share (%), by Country 2024 & 2032
- Figure 15: Middle East and Africa BI in Healthcare Industry Revenue (Million), by Country 2024 & 2032
- Figure 16: Middle East and Africa BI in Healthcare Industry Volume (K Unit), by Country 2024 & 2032
- Figure 17: Middle East and Africa BI in Healthcare Industry Revenue Share (%), by Country 2024 & 2032
- Figure 18: Middle East and Africa BI in Healthcare Industry Volume Share (%), by Country 2024 & 2032
- Figure 19: South America BI in Healthcare Industry Revenue (Million), by Country 2024 & 2032
- Figure 20: South America BI in Healthcare Industry Volume (K Unit), by Country 2024 & 2032
- Figure 21: South America BI in Healthcare Industry Revenue Share (%), by Country 2024 & 2032
- Figure 22: South America BI in Healthcare Industry Volume Share (%), by Country 2024 & 2032
- Figure 23: North America BI in Healthcare Industry Revenue (Million), by Component 2024 & 2032
- Figure 24: North America BI in Healthcare Industry Volume (K Unit), by Component 2024 & 2032
- Figure 25: North America BI in Healthcare Industry Revenue Share (%), by Component 2024 & 2032
- Figure 26: North America BI in Healthcare Industry Volume Share (%), by Component 2024 & 2032
- Figure 27: North America BI in Healthcare Industry Revenue (Million), by Mode of Delivery 2024 & 2032
- Figure 28: North America BI in Healthcare Industry Volume (K Unit), by Mode of Delivery 2024 & 2032
- Figure 29: North America BI in Healthcare Industry Revenue Share (%), by Mode of Delivery 2024 & 2032
- Figure 30: North America BI in Healthcare Industry Volume Share (%), by Mode of Delivery 2024 & 2032
- Figure 31: North America BI in Healthcare Industry Revenue (Million), by Application 2024 & 2032
- Figure 32: North America BI in Healthcare Industry Volume (K Unit), by Application 2024 & 2032
- Figure 33: North America BI in Healthcare Industry Revenue Share (%), by Application 2024 & 2032
- Figure 34: North America BI in Healthcare Industry Volume Share (%), by Application 2024 & 2032
- Figure 35: North America BI in Healthcare Industry Revenue (Million), by End User 2024 & 2032
- Figure 36: North America BI in Healthcare Industry Volume (K Unit), by End User 2024 & 2032
- Figure 37: North America BI in Healthcare Industry Revenue Share (%), by End User 2024 & 2032
- Figure 38: North America BI in Healthcare Industry Volume Share (%), by End User 2024 & 2032
- Figure 39: North America BI in Healthcare Industry Revenue (Million), by Country 2024 & 2032
- Figure 40: North America BI in Healthcare Industry Volume (K Unit), by Country 2024 & 2032
- Figure 41: North America BI in Healthcare Industry Revenue Share (%), by Country 2024 & 2032
- Figure 42: North America BI in Healthcare Industry Volume Share (%), by Country 2024 & 2032
- Figure 43: Europe BI in Healthcare Industry Revenue (Million), by Component 2024 & 2032
- Figure 44: Europe BI in Healthcare Industry Volume (K Unit), by Component 2024 & 2032
- Figure 45: Europe BI in Healthcare Industry Revenue Share (%), by Component 2024 & 2032
- Figure 46: Europe BI in Healthcare Industry Volume Share (%), by Component 2024 & 2032
- Figure 47: Europe BI in Healthcare Industry Revenue (Million), by Mode of Delivery 2024 & 2032
- Figure 48: Europe BI in Healthcare Industry Volume (K Unit), by Mode of Delivery 2024 & 2032
- Figure 49: Europe BI in Healthcare Industry Revenue Share (%), by Mode of Delivery 2024 & 2032
- Figure 50: Europe BI in Healthcare Industry Volume Share (%), by Mode of Delivery 2024 & 2032
- Figure 51: Europe BI in Healthcare Industry Revenue (Million), by Application 2024 & 2032
- Figure 52: Europe BI in Healthcare Industry Volume (K Unit), by Application 2024 & 2032
- Figure 53: Europe BI in Healthcare Industry Revenue Share (%), by Application 2024 & 2032
- Figure 54: Europe BI in Healthcare Industry Volume Share (%), by Application 2024 & 2032
- Figure 55: Europe BI in Healthcare Industry Revenue (Million), by End User 2024 & 2032
- Figure 56: Europe BI in Healthcare Industry Volume (K Unit), by End User 2024 & 2032
- Figure 57: Europe BI in Healthcare Industry Revenue Share (%), by End User 2024 & 2032
- Figure 58: Europe BI in Healthcare Industry Volume Share (%), by End User 2024 & 2032
- Figure 59: Europe BI in Healthcare Industry Revenue (Million), by Country 2024 & 2032
- Figure 60: Europe BI in Healthcare Industry Volume (K Unit), by Country 2024 & 2032
- Figure 61: Europe BI in Healthcare Industry Revenue Share (%), by Country 2024 & 2032
- Figure 62: Europe BI in Healthcare Industry Volume Share (%), by Country 2024 & 2032
- Figure 63: Asia Pacific BI in Healthcare Industry Revenue (Million), by Component 2024 & 2032
- Figure 64: Asia Pacific BI in Healthcare Industry Volume (K Unit), by Component 2024 & 2032
- Figure 65: Asia Pacific BI in Healthcare Industry Revenue Share (%), by Component 2024 & 2032
- Figure 66: Asia Pacific BI in Healthcare Industry Volume Share (%), by Component 2024 & 2032
- Figure 67: Asia Pacific BI in Healthcare Industry Revenue (Million), by Mode of Delivery 2024 & 2032
- Figure 68: Asia Pacific BI in Healthcare Industry Volume (K Unit), by Mode of Delivery 2024 & 2032
- Figure 69: Asia Pacific BI in Healthcare Industry Revenue Share (%), by Mode of Delivery 2024 & 2032
- Figure 70: Asia Pacific BI in Healthcare Industry Volume Share (%), by Mode of Delivery 2024 & 2032
- Figure 71: Asia Pacific BI in Healthcare Industry Revenue (Million), by Application 2024 & 2032
- Figure 72: Asia Pacific BI in Healthcare Industry Volume (K Unit), by Application 2024 & 2032
- Figure 73: Asia Pacific BI in Healthcare Industry Revenue Share (%), by Application 2024 & 2032
- Figure 74: Asia Pacific BI in Healthcare Industry Volume Share (%), by Application 2024 & 2032
- Figure 75: Asia Pacific BI in Healthcare Industry Revenue (Million), by End User 2024 & 2032
- Figure 76: Asia Pacific BI in Healthcare Industry Volume (K Unit), by End User 2024 & 2032
- Figure 77: Asia Pacific BI in Healthcare Industry Revenue Share (%), by End User 2024 & 2032
- Figure 78: Asia Pacific BI in Healthcare Industry Volume Share (%), by End User 2024 & 2032
- Figure 79: Asia Pacific BI in Healthcare Industry Revenue (Million), by Country 2024 & 2032
- Figure 80: Asia Pacific BI in Healthcare Industry Volume (K Unit), by Country 2024 & 2032
- Figure 81: Asia Pacific BI in Healthcare Industry Revenue Share (%), by Country 2024 & 2032
- Figure 82: Asia Pacific BI in Healthcare Industry Volume Share (%), by Country 2024 & 2032
- Figure 83: Middle East and Africa BI in Healthcare Industry Revenue (Million), by Component 2024 & 2032
- Figure 84: Middle East and Africa BI in Healthcare Industry Volume (K Unit), by Component 2024 & 2032
- Figure 85: Middle East and Africa BI in Healthcare Industry Revenue Share (%), by Component 2024 & 2032
- Figure 86: Middle East and Africa BI in Healthcare Industry Volume Share (%), by Component 2024 & 2032
- Figure 87: Middle East and Africa BI in Healthcare Industry Revenue (Million), by Mode of Delivery 2024 & 2032
- Figure 88: Middle East and Africa BI in Healthcare Industry Volume (K Unit), by Mode of Delivery 2024 & 2032
- Figure 89: Middle East and Africa BI in Healthcare Industry Revenue Share (%), by Mode of Delivery 2024 & 2032
- Figure 90: Middle East and Africa BI in Healthcare Industry Volume Share (%), by Mode of Delivery 2024 & 2032
- Figure 91: Middle East and Africa BI in Healthcare Industry Revenue (Million), by Application 2024 & 2032
- Figure 92: Middle East and Africa BI in Healthcare Industry Volume (K Unit), by Application 2024 & 2032
- Figure 93: Middle East and Africa BI in Healthcare Industry Revenue Share (%), by Application 2024 & 2032
- Figure 94: Middle East and Africa BI in Healthcare Industry Volume Share (%), by Application 2024 & 2032
- Figure 95: Middle East and Africa BI in Healthcare Industry Revenue (Million), by End User 2024 & 2032
- Figure 96: Middle East and Africa BI in Healthcare Industry Volume (K Unit), by End User 2024 & 2032
- Figure 97: Middle East and Africa BI in Healthcare Industry Revenue Share (%), by End User 2024 & 2032
- Figure 98: Middle East and Africa BI in Healthcare Industry Volume Share (%), by End User 2024 & 2032
- Figure 99: Middle East and Africa BI in Healthcare Industry Revenue (Million), by Country 2024 & 2032
- Figure 100: Middle East and Africa BI in Healthcare Industry Volume (K Unit), by Country 2024 & 2032
- Figure 101: Middle East and Africa BI in Healthcare Industry Revenue Share (%), by Country 2024 & 2032
- Figure 102: Middle East and Africa BI in Healthcare Industry Volume Share (%), by Country 2024 & 2032
- Figure 103: South America BI in Healthcare Industry Revenue (Million), by Component 2024 & 2032
- Figure 104: South America BI in Healthcare Industry Volume (K Unit), by Component 2024 & 2032
- Figure 105: South America BI in Healthcare Industry Revenue Share (%), by Component 2024 & 2032
- Figure 106: South America BI in Healthcare Industry Volume Share (%), by Component 2024 & 2032
- Figure 107: South America BI in Healthcare Industry Revenue (Million), by Mode of Delivery 2024 & 2032
- Figure 108: South America BI in Healthcare Industry Volume (K Unit), by Mode of Delivery 2024 & 2032
- Figure 109: South America BI in Healthcare Industry Revenue Share (%), by Mode of Delivery 2024 & 2032
- Figure 110: South America BI in Healthcare Industry Volume Share (%), by Mode of Delivery 2024 & 2032
- Figure 111: South America BI in Healthcare Industry Revenue (Million), by Application 2024 & 2032
- Figure 112: South America BI in Healthcare Industry Volume (K Unit), by Application 2024 & 2032
- Figure 113: South America BI in Healthcare Industry Revenue Share (%), by Application 2024 & 2032
- Figure 114: South America BI in Healthcare Industry Volume Share (%), by Application 2024 & 2032
- Figure 115: South America BI in Healthcare Industry Revenue (Million), by End User 2024 & 2032
- Figure 116: South America BI in Healthcare Industry Volume (K Unit), by End User 2024 & 2032
- Figure 117: South America BI in Healthcare Industry Revenue Share (%), by End User 2024 & 2032
- Figure 118: South America BI in Healthcare Industry Volume Share (%), by End User 2024 & 2032
- Figure 119: South America BI in Healthcare Industry Revenue (Million), by Country 2024 & 2032
- Figure 120: South America BI in Healthcare Industry Volume (K Unit), by Country 2024 & 2032
- Figure 121: South America BI in Healthcare Industry Revenue Share (%), by Country 2024 & 2032
- Figure 122: South America BI in Healthcare Industry Volume Share (%), by Country 2024 & 2032
List of Tables
- Table 1: Global BI in Healthcare Industry Revenue Million Forecast, by Region 2019 & 2032
- Table 2: Global BI in Healthcare Industry Volume K Unit Forecast, by Region 2019 & 2032
- Table 3: Global BI in Healthcare Industry Revenue Million Forecast, by Component 2019 & 2032
- Table 4: Global BI in Healthcare Industry Volume K Unit Forecast, by Component 2019 & 2032
- Table 5: Global BI in Healthcare Industry Revenue Million Forecast, by Mode of Delivery 2019 & 2032
- Table 6: Global BI in Healthcare Industry Volume K Unit Forecast, by Mode of Delivery 2019 & 2032
- Table 7: Global BI in Healthcare Industry Revenue Million Forecast, by Application 2019 & 2032
- Table 8: Global BI in Healthcare Industry Volume K Unit Forecast, by Application 2019 & 2032
- Table 9: Global BI in Healthcare Industry Revenue Million Forecast, by End User 2019 & 2032
- Table 10: Global BI in Healthcare Industry Volume K Unit Forecast, by End User 2019 & 2032
- Table 11: Global BI in Healthcare Industry Revenue Million Forecast, by Region 2019 & 2032
- Table 12: Global BI in Healthcare Industry Volume K Unit Forecast, by Region 2019 & 2032
- Table 13: Global BI in Healthcare Industry Revenue Million Forecast, by Country 2019 & 2032
- Table 14: Global BI in Healthcare Industry Volume K Unit Forecast, by Country 2019 & 2032
- Table 15: United States BI in Healthcare Industry Revenue (Million) Forecast, by Application 2019 & 2032
- Table 16: United States BI in Healthcare Industry Volume (K Unit) Forecast, by Application 2019 & 2032
- Table 17: Canada BI in Healthcare Industry Revenue (Million) Forecast, by Application 2019 & 2032
- Table 18: Canada BI in Healthcare Industry Volume (K Unit) Forecast, by Application 2019 & 2032
- Table 19: Mexico BI in Healthcare Industry Revenue (Million) Forecast, by Application 2019 & 2032
- Table 20: Mexico BI in Healthcare Industry Volume (K Unit) Forecast, by Application 2019 & 2032
- Table 21: Global BI in Healthcare Industry Revenue Million Forecast, by Country 2019 & 2032
- Table 22: Global BI in Healthcare Industry Volume K Unit Forecast, by Country 2019 & 2032
- Table 23: Germany BI in Healthcare Industry Revenue (Million) Forecast, by Application 2019 & 2032
- Table 24: Germany BI in Healthcare Industry Volume (K Unit) Forecast, by Application 2019 & 2032
- Table 25: United Kingdom BI in Healthcare Industry Revenue (Million) Forecast, by Application 2019 & 2032
- Table 26: United Kingdom BI in Healthcare Industry Volume (K Unit) Forecast, by Application 2019 & 2032
- Table 27: France BI in Healthcare Industry Revenue (Million) Forecast, by Application 2019 & 2032
- Table 28: France BI in Healthcare Industry Volume (K Unit) Forecast, by Application 2019 & 2032
- Table 29: Italy BI in Healthcare Industry Revenue (Million) Forecast, by Application 2019 & 2032
- Table 30: Italy BI in Healthcare Industry Volume (K Unit) Forecast, by Application 2019 & 2032
- Table 31: Spain BI in Healthcare Industry Revenue (Million) Forecast, by Application 2019 & 2032
- Table 32: Spain BI in Healthcare Industry Volume (K Unit) Forecast, by Application 2019 & 2032
- Table 33: Rest of Europe BI in Healthcare Industry Revenue (Million) Forecast, by Application 2019 & 2032
- Table 34: Rest of Europe BI in Healthcare Industry Volume (K Unit) Forecast, by Application 2019 & 2032
- Table 35: Global BI in Healthcare Industry Revenue Million Forecast, by Country 2019 & 2032
- Table 36: Global BI in Healthcare Industry Volume K Unit Forecast, by Country 2019 & 2032
- Table 37: China BI in Healthcare Industry Revenue (Million) Forecast, by Application 2019 & 2032
- Table 38: China BI in Healthcare Industry Volume (K Unit) Forecast, by Application 2019 & 2032
- Table 39: Japan BI in Healthcare Industry Revenue (Million) Forecast, by Application 2019 & 2032
- Table 40: Japan BI in Healthcare Industry Volume (K Unit) Forecast, by Application 2019 & 2032
- Table 41: India BI in Healthcare Industry Revenue (Million) Forecast, by Application 2019 & 2032
- Table 42: India BI in Healthcare Industry Volume (K Unit) Forecast, by Application 2019 & 2032
- Table 43: Australia BI in Healthcare Industry Revenue (Million) Forecast, by Application 2019 & 2032
- Table 44: Australia BI in Healthcare Industry Volume (K Unit) Forecast, by Application 2019 & 2032
- Table 45: South Korea BI in Healthcare Industry Revenue (Million) Forecast, by Application 2019 & 2032
- Table 46: South Korea BI in Healthcare Industry Volume (K Unit) Forecast, by Application 2019 & 2032
- Table 47: Rest of Asia Pacific BI in Healthcare Industry Revenue (Million) Forecast, by Application 2019 & 2032
- Table 48: Rest of Asia Pacific BI in Healthcare Industry Volume (K Unit) Forecast, by Application 2019 & 2032
- Table 49: Global BI in Healthcare Industry Revenue Million Forecast, by Country 2019 & 2032
- Table 50: Global BI in Healthcare Industry Volume K Unit Forecast, by Country 2019 & 2032
- Table 51: GCC BI in Healthcare Industry Revenue (Million) Forecast, by Application 2019 & 2032
- Table 52: GCC BI in Healthcare Industry Volume (K Unit) Forecast, by Application 2019 & 2032
- Table 53: South Africa BI in Healthcare Industry Revenue (Million) Forecast, by Application 2019 & 2032
- Table 54: South Africa BI in Healthcare Industry Volume (K Unit) Forecast, by Application 2019 & 2032
- Table 55: Rest of Middle East and Africa BI in Healthcare Industry Revenue (Million) Forecast, by Application 2019 & 2032
- Table 56: Rest of Middle East and Africa BI in Healthcare Industry Volume (K Unit) Forecast, by Application 2019 & 2032
- Table 57: Global BI in Healthcare Industry Revenue Million Forecast, by Country 2019 & 2032
- Table 58: Global BI in Healthcare Industry Volume K Unit Forecast, by Country 2019 & 2032
- Table 59: Brazil BI in Healthcare Industry Revenue (Million) Forecast, by Application 2019 & 2032
- Table 60: Brazil BI in Healthcare Industry Volume (K Unit) Forecast, by Application 2019 & 2032
- Table 61: Argentina BI in Healthcare Industry Revenue (Million) Forecast, by Application 2019 & 2032
- Table 62: Argentina BI in Healthcare Industry Volume (K Unit) Forecast, by Application 2019 & 2032
- Table 63: Rest of South America BI in Healthcare Industry Revenue (Million) Forecast, by Application 2019 & 2032
- Table 64: Rest of South America BI in Healthcare Industry Volume (K Unit) Forecast, by Application 2019 & 2032
- Table 65: Global BI in Healthcare Industry Revenue Million Forecast, by Component 2019 & 2032
- Table 66: Global BI in Healthcare Industry Volume K Unit Forecast, by Component 2019 & 2032
- Table 67: Global BI in Healthcare Industry Revenue Million Forecast, by Mode of Delivery 2019 & 2032
- Table 68: Global BI in Healthcare Industry Volume K Unit Forecast, by Mode of Delivery 2019 & 2032
- Table 69: Global BI in Healthcare Industry Revenue Million Forecast, by Application 2019 & 2032
- Table 70: Global BI in Healthcare Industry Volume K Unit Forecast, by Application 2019 & 2032
- Table 71: Global BI in Healthcare Industry Revenue Million Forecast, by End User 2019 & 2032
- Table 72: Global BI in Healthcare Industry Volume K Unit Forecast, by End User 2019 & 2032
- Table 73: Global BI in Healthcare Industry Revenue Million Forecast, by Country 2019 & 2032
- Table 74: Global BI in Healthcare Industry Volume K Unit Forecast, by Country 2019 & 2032
- Table 75: United States BI in Healthcare Industry Revenue (Million) Forecast, by Application 2019 & 2032
- Table 76: United States BI in Healthcare Industry Volume (K Unit) Forecast, by Application 2019 & 2032
- Table 77: Canada BI in Healthcare Industry Revenue (Million) Forecast, by Application 2019 & 2032
- Table 78: Canada BI in Healthcare Industry Volume (K Unit) Forecast, by Application 2019 & 2032
- Table 79: Mexico BI in Healthcare Industry Revenue (Million) Forecast, by Application 2019 & 2032
- Table 80: Mexico BI in Healthcare Industry Volume (K Unit) Forecast, by Application 2019 & 2032
- Table 81: Global BI in Healthcare Industry Revenue Million Forecast, by Component 2019 & 2032
- Table 82: Global BI in Healthcare Industry Volume K Unit Forecast, by Component 2019 & 2032
- Table 83: Global BI in Healthcare Industry Revenue Million Forecast, by Mode of Delivery 2019 & 2032
- Table 84: Global BI in Healthcare Industry Volume K Unit Forecast, by Mode of Delivery 2019 & 2032
- Table 85: Global BI in Healthcare Industry Revenue Million Forecast, by Application 2019 & 2032
- Table 86: Global BI in Healthcare Industry Volume K Unit Forecast, by Application 2019 & 2032
- Table 87: Global BI in Healthcare Industry Revenue Million Forecast, by End User 2019 & 2032
- Table 88: Global BI in Healthcare Industry Volume K Unit Forecast, by End User 2019 & 2032
- Table 89: Global BI in Healthcare Industry Revenue Million Forecast, by Country 2019 & 2032
- Table 90: Global BI in Healthcare Industry Volume K Unit Forecast, by Country 2019 & 2032
- Table 91: Germany BI in Healthcare Industry Revenue (Million) Forecast, by Application 2019 & 2032
- Table 92: Germany BI in Healthcare Industry Volume (K Unit) Forecast, by Application 2019 & 2032
- Table 93: United Kingdom BI in Healthcare Industry Revenue (Million) Forecast, by Application 2019 & 2032
- Table 94: United Kingdom BI in Healthcare Industry Volume (K Unit) Forecast, by Application 2019 & 2032
- Table 95: France BI in Healthcare Industry Revenue (Million) Forecast, by Application 2019 & 2032
- Table 96: France BI in Healthcare Industry Volume (K Unit) Forecast, by Application 2019 & 2032
- Table 97: Italy BI in Healthcare Industry Revenue (Million) Forecast, by Application 2019 & 2032
- Table 98: Italy BI in Healthcare Industry Volume (K Unit) Forecast, by Application 2019 & 2032
- Table 99: Spain BI in Healthcare Industry Revenue (Million) Forecast, by Application 2019 & 2032
- Table 100: Spain BI in Healthcare Industry Volume (K Unit) Forecast, by Application 2019 & 2032
- Table 101: Rest of Europe BI in Healthcare Industry Revenue (Million) Forecast, by Application 2019 & 2032
- Table 102: Rest of Europe BI in Healthcare Industry Volume (K Unit) Forecast, by Application 2019 & 2032
- Table 103: Global BI in Healthcare Industry Revenue Million Forecast, by Component 2019 & 2032
- Table 104: Global BI in Healthcare Industry Volume K Unit Forecast, by Component 2019 & 2032
- Table 105: Global BI in Healthcare Industry Revenue Million Forecast, by Mode of Delivery 2019 & 2032
- Table 106: Global BI in Healthcare Industry Volume K Unit Forecast, by Mode of Delivery 2019 & 2032
- Table 107: Global BI in Healthcare Industry Revenue Million Forecast, by Application 2019 & 2032
- Table 108: Global BI in Healthcare Industry Volume K Unit Forecast, by Application 2019 & 2032
- Table 109: Global BI in Healthcare Industry Revenue Million Forecast, by End User 2019 & 2032
- Table 110: Global BI in Healthcare Industry Volume K Unit Forecast, by End User 2019 & 2032
- Table 111: Global BI in Healthcare Industry Revenue Million Forecast, by Country 2019 & 2032
- Table 112: Global BI in Healthcare Industry Volume K Unit Forecast, by Country 2019 & 2032
- Table 113: China BI in Healthcare Industry Revenue (Million) Forecast, by Application 2019 & 2032
- Table 114: China BI in Healthcare Industry Volume (K Unit) Forecast, by Application 2019 & 2032
- Table 115: Japan BI in Healthcare Industry Revenue (Million) Forecast, by Application 2019 & 2032
- Table 116: Japan BI in Healthcare Industry Volume (K Unit) Forecast, by Application 2019 & 2032
- Table 117: India BI in Healthcare Industry Revenue (Million) Forecast, by Application 2019 & 2032
- Table 118: India BI in Healthcare Industry Volume (K Unit) Forecast, by Application 2019 & 2032
- Table 119: Australia BI in Healthcare Industry Revenue (Million) Forecast, by Application 2019 & 2032
- Table 120: Australia BI in Healthcare Industry Volume (K Unit) Forecast, by Application 2019 & 2032
- Table 121: South Korea BI in Healthcare Industry Revenue (Million) Forecast, by Application 2019 & 2032
- Table 122: South Korea BI in Healthcare Industry Volume (K Unit) Forecast, by Application 2019 & 2032
- Table 123: Rest of Asia Pacific BI in Healthcare Industry Revenue (Million) Forecast, by Application 2019 & 2032
- Table 124: Rest of Asia Pacific BI in Healthcare Industry Volume (K Unit) Forecast, by Application 2019 & 2032
- Table 125: Global BI in Healthcare Industry Revenue Million Forecast, by Component 2019 & 2032
- Table 126: Global BI in Healthcare Industry Volume K Unit Forecast, by Component 2019 & 2032
- Table 127: Global BI in Healthcare Industry Revenue Million Forecast, by Mode of Delivery 2019 & 2032
- Table 128: Global BI in Healthcare Industry Volume K Unit Forecast, by Mode of Delivery 2019 & 2032
- Table 129: Global BI in Healthcare Industry Revenue Million Forecast, by Application 2019 & 2032
- Table 130: Global BI in Healthcare Industry Volume K Unit Forecast, by Application 2019 & 2032
- Table 131: Global BI in Healthcare Industry Revenue Million Forecast, by End User 2019 & 2032
- Table 132: Global BI in Healthcare Industry Volume K Unit Forecast, by End User 2019 & 2032
- Table 133: Global BI in Healthcare Industry Revenue Million Forecast, by Country 2019 & 2032
- Table 134: Global BI in Healthcare Industry Volume K Unit Forecast, by Country 2019 & 2032
- Table 135: GCC BI in Healthcare Industry Revenue (Million) Forecast, by Application 2019 & 2032
- Table 136: GCC BI in Healthcare Industry Volume (K Unit) Forecast, by Application 2019 & 2032
- Table 137: South Africa BI in Healthcare Industry Revenue (Million) Forecast, by Application 2019 & 2032
- Table 138: South Africa BI in Healthcare Industry Volume (K Unit) Forecast, by Application 2019 & 2032
- Table 139: Rest of Middle East and Africa BI in Healthcare Industry Revenue (Million) Forecast, by Application 2019 & 2032
- Table 140: Rest of Middle East and Africa BI in Healthcare Industry Volume (K Unit) Forecast, by Application 2019 & 2032
- Table 141: Global BI in Healthcare Industry Revenue Million Forecast, by Component 2019 & 2032
- Table 142: Global BI in Healthcare Industry Volume K Unit Forecast, by Component 2019 & 2032
- Table 143: Global BI in Healthcare Industry Revenue Million Forecast, by Mode of Delivery 2019 & 2032
- Table 144: Global BI in Healthcare Industry Volume K Unit Forecast, by Mode of Delivery 2019 & 2032
- Table 145: Global BI in Healthcare Industry Revenue Million Forecast, by Application 2019 & 2032
- Table 146: Global BI in Healthcare Industry Volume K Unit Forecast, by Application 2019 & 2032
- Table 147: Global BI in Healthcare Industry Revenue Million Forecast, by End User 2019 & 2032
- Table 148: Global BI in Healthcare Industry Volume K Unit Forecast, by End User 2019 & 2032
- Table 149: Global BI in Healthcare Industry Revenue Million Forecast, by Country 2019 & 2032
- Table 150: Global BI in Healthcare Industry Volume K Unit Forecast, by Country 2019 & 2032
- Table 151: Brazil BI in Healthcare Industry Revenue (Million) Forecast, by Application 2019 & 2032
- Table 152: Brazil BI in Healthcare Industry Volume (K Unit) Forecast, by Application 2019 & 2032
- Table 153: Argentina BI in Healthcare Industry Revenue (Million) Forecast, by Application 2019 & 2032
- Table 154: Argentina BI in Healthcare Industry Volume (K Unit) Forecast, by Application 2019 & 2032
- Table 155: Rest of South America BI in Healthcare Industry Revenue (Million) Forecast, by Application 2019 & 2032
- Table 156: Rest of South America BI in Healthcare Industry Volume (K Unit) Forecast, by Application 2019 & 2032
Frequently Asked Questions
1. What is the projected Compound Annual Growth Rate (CAGR) of the BI in Healthcare Industry?
The projected CAGR is approximately 14.41%.
2. Which companies are prominent players in the BI in Healthcare Industry?
Key companies in the market include SAS Institute Inc, Infor Inc, IBM Corporation, MicroStrategy Incorporated, Microsoft Corporation, CareCloud Inc, EPIC SYSTEMS, QlikTech International AB, Information Builders, Oracle Corporation, Salesforce, Sisense Inc, Domo Inc , SAP SE.
3. What are the main segments of the BI in Healthcare Industry?
The market segments include Component, Mode of Delivery, Application, End User.
4. Can you provide details about the market size?
The market size is estimated to be USD 10.17 Million as of 2022.
5. What are some drivers contributing to market growth?
Growing Government Initiatives for Healthcare Digitalization. Like Adoption of EHR; Increasing Number of Patient Registries; The Emergence of Big Data in the Healthcare Industry.
6. What are the notable trends driving market growth?
Cloud-based Model is Expected to Grow Significantly in the Healthcare BI Market Over the Forecast Period.
7. Are there any restraints impacting market growth?
High Cost of Implementation; Lack of Skilled Professionals.
8. Can you provide examples of recent developments in the market?
Jun 2022: Oracle Corporation completed the acquisition of Cerner Corporation, a supplier of health information technology services.
9. What pricing options are available for accessing the report?
Pricing options include single-user, multi-user, and enterprise licenses priced at USD 4750, USD 5250, and USD 8750 respectively.
10. Is the market size provided in terms of value or volume?
The market size is provided in terms of value, measured in Million and volume, measured in K Unit.
11. Are there any specific market keywords associated with the report?
Yes, the market keyword associated with the report is "BI in Healthcare Industry," which aids in identifying and referencing the specific market segment covered.
12. How do I determine which pricing option suits my needs best?
The pricing options vary based on user requirements and access needs. Individual users may opt for single-user licenses, while businesses requiring broader access may choose multi-user or enterprise licenses for cost-effective access to the report.
13. Are there any additional resources or data provided in the BI in Healthcare Industry report?
While the report offers comprehensive insights, it's advisable to review the specific contents or supplementary materials provided to ascertain if additional resources or data are available.
14. How can I stay updated on further developments or reports in the BI in Healthcare Industry?
To stay informed about further developments, trends, and reports in the BI in Healthcare Industry, consider subscribing to industry newsletters, following relevant companies and organizations, or regularly checking reputable industry news sources and publications.
Methodology
Step 1 - Identification of Relevant Samples Size from Population Database


Step 2 - Approaches for Defining Global Market Size (Value, Volume* & Price*)

Note*: In applicable scenarios
Step 3 - Data Sources
Primary Research
- Web Analytics
- Survey Reports
- Research Institute
- Latest Research Reports
- Opinion Leaders
Secondary Research
- Annual Reports
- White Paper
- Latest Press Release
- Industry Association
- Paid Database
- Investor Presentations

Step 4 - Data Triangulation
Involves using different sources of information in order to increase the validity of a study
These sources are likely to be stakeholders in a program - participants, other researchers, program staff, other community members, and so on.
Then we put all data in single framework & apply various statistical tools to find out the dynamic on the market.
During the analysis stage, feedback from the stakeholder groups would be compared to determine areas of agreement as well as areas of divergence
