

Key Insights
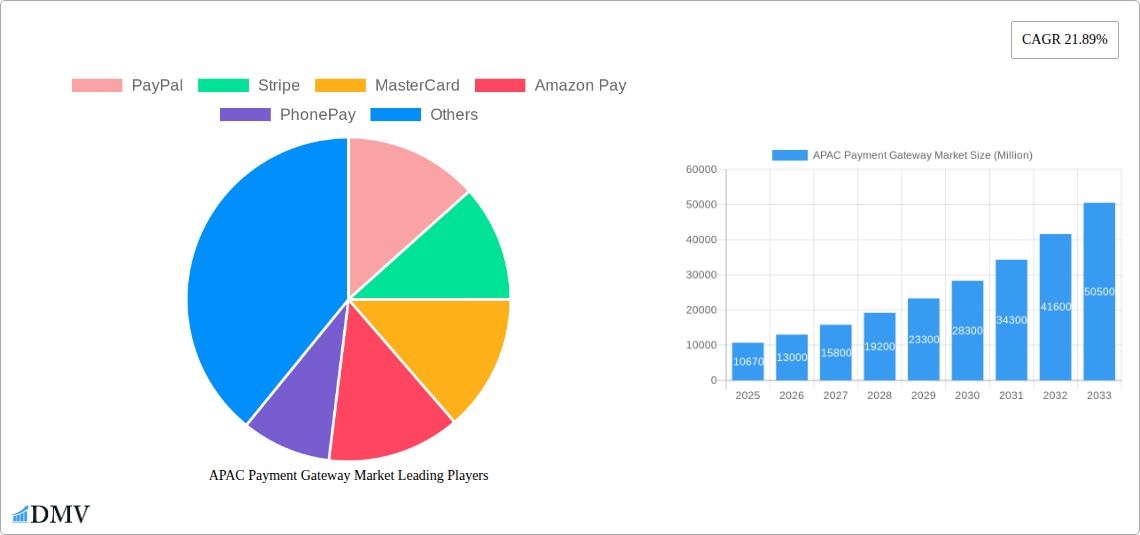
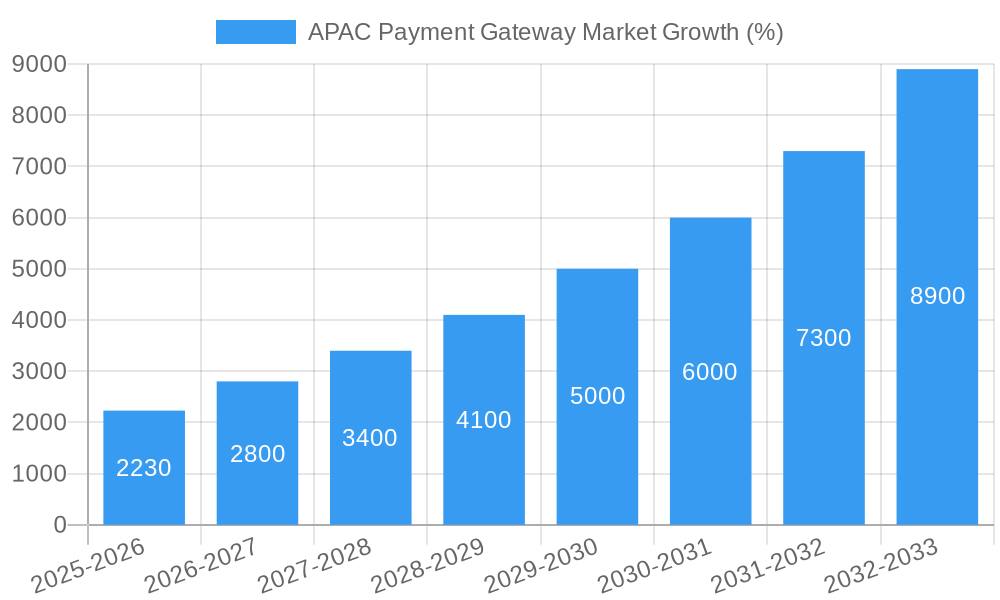
The APAC Payment Gateway Market is experiencing robust growth, projected to reach a market size of $10.67 billion in 2025 and exhibiting a Compound Annual Growth Rate (CAGR) of 21.89% from 2025 to 2033. This surge is fueled by the region's burgeoning e-commerce sector, increasing smartphone penetration, and a rising preference for digital payment methods among consumers. The market's expansion is driven by factors such as the increasing adoption of mobile payments, the growth of online businesses, and government initiatives promoting digitalization. Furthermore, the rising adoption of innovative payment technologies like mobile wallets and contactless payments is significantly contributing to market growth. Key players like PayPal, Stripe, Mastercard, and regional giants like PhonePe and Alipay are actively shaping the competitive landscape through strategic partnerships, technological advancements, and expansion into new markets. The market is segmented based on payment type (credit/debit cards, mobile wallets, etc.), transaction type (e-commerce, in-store), and deployment mode (cloud-based, on-premise). While regulatory hurdles and security concerns pose some challenges, the overall market outlook remains highly positive, driven by sustained economic growth and technological innovation across the APAC region.
The forecast period (2025-2033) anticipates continued expansion, with the market size likely exceeding $50 billion by 2033, considering the projected CAGR. This growth will be influenced by increasing cross-border e-commerce, the emergence of Buy Now Pay Later (BNPL) services, and the continuous evolution of payment technologies to address evolving consumer needs and preferences for speed, security, and convenience. The competitive landscape will remain dynamic with both established players and fintech startups vying for market share through innovative solutions and strategic acquisitions. The continued focus on enhancing security measures and compliance with data privacy regulations will also play a crucial role in shaping the market's trajectory in the coming years.
APAC Payment Gateway Market: A Comprehensive Report (2019-2033)
This insightful report provides a deep dive into the dynamic APAC Payment Gateway Market, offering a comprehensive analysis of its current state, future trajectory, and key players. With a study period spanning 2019-2033, a base year of 2025, and a forecast period of 2025-2033, this report is an indispensable resource for stakeholders seeking to understand and capitalize on the immense opportunities within this rapidly evolving market. The report's meticulous research incorporates extensive data analysis, highlighting key trends and providing actionable insights to inform strategic decision-making. The market is projected to reach xx Million by 2033, representing a significant growth opportunity for investors and businesses alike.
APAC Payment Gateway Market Composition & Trends
This section evaluates the competitive landscape of the APAC payment gateway market, analyzing market concentration, innovation drivers, regulatory environments, substitute products, end-user profiles, and merger & acquisition (M&A) activity. The report details market share distribution among key players, including PayPal, Stripe, MasterCard, Amazon Pay, PhonePay, Google Pay, RazorPay, AsiaPay, 2Checkout.com Inc, and Eway (list not exhaustive). We examine the impact of technological advancements like mobile wallets and blockchain on market dynamics. Furthermore, we delve into the evolving regulatory landscape across various APAC nations, assessing its influence on market growth and competition. The analysis also incorporates an in-depth examination of M&A activities, quantifying deal values and their implications for market consolidation and innovation.
- Market Concentration: Analysis of market share held by top players, identifying dominant players and emerging competitors.
- Innovation Catalysts: Examination of technological advancements driving market growth, such as mobile payments, blockchain technology, and AI-powered fraud detection.
- Regulatory Landscape: Detailed overview of payment regulations across APAC countries and their impact on market entry and operation.
- Substitute Products: Assessment of alternative payment methods and their potential impact on market share.
- End-User Profiles: Segmentation of users based on demographics, transaction behavior, and preferences.
- M&A Activities: Analysis of key mergers and acquisitions, including deal values and their impact on market consolidation. Total M&A deal value in the period 2019-2024 is estimated at xx Million.
APAC Payment Gateway Market Industry Evolution
This section meticulously tracks the evolution of the APAC payment gateway market throughout the historical period (2019-2024) and projects its trajectory during the forecast period (2025-2033). We analyze market growth trajectories, pinpointing key inflection points and drivers behind fluctuating growth rates. The report examines technological advancements, highlighting the adoption of new technologies and their impact on market efficiency and security. It also explores the changing preferences of consumers, focusing on the shift towards digital payments and the increasing demand for seamless and secure online transaction experiences. The analysis incorporates specific data points, including compound annual growth rates (CAGR) and adoption metrics for various payment methods across different segments. For example, the adoption rate of mobile wallets is expected to increase by xx% from 2025 to 2033.
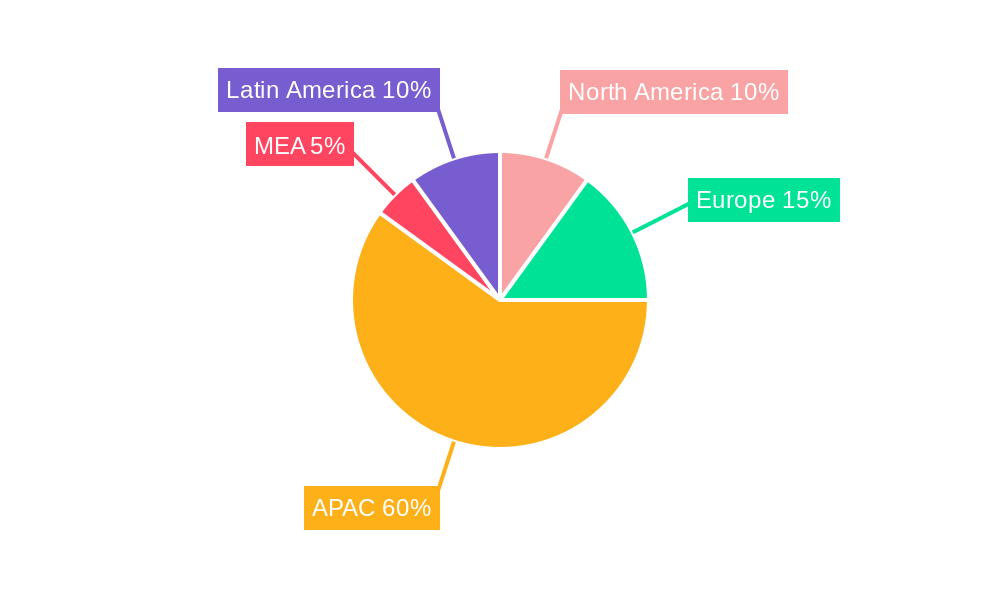
Leading Regions, Countries, or Segments in APAC Payment Gateway Market
This section identifies the leading regions, countries, and segments within the APAC payment gateway market. The analysis explores the factors contributing to the dominance of specific regions or segments. A detailed breakdown of market size and growth potential for each region is provided.
Key Drivers of Dominance:
- Investment Trends: Analysis of venture capital and private equity investments in the payment gateway sector across various regions.
- Regulatory Support: Assessment of government policies and regulations that promote the growth of the payment gateway industry.
- Technological Infrastructure: Examination of the availability and quality of technological infrastructure in different regions, including internet penetration and mobile network coverage.
- Consumer Behavior: Analysis of consumer preferences and payment habits in different regions.
In-Depth Analysis: Paragraphs providing detailed explanations of the factors contributing to the dominance of specific regions, countries, or segments. For example, China's robust digital economy and large population drive its market leadership.
APAC Payment Gateway Market Product Innovations
This section explores the latest product innovations, applications, and performance metrics within the APAC payment gateway market. It highlights unique selling propositions (USPs) and technological advancements that are shaping the competitive landscape. Examples include advancements in fraud prevention, the integration of biometric authentication, and the development of specialized solutions for specific industries. The report details performance improvements such as faster transaction processing speeds and reduced transaction fees.
Propelling Factors for APAC Payment Gateway Market Growth
The robust growth of the APAC payment gateway market is fueled by a confluence of factors. Technological advancements, such as the widespread adoption of smartphones and the proliferation of e-commerce, are key drivers. Furthermore, supportive government regulations and initiatives aimed at promoting digital transactions are boosting market expansion. The increasing penetration of internet and mobile connectivity across the region is also creating a conducive environment for the growth of digital payment solutions. Economic factors such as rising disposable incomes and a growing middle class contribute to increased online spending, further fueling demand for secure and efficient payment gateways.
Obstacles in the APAC Payment Gateway Market
Despite significant growth potential, the APAC payment gateway market faces several challenges. Stringent regulatory requirements in certain countries can pose barriers to entry for new players. Supply chain disruptions, particularly during times of global uncertainty, can impact the availability of critical infrastructure and services. Intense competition from established players and emerging fintech companies necessitates continuous innovation and adaptation to maintain a competitive edge. The need for robust security measures to combat fraud and data breaches is also a major concern, incurring significant costs for payment gateway providers. These obstacles can lead to increased operational costs and limit market expansion for some players.
Future Opportunities in APAP Payment Gateway Market
The APAC payment gateway market presents promising future opportunities. The expansion of e-commerce into underserved markets and the growing adoption of mobile payments present significant growth potential. Advancements in technologies such as blockchain and AI offer opportunities for enhanced security and efficiency. The increasing focus on cross-border payments creates new avenues for growth. Furthermore, the rising adoption of Buy Now Pay Later (BNPL) services is reshaping the payment landscape, creating new opportunities for innovation and expansion.
Major Players in the APAC Payment Gateway Market Ecosystem
- PayPal
- Stripe
- MasterCard
- Amazon Pay
- PhonePay
- Google Pay
- RazorPay
- AsiaPay
- 2Checkout.com Inc
- Eway
*List Not Exhaustive
Key Developments in APAC Payment Gateway Market Industry
May 2024: Mastercard officially launched domestic payment processing services in China through its joint venture, Mastercard NetsUnion Information Technology. This significantly expands Mastercard's reach within the Chinese market, enabling it to process payments for both domestic and international transactions using Mastercard-branded cards issued by Chinese banks. This development significantly enhances Mastercard's market position in China, a key market within APAC.
April 2024: Soft Space partnered with JCB to launch a payment gateway in Malaysia. This collaboration leverages JCB's extensive network and Soft Space's technological expertise to address the growing demand for secure digital transactions in Malaysia. This expands JCB's reach in the Malaysian market and provides Soft Space with access to JCB's extensive cardholder base, strengthening the competitive landscape within Malaysia.
Strategic APAC Payment Gateway Market Forecast
The APAC payment gateway market is poised for robust growth driven by several key factors. The increasing adoption of digital payments, expanding e-commerce, and rising smartphone penetration will fuel market expansion. Technological advancements such as the integration of AI and blockchain will further enhance security and efficiency, attracting more users. Favorable regulatory environments in several key markets will continue to support market growth. The market's potential is substantial, with a significant projected increase in transaction volume and market value over the forecast period. This presents substantial opportunities for both existing and new market entrants.
APAC Payment Gateway Market Segmentation
-
1. Type
- 1.1. Hosted
- 1.2. Non-hosted
-
2. Enterprise
- 2.1. Small and Medium Enterprise (SME)
- 2.2. Large Enterprise
-
3. End User
- 3.1. Travel
- 3.2. Retail
- 3.3. BFSI
- 3.4. Media and Entertainment
- 3.5. Other End Users
APAC Payment Gateway Market Segmentation By Geography
-
1. North America
- 1.1. United States
- 1.2. Canada
- 1.3. Mexico
-
2. South America
- 2.1. Brazil
- 2.2. Argentina
- 2.3. Rest of South America
-
3. Europe
- 3.1. United Kingdom
- 3.2. Germany
- 3.3. France
- 3.4. Italy
- 3.5. Spain
- 3.6. Russia
- 3.7. Benelux
- 3.8. Nordics
- 3.9. Rest of Europe
-
4. Middle East & Africa
- 4.1. Turkey
- 4.2. Israel
- 4.3. GCC
- 4.4. North Africa
- 4.5. South Africa
- 4.6. Rest of Middle East & Africa
-
5. Asia Pacific
- 5.1. China
- 5.2. India
- 5.3. Japan
- 5.4. South Korea
- 5.5. ASEAN
- 5.6. Oceania
- 5.7. Rest of Asia Pacific
APAC Payment Gateway Market REPORT HIGHLIGHTS
| Aspects | Details |
|---|---|
| Study Period | 2019-2033 |
| Base Year | 2024 |
| Estimated Year | 2025 |
| Forecast Period | 2025-2033 |
| Historical Period | 2019-2024 |
| Growth Rate | CAGR of 21.89% from 2019-2033 |
| Segmentation |
|
Table of Contents
- 1. Introduction
- 1.1. Research Scope
- 1.2. Market Segmentation
- 1.3. Research Methodology
- 1.4. Definitions and Assumptions
- 2. Executive Summary
- 2.1. Introduction
- 3. Market Dynamics
- 3.1. Introduction
- 3.2. Market Drivers
- 3.2.1. Increased E-commerce Sales and High Internet Penetration Rate; Increased Demand for Mobile-based Payments; Growing Adoption of Payment Gateways in Retail
- 3.3. Market Restrains
- 3.3.1. Increased E-commerce Sales and High Internet Penetration Rate; Increased Demand for Mobile-based Payments; Growing Adoption of Payment Gateways in Retail
- 3.4. Market Trends
- 3.4.1. Growing Use of Payment Gateway in Tavel Industry.
- 4. Market Factor Analysis
- 4.1. Porters Five Forces
- 4.2. Supply/Value Chain
- 4.3. PESTEL analysis
- 4.4. Market Entropy
- 4.5. Patent/Trademark Analysis
- 5. Global APAC Payment Gateway Market Analysis, Insights and Forecast, 2019-2031
- 5.1. Market Analysis, Insights and Forecast - by Type
- 5.1.1. Hosted
- 5.1.2. Non-hosted
- 5.2. Market Analysis, Insights and Forecast - by Enterprise
- 5.2.1. Small and Medium Enterprise (SME)
- 5.2.2. Large Enterprise
- 5.3. Market Analysis, Insights and Forecast - by End User
- 5.3.1. Travel
- 5.3.2. Retail
- 5.3.3. BFSI
- 5.3.4. Media and Entertainment
- 5.3.5. Other End Users
- 5.4. Market Analysis, Insights and Forecast - by Region
- 5.4.1. North America
- 5.4.2. South America
- 5.4.3. Europe
- 5.4.4. Middle East & Africa
- 5.4.5. Asia Pacific
- 5.1. Market Analysis, Insights and Forecast - by Type
- 6. North America APAC Payment Gateway Market Analysis, Insights and Forecast, 2019-2031
- 6.1. Market Analysis, Insights and Forecast - by Type
- 6.1.1. Hosted
- 6.1.2. Non-hosted
- 6.2. Market Analysis, Insights and Forecast - by Enterprise
- 6.2.1. Small and Medium Enterprise (SME)
- 6.2.2. Large Enterprise
- 6.3. Market Analysis, Insights and Forecast - by End User
- 6.3.1. Travel
- 6.3.2. Retail
- 6.3.3. BFSI
- 6.3.4. Media and Entertainment
- 6.3.5. Other End Users
- 6.1. Market Analysis, Insights and Forecast - by Type
- 7. South America APAC Payment Gateway Market Analysis, Insights and Forecast, 2019-2031
- 7.1. Market Analysis, Insights and Forecast - by Type
- 7.1.1. Hosted
- 7.1.2. Non-hosted
- 7.2. Market Analysis, Insights and Forecast - by Enterprise
- 7.2.1. Small and Medium Enterprise (SME)
- 7.2.2. Large Enterprise
- 7.3. Market Analysis, Insights and Forecast - by End User
- 7.3.1. Travel
- 7.3.2. Retail
- 7.3.3. BFSI
- 7.3.4. Media and Entertainment
- 7.3.5. Other End Users
- 7.1. Market Analysis, Insights and Forecast - by Type
- 8. Europe APAC Payment Gateway Market Analysis, Insights and Forecast, 2019-2031
- 8.1. Market Analysis, Insights and Forecast - by Type
- 8.1.1. Hosted
- 8.1.2. Non-hosted
- 8.2. Market Analysis, Insights and Forecast - by Enterprise
- 8.2.1. Small and Medium Enterprise (SME)
- 8.2.2. Large Enterprise
- 8.3. Market Analysis, Insights and Forecast - by End User
- 8.3.1. Travel
- 8.3.2. Retail
- 8.3.3. BFSI
- 8.3.4. Media and Entertainment
- 8.3.5. Other End Users
- 8.1. Market Analysis, Insights and Forecast - by Type
- 9. Middle East & Africa APAC Payment Gateway Market Analysis, Insights and Forecast, 2019-2031
- 9.1. Market Analysis, Insights and Forecast - by Type
- 9.1.1. Hosted
- 9.1.2. Non-hosted
- 9.2. Market Analysis, Insights and Forecast - by Enterprise
- 9.2.1. Small and Medium Enterprise (SME)
- 9.2.2. Large Enterprise
- 9.3. Market Analysis, Insights and Forecast - by End User
- 9.3.1. Travel
- 9.3.2. Retail
- 9.3.3. BFSI
- 9.3.4. Media and Entertainment
- 9.3.5. Other End Users
- 9.1. Market Analysis, Insights and Forecast - by Type
- 10. Asia Pacific APAC Payment Gateway Market Analysis, Insights and Forecast, 2019-2031
- 10.1. Market Analysis, Insights and Forecast - by Type
- 10.1.1. Hosted
- 10.1.2. Non-hosted
- 10.2. Market Analysis, Insights and Forecast - by Enterprise
- 10.2.1. Small and Medium Enterprise (SME)
- 10.2.2. Large Enterprise
- 10.3. Market Analysis, Insights and Forecast - by End User
- 10.3.1. Travel
- 10.3.2. Retail
- 10.3.3. BFSI
- 10.3.4. Media and Entertainment
- 10.3.5. Other End Users
- 10.1. Market Analysis, Insights and Forecast - by Type
- 11. Competitive Analysis
- 11.1. Global Market Share Analysis 2024
- 11.2. Company Profiles
- 11.2.1 PayPal
- 11.2.1.1. Overview
- 11.2.1.2. Products
- 11.2.1.3. SWOT Analysis
- 11.2.1.4. Recent Developments
- 11.2.1.5. Financials (Based on Availability)
- 11.2.2 Stripe
- 11.2.2.1. Overview
- 11.2.2.2. Products
- 11.2.2.3. SWOT Analysis
- 11.2.2.4. Recent Developments
- 11.2.2.5. Financials (Based on Availability)
- 11.2.3 MasterCard
- 11.2.3.1. Overview
- 11.2.3.2. Products
- 11.2.3.3. SWOT Analysis
- 11.2.3.4. Recent Developments
- 11.2.3.5. Financials (Based on Availability)
- 11.2.4 Amazon Pay
- 11.2.4.1. Overview
- 11.2.4.2. Products
- 11.2.4.3. SWOT Analysis
- 11.2.4.4. Recent Developments
- 11.2.4.5. Financials (Based on Availability)
- 11.2.5 PhonePay
- 11.2.5.1. Overview
- 11.2.5.2. Products
- 11.2.5.3. SWOT Analysis
- 11.2.5.4. Recent Developments
- 11.2.5.5. Financials (Based on Availability)
- 11.2.6 GooglePay
- 11.2.6.1. Overview
- 11.2.6.2. Products
- 11.2.6.3. SWOT Analysis
- 11.2.6.4. Recent Developments
- 11.2.6.5. Financials (Based on Availability)
- 11.2.7 RazorPay
- 11.2.7.1. Overview
- 11.2.7.2. Products
- 11.2.7.3. SWOT Analysis
- 11.2.7.4. Recent Developments
- 11.2.7.5. Financials (Based on Availability)
- 11.2.8 AsiaPay
- 11.2.8.1. Overview
- 11.2.8.2. Products
- 11.2.8.3. SWOT Analysis
- 11.2.8.4. Recent Developments
- 11.2.8.5. Financials (Based on Availability)
- 11.2.9 2Checkout com Inc
- 11.2.9.1. Overview
- 11.2.9.2. Products
- 11.2.9.3. SWOT Analysis
- 11.2.9.4. Recent Developments
- 11.2.9.5. Financials (Based on Availability)
- 11.2.10 Eway*List Not Exhaustive
- 11.2.10.1. Overview
- 11.2.10.2. Products
- 11.2.10.3. SWOT Analysis
- 11.2.10.4. Recent Developments
- 11.2.10.5. Financials (Based on Availability)
- 11.2.1 PayPal
List of Figures
- Figure 1: Global APAC Payment Gateway Market Revenue Breakdown (Million, %) by Region 2024 & 2032
- Figure 2: Global APAC Payment Gateway Market Volume Breakdown (Billion, %) by Region 2024 & 2032
- Figure 3: North America APAC Payment Gateway Market Revenue (Million), by Type 2024 & 2032
- Figure 4: North America APAC Payment Gateway Market Volume (Billion), by Type 2024 & 2032
- Figure 5: North America APAC Payment Gateway Market Revenue Share (%), by Type 2024 & 2032
- Figure 6: North America APAC Payment Gateway Market Volume Share (%), by Type 2024 & 2032
- Figure 7: North America APAC Payment Gateway Market Revenue (Million), by Enterprise 2024 & 2032
- Figure 8: North America APAC Payment Gateway Market Volume (Billion), by Enterprise 2024 & 2032
- Figure 9: North America APAC Payment Gateway Market Revenue Share (%), by Enterprise 2024 & 2032
- Figure 10: North America APAC Payment Gateway Market Volume Share (%), by Enterprise 2024 & 2032
- Figure 11: North America APAC Payment Gateway Market Revenue (Million), by End User 2024 & 2032
- Figure 12: North America APAC Payment Gateway Market Volume (Billion), by End User 2024 & 2032
- Figure 13: North America APAC Payment Gateway Market Revenue Share (%), by End User 2024 & 2032
- Figure 14: North America APAC Payment Gateway Market Volume Share (%), by End User 2024 & 2032
- Figure 15: North America APAC Payment Gateway Market Revenue (Million), by Country 2024 & 2032
- Figure 16: North America APAC Payment Gateway Market Volume (Billion), by Country 2024 & 2032
- Figure 17: North America APAC Payment Gateway Market Revenue Share (%), by Country 2024 & 2032
- Figure 18: North America APAC Payment Gateway Market Volume Share (%), by Country 2024 & 2032
- Figure 19: South America APAC Payment Gateway Market Revenue (Million), by Type 2024 & 2032
- Figure 20: South America APAC Payment Gateway Market Volume (Billion), by Type 2024 & 2032
- Figure 21: South America APAC Payment Gateway Market Revenue Share (%), by Type 2024 & 2032
- Figure 22: South America APAC Payment Gateway Market Volume Share (%), by Type 2024 & 2032
- Figure 23: South America APAC Payment Gateway Market Revenue (Million), by Enterprise 2024 & 2032
- Figure 24: South America APAC Payment Gateway Market Volume (Billion), by Enterprise 2024 & 2032
- Figure 25: South America APAC Payment Gateway Market Revenue Share (%), by Enterprise 2024 & 2032
- Figure 26: South America APAC Payment Gateway Market Volume Share (%), by Enterprise 2024 & 2032
- Figure 27: South America APAC Payment Gateway Market Revenue (Million), by End User 2024 & 2032
- Figure 28: South America APAC Payment Gateway Market Volume (Billion), by End User 2024 & 2032
- Figure 29: South America APAC Payment Gateway Market Revenue Share (%), by End User 2024 & 2032
- Figure 30: South America APAC Payment Gateway Market Volume Share (%), by End User 2024 & 2032
- Figure 31: South America APAC Payment Gateway Market Revenue (Million), by Country 2024 & 2032
- Figure 32: South America APAC Payment Gateway Market Volume (Billion), by Country 2024 & 2032
- Figure 33: South America APAC Payment Gateway Market Revenue Share (%), by Country 2024 & 2032
- Figure 34: South America APAC Payment Gateway Market Volume Share (%), by Country 2024 & 2032
- Figure 35: Europe APAC Payment Gateway Market Revenue (Million), by Type 2024 & 2032
- Figure 36: Europe APAC Payment Gateway Market Volume (Billion), by Type 2024 & 2032
- Figure 37: Europe APAC Payment Gateway Market Revenue Share (%), by Type 2024 & 2032
- Figure 38: Europe APAC Payment Gateway Market Volume Share (%), by Type 2024 & 2032
- Figure 39: Europe APAC Payment Gateway Market Revenue (Million), by Enterprise 2024 & 2032
- Figure 40: Europe APAC Payment Gateway Market Volume (Billion), by Enterprise 2024 & 2032
- Figure 41: Europe APAC Payment Gateway Market Revenue Share (%), by Enterprise 2024 & 2032
- Figure 42: Europe APAC Payment Gateway Market Volume Share (%), by Enterprise 2024 & 2032
- Figure 43: Europe APAC Payment Gateway Market Revenue (Million), by End User 2024 & 2032
- Figure 44: Europe APAC Payment Gateway Market Volume (Billion), by End User 2024 & 2032
- Figure 45: Europe APAC Payment Gateway Market Revenue Share (%), by End User 2024 & 2032
- Figure 46: Europe APAC Payment Gateway Market Volume Share (%), by End User 2024 & 2032
- Figure 47: Europe APAC Payment Gateway Market Revenue (Million), by Country 2024 & 2032
- Figure 48: Europe APAC Payment Gateway Market Volume (Billion), by Country 2024 & 2032
- Figure 49: Europe APAC Payment Gateway Market Revenue Share (%), by Country 2024 & 2032
- Figure 50: Europe APAC Payment Gateway Market Volume Share (%), by Country 2024 & 2032
- Figure 51: Middle East & Africa APAC Payment Gateway Market Revenue (Million), by Type 2024 & 2032
- Figure 52: Middle East & Africa APAC Payment Gateway Market Volume (Billion), by Type 2024 & 2032
- Figure 53: Middle East & Africa APAC Payment Gateway Market Revenue Share (%), by Type 2024 & 2032
- Figure 54: Middle East & Africa APAC Payment Gateway Market Volume Share (%), by Type 2024 & 2032
- Figure 55: Middle East & Africa APAC Payment Gateway Market Revenue (Million), by Enterprise 2024 & 2032
- Figure 56: Middle East & Africa APAC Payment Gateway Market Volume (Billion), by Enterprise 2024 & 2032
- Figure 57: Middle East & Africa APAC Payment Gateway Market Revenue Share (%), by Enterprise 2024 & 2032
- Figure 58: Middle East & Africa APAC Payment Gateway Market Volume Share (%), by Enterprise 2024 & 2032
- Figure 59: Middle East & Africa APAC Payment Gateway Market Revenue (Million), by End User 2024 & 2032
- Figure 60: Middle East & Africa APAC Payment Gateway Market Volume (Billion), by End User 2024 & 2032
- Figure 61: Middle East & Africa APAC Payment Gateway Market Revenue Share (%), by End User 2024 & 2032
- Figure 62: Middle East & Africa APAC Payment Gateway Market Volume Share (%), by End User 2024 & 2032
- Figure 63: Middle East & Africa APAC Payment Gateway Market Revenue (Million), by Country 2024 & 2032
- Figure 64: Middle East & Africa APAC Payment Gateway Market Volume (Billion), by Country 2024 & 2032
- Figure 65: Middle East & Africa APAC Payment Gateway Market Revenue Share (%), by Country 2024 & 2032
- Figure 66: Middle East & Africa APAC Payment Gateway Market Volume Share (%), by Country 2024 & 2032
- Figure 67: Asia Pacific APAC Payment Gateway Market Revenue (Million), by Type 2024 & 2032
- Figure 68: Asia Pacific APAC Payment Gateway Market Volume (Billion), by Type 2024 & 2032
- Figure 69: Asia Pacific APAC Payment Gateway Market Revenue Share (%), by Type 2024 & 2032
- Figure 70: Asia Pacific APAC Payment Gateway Market Volume Share (%), by Type 2024 & 2032
- Figure 71: Asia Pacific APAC Payment Gateway Market Revenue (Million), by Enterprise 2024 & 2032
- Figure 72: Asia Pacific APAC Payment Gateway Market Volume (Billion), by Enterprise 2024 & 2032
- Figure 73: Asia Pacific APAC Payment Gateway Market Revenue Share (%), by Enterprise 2024 & 2032
- Figure 74: Asia Pacific APAC Payment Gateway Market Volume Share (%), by Enterprise 2024 & 2032
- Figure 75: Asia Pacific APAC Payment Gateway Market Revenue (Million), by End User 2024 & 2032
- Figure 76: Asia Pacific APAC Payment Gateway Market Volume (Billion), by End User 2024 & 2032
- Figure 77: Asia Pacific APAC Payment Gateway Market Revenue Share (%), by End User 2024 & 2032
- Figure 78: Asia Pacific APAC Payment Gateway Market Volume Share (%), by End User 2024 & 2032
- Figure 79: Asia Pacific APAC Payment Gateway Market Revenue (Million), by Country 2024 & 2032
- Figure 80: Asia Pacific APAC Payment Gateway Market Volume (Billion), by Country 2024 & 2032
- Figure 81: Asia Pacific APAC Payment Gateway Market Revenue Share (%), by Country 2024 & 2032
- Figure 82: Asia Pacific APAC Payment Gateway Market Volume Share (%), by Country 2024 & 2032
List of Tables
- Table 1: Global APAC Payment Gateway Market Revenue Million Forecast, by Region 2019 & 2032
- Table 2: Global APAC Payment Gateway Market Volume Billion Forecast, by Region 2019 & 2032
- Table 3: Global APAC Payment Gateway Market Revenue Million Forecast, by Type 2019 & 2032
- Table 4: Global APAC Payment Gateway Market Volume Billion Forecast, by Type 2019 & 2032
- Table 5: Global APAC Payment Gateway Market Revenue Million Forecast, by Enterprise 2019 & 2032
- Table 6: Global APAC Payment Gateway Market Volume Billion Forecast, by Enterprise 2019 & 2032
- Table 7: Global APAC Payment Gateway Market Revenue Million Forecast, by End User 2019 & 2032
- Table 8: Global APAC Payment Gateway Market Volume Billion Forecast, by End User 2019 & 2032
- Table 9: Global APAC Payment Gateway Market Revenue Million Forecast, by Region 2019 & 2032
- Table 10: Global APAC Payment Gateway Market Volume Billion Forecast, by Region 2019 & 2032
- Table 11: Global APAC Payment Gateway Market Revenue Million Forecast, by Type 2019 & 2032
- Table 12: Global APAC Payment Gateway Market Volume Billion Forecast, by Type 2019 & 2032
- Table 13: Global APAC Payment Gateway Market Revenue Million Forecast, by Enterprise 2019 & 2032
- Table 14: Global APAC Payment Gateway Market Volume Billion Forecast, by Enterprise 2019 & 2032
- Table 15: Global APAC Payment Gateway Market Revenue Million Forecast, by End User 2019 & 2032
- Table 16: Global APAC Payment Gateway Market Volume Billion Forecast, by End User 2019 & 2032
- Table 17: Global APAC Payment Gateway Market Revenue Million Forecast, by Country 2019 & 2032
- Table 18: Global APAC Payment Gateway Market Volume Billion Forecast, by Country 2019 & 2032
- Table 19: United States APAC Payment Gateway Market Revenue (Million) Forecast, by Application 2019 & 2032
- Table 20: United States APAC Payment Gateway Market Volume (Billion) Forecast, by Application 2019 & 2032
- Table 21: Canada APAC Payment Gateway Market Revenue (Million) Forecast, by Application 2019 & 2032
- Table 22: Canada APAC Payment Gateway Market Volume (Billion) Forecast, by Application 2019 & 2032
- Table 23: Mexico APAC Payment Gateway Market Revenue (Million) Forecast, by Application 2019 & 2032
- Table 24: Mexico APAC Payment Gateway Market Volume (Billion) Forecast, by Application 2019 & 2032
- Table 25: Global APAC Payment Gateway Market Revenue Million Forecast, by Type 2019 & 2032
- Table 26: Global APAC Payment Gateway Market Volume Billion Forecast, by Type 2019 & 2032
- Table 27: Global APAC Payment Gateway Market Revenue Million Forecast, by Enterprise 2019 & 2032
- Table 28: Global APAC Payment Gateway Market Volume Billion Forecast, by Enterprise 2019 & 2032
- Table 29: Global APAC Payment Gateway Market Revenue Million Forecast, by End User 2019 & 2032
- Table 30: Global APAC Payment Gateway Market Volume Billion Forecast, by End User 2019 & 2032
- Table 31: Global APAC Payment Gateway Market Revenue Million Forecast, by Country 2019 & 2032
- Table 32: Global APAC Payment Gateway Market Volume Billion Forecast, by Country 2019 & 2032
- Table 33: Brazil APAC Payment Gateway Market Revenue (Million) Forecast, by Application 2019 & 2032
- Table 34: Brazil APAC Payment Gateway Market Volume (Billion) Forecast, by Application 2019 & 2032
- Table 35: Argentina APAC Payment Gateway Market Revenue (Million) Forecast, by Application 2019 & 2032
- Table 36: Argentina APAC Payment Gateway Market Volume (Billion) Forecast, by Application 2019 & 2032
- Table 37: Rest of South America APAC Payment Gateway Market Revenue (Million) Forecast, by Application 2019 & 2032
- Table 38: Rest of South America APAC Payment Gateway Market Volume (Billion) Forecast, by Application 2019 & 2032
- Table 39: Global APAC Payment Gateway Market Revenue Million Forecast, by Type 2019 & 2032
- Table 40: Global APAC Payment Gateway Market Volume Billion Forecast, by Type 2019 & 2032
- Table 41: Global APAC Payment Gateway Market Revenue Million Forecast, by Enterprise 2019 & 2032
- Table 42: Global APAC Payment Gateway Market Volume Billion Forecast, by Enterprise 2019 & 2032
- Table 43: Global APAC Payment Gateway Market Revenue Million Forecast, by End User 2019 & 2032
- Table 44: Global APAC Payment Gateway Market Volume Billion Forecast, by End User 2019 & 2032
- Table 45: Global APAC Payment Gateway Market Revenue Million Forecast, by Country 2019 & 2032
- Table 46: Global APAC Payment Gateway Market Volume Billion Forecast, by Country 2019 & 2032
- Table 47: United Kingdom APAC Payment Gateway Market Revenue (Million) Forecast, by Application 2019 & 2032
- Table 48: United Kingdom APAC Payment Gateway Market Volume (Billion) Forecast, by Application 2019 & 2032
- Table 49: Germany APAC Payment Gateway Market Revenue (Million) Forecast, by Application 2019 & 2032
- Table 50: Germany APAC Payment Gateway Market Volume (Billion) Forecast, by Application 2019 & 2032
- Table 51: France APAC Payment Gateway Market Revenue (Million) Forecast, by Application 2019 & 2032
- Table 52: France APAC Payment Gateway Market Volume (Billion) Forecast, by Application 2019 & 2032
- Table 53: Italy APAC Payment Gateway Market Revenue (Million) Forecast, by Application 2019 & 2032
- Table 54: Italy APAC Payment Gateway Market Volume (Billion) Forecast, by Application 2019 & 2032
- Table 55: Spain APAC Payment Gateway Market Revenue (Million) Forecast, by Application 2019 & 2032
- Table 56: Spain APAC Payment Gateway Market Volume (Billion) Forecast, by Application 2019 & 2032
- Table 57: Russia APAC Payment Gateway Market Revenue (Million) Forecast, by Application 2019 & 2032
- Table 58: Russia APAC Payment Gateway Market Volume (Billion) Forecast, by Application 2019 & 2032
- Table 59: Benelux APAC Payment Gateway Market Revenue (Million) Forecast, by Application 2019 & 2032
- Table 60: Benelux APAC Payment Gateway Market Volume (Billion) Forecast, by Application 2019 & 2032
- Table 61: Nordics APAC Payment Gateway Market Revenue (Million) Forecast, by Application 2019 & 2032
- Table 62: Nordics APAC Payment Gateway Market Volume (Billion) Forecast, by Application 2019 & 2032
- Table 63: Rest of Europe APAC Payment Gateway Market Revenue (Million) Forecast, by Application 2019 & 2032
- Table 64: Rest of Europe APAC Payment Gateway Market Volume (Billion) Forecast, by Application 2019 & 2032
- Table 65: Global APAC Payment Gateway Market Revenue Million Forecast, by Type 2019 & 2032
- Table 66: Global APAC Payment Gateway Market Volume Billion Forecast, by Type 2019 & 2032
- Table 67: Global APAC Payment Gateway Market Revenue Million Forecast, by Enterprise 2019 & 2032
- Table 68: Global APAC Payment Gateway Market Volume Billion Forecast, by Enterprise 2019 & 2032
- Table 69: Global APAC Payment Gateway Market Revenue Million Forecast, by End User 2019 & 2032
- Table 70: Global APAC Payment Gateway Market Volume Billion Forecast, by End User 2019 & 2032
- Table 71: Global APAC Payment Gateway Market Revenue Million Forecast, by Country 2019 & 2032
- Table 72: Global APAC Payment Gateway Market Volume Billion Forecast, by Country 2019 & 2032
- Table 73: Turkey APAC Payment Gateway Market Revenue (Million) Forecast, by Application 2019 & 2032
- Table 74: Turkey APAC Payment Gateway Market Volume (Billion) Forecast, by Application 2019 & 2032
- Table 75: Israel APAC Payment Gateway Market Revenue (Million) Forecast, by Application 2019 & 2032
- Table 76: Israel APAC Payment Gateway Market Volume (Billion) Forecast, by Application 2019 & 2032
- Table 77: GCC APAC Payment Gateway Market Revenue (Million) Forecast, by Application 2019 & 2032
- Table 78: GCC APAC Payment Gateway Market Volume (Billion) Forecast, by Application 2019 & 2032
- Table 79: North Africa APAC Payment Gateway Market Revenue (Million) Forecast, by Application 2019 & 2032
- Table 80: North Africa APAC Payment Gateway Market Volume (Billion) Forecast, by Application 2019 & 2032
- Table 81: South Africa APAC Payment Gateway Market Revenue (Million) Forecast, by Application 2019 & 2032
- Table 82: South Africa APAC Payment Gateway Market Volume (Billion) Forecast, by Application 2019 & 2032
- Table 83: Rest of Middle East & Africa APAC Payment Gateway Market Revenue (Million) Forecast, by Application 2019 & 2032
- Table 84: Rest of Middle East & Africa APAC Payment Gateway Market Volume (Billion) Forecast, by Application 2019 & 2032
- Table 85: Global APAC Payment Gateway Market Revenue Million Forecast, by Type 2019 & 2032
- Table 86: Global APAC Payment Gateway Market Volume Billion Forecast, by Type 2019 & 2032
- Table 87: Global APAC Payment Gateway Market Revenue Million Forecast, by Enterprise 2019 & 2032
- Table 88: Global APAC Payment Gateway Market Volume Billion Forecast, by Enterprise 2019 & 2032
- Table 89: Global APAC Payment Gateway Market Revenue Million Forecast, by End User 2019 & 2032
- Table 90: Global APAC Payment Gateway Market Volume Billion Forecast, by End User 2019 & 2032
- Table 91: Global APAC Payment Gateway Market Revenue Million Forecast, by Country 2019 & 2032
- Table 92: Global APAC Payment Gateway Market Volume Billion Forecast, by Country 2019 & 2032
- Table 93: China APAC Payment Gateway Market Revenue (Million) Forecast, by Application 2019 & 2032
- Table 94: China APAC Payment Gateway Market Volume (Billion) Forecast, by Application 2019 & 2032
- Table 95: India APAC Payment Gateway Market Revenue (Million) Forecast, by Application 2019 & 2032
- Table 96: India APAC Payment Gateway Market Volume (Billion) Forecast, by Application 2019 & 2032
- Table 97: Japan APAC Payment Gateway Market Revenue (Million) Forecast, by Application 2019 & 2032
- Table 98: Japan APAC Payment Gateway Market Volume (Billion) Forecast, by Application 2019 & 2032
- Table 99: South Korea APAC Payment Gateway Market Revenue (Million) Forecast, by Application 2019 & 2032
- Table 100: South Korea APAC Payment Gateway Market Volume (Billion) Forecast, by Application 2019 & 2032
- Table 101: ASEAN APAC Payment Gateway Market Revenue (Million) Forecast, by Application 2019 & 2032
- Table 102: ASEAN APAC Payment Gateway Market Volume (Billion) Forecast, by Application 2019 & 2032
- Table 103: Oceania APAC Payment Gateway Market Revenue (Million) Forecast, by Application 2019 & 2032
- Table 104: Oceania APAC Payment Gateway Market Volume (Billion) Forecast, by Application 2019 & 2032
- Table 105: Rest of Asia Pacific APAC Payment Gateway Market Revenue (Million) Forecast, by Application 2019 & 2032
- Table 106: Rest of Asia Pacific APAC Payment Gateway Market Volume (Billion) Forecast, by Application 2019 & 2032
Frequently Asked Questions
1. What is the projected Compound Annual Growth Rate (CAGR) of the APAC Payment Gateway Market?
The projected CAGR is approximately 21.89%.
2. Which companies are prominent players in the APAC Payment Gateway Market?
Key companies in the market include PayPal, Stripe, MasterCard, Amazon Pay, PhonePay, GooglePay, RazorPay, AsiaPay, 2Checkout com Inc, Eway*List Not Exhaustive.
3. What are the main segments of the APAC Payment Gateway Market?
The market segments include Type, Enterprise, End User.
4. Can you provide details about the market size?
The market size is estimated to be USD 10.67 Million as of 2022.
5. What are some drivers contributing to market growth?
Increased E-commerce Sales and High Internet Penetration Rate; Increased Demand for Mobile-based Payments; Growing Adoption of Payment Gateways in Retail.
6. What are the notable trends driving market growth?
Growing Use of Payment Gateway in Tavel Industry..
7. Are there any restraints impacting market growth?
Increased E-commerce Sales and High Internet Penetration Rate; Increased Demand for Mobile-based Payments; Growing Adoption of Payment Gateways in Retail.
8. Can you provide examples of recent developments in the market?
May 2024: Mastercard officially rolled out its domestic payment processing services in China. Through its joint venture, Mastercard NetsUnion Information Technology, the company can now process payments made with Mastercard cards issued by Chinese banks. The payment services provider can also accept Mastercard-branded cards from China for international transactions.April 2024: Soft Space, a fintech-as-a-service provider, teamed up with JCB, a prominent international payments brand from Japan, to introduce a payment gateway in Malaysia. The new gateway addresses the surging demand for secure digital transactions by leveraging JCB's expansive global network and Soft Space's advanced technical expertise. Furthermore, Soft Space's API specification empowers acquirers and payment facilitators, enabling retail merchants to tap into JCB's vast network serving over 156 million card members—without needing a direct connection.
9. What pricing options are available for accessing the report?
Pricing options include single-user, multi-user, and enterprise licenses priced at USD 3800, USD 4500, and USD 5800 respectively.
10. Is the market size provided in terms of value or volume?
The market size is provided in terms of value, measured in Million and volume, measured in Billion.
11. Are there any specific market keywords associated with the report?
Yes, the market keyword associated with the report is "APAC Payment Gateway Market," which aids in identifying and referencing the specific market segment covered.
12. How do I determine which pricing option suits my needs best?
The pricing options vary based on user requirements and access needs. Individual users may opt for single-user licenses, while businesses requiring broader access may choose multi-user or enterprise licenses for cost-effective access to the report.
13. Are there any additional resources or data provided in the APAC Payment Gateway Market report?
While the report offers comprehensive insights, it's advisable to review the specific contents or supplementary materials provided to ascertain if additional resources or data are available.
14. How can I stay updated on further developments or reports in the APAC Payment Gateway Market?
To stay informed about further developments, trends, and reports in the APAC Payment Gateway Market, consider subscribing to industry newsletters, following relevant companies and organizations, or regularly checking reputable industry news sources and publications.
Methodology
Step 1 - Identification of Relevant Samples Size from Population Database


Step 2 - Approaches for Defining Global Market Size (Value, Volume* & Price*)

Note*: In applicable scenarios
Step 3 - Data Sources
Primary Research
- Web Analytics
- Survey Reports
- Research Institute
- Latest Research Reports
- Opinion Leaders
Secondary Research
- Annual Reports
- White Paper
- Latest Press Release
- Industry Association
- Paid Database
- Investor Presentations

Step 4 - Data Triangulation
Involves using different sources of information in order to increase the validity of a study
These sources are likely to be stakeholders in a program - participants, other researchers, program staff, other community members, and so on.
Then we put all data in single framework & apply various statistical tools to find out the dynamic on the market.
During the analysis stage, feedback from the stakeholder groups would be compared to determine areas of agreement as well as areas of divergence
