

Key Insights
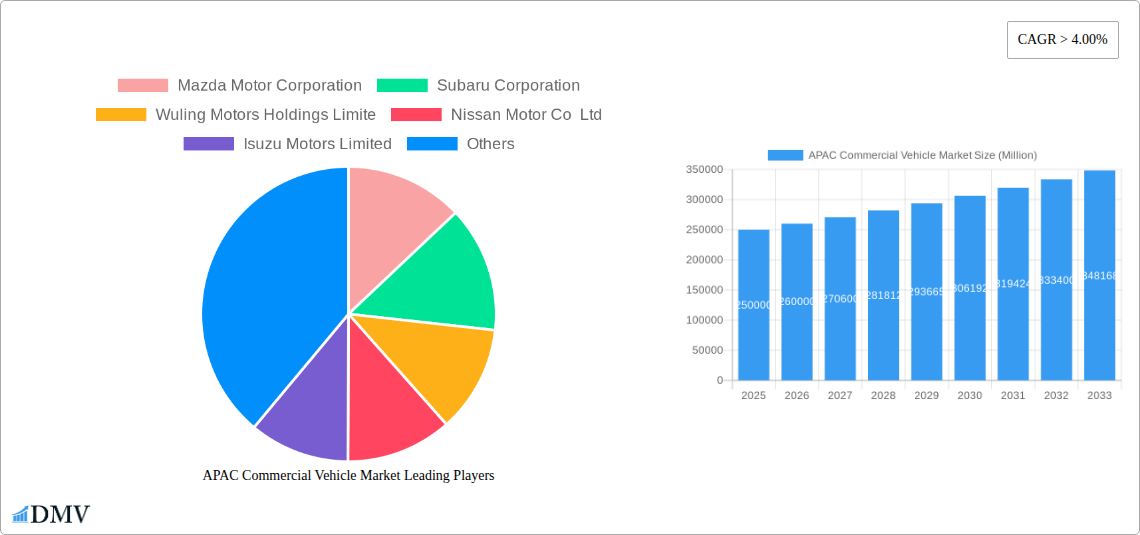
The APAC commercial vehicle market is experiencing robust growth, projected to maintain a Compound Annual Growth Rate (CAGR) exceeding 4% from 2025 to 2033. This expansion is fueled by several key factors. Firstly, the burgeoning e-commerce sector across the region is driving demand for delivery vehicles, particularly in rapidly urbanizing areas like China and India. Simultaneously, infrastructure development projects, including road networks and industrial zones, necessitate a significant increase in construction and logistics vehicles. The rising adoption of hybrid and electric commercial vehicles, driven by governmental emission reduction policies and increasing fuel efficiency concerns, is further boosting market growth. Key players such as Toyota, Hyundai, and Tata Motors are strategically investing in these segments, contributing to technological advancements and competitive pricing. However, economic fluctuations in certain APAC nations, along with potential supply chain disruptions, pose challenges to sustained market growth. Furthermore, the high initial cost of electric and hybrid commercial vehicles could hinder wider adoption, particularly among smaller businesses. Nevertheless, government incentives and supportive financing schemes are gradually mitigating this barrier.
The market segmentation reveals a significant share held by LPG-powered vehicles, especially in countries with established LPG infrastructure. However, the ongoing transition towards hybrid and electric propulsion systems is steadily shifting market dynamics. Commercial vehicle types, such as trucks, buses, and vans, contribute significantly to overall demand, with a notable increase projected in the demand for specialized vehicles like refrigerated trucks, due to the growth of the cold chain logistics industry. Specific markets like China and India, with their vast populations and robust economic activity, are driving a considerable portion of the overall APAC market, while other nations such as Australia, Japan, and South Korea contribute significantly, albeit with varying growth trajectories based on individual economic conditions and government regulations. The competitive landscape is highly dynamic, featuring both established global players and strong regional manufacturers.
APAC Commercial Vehicle Market: A Comprehensive Report (2019-2033)
This insightful report provides a comprehensive analysis of the Asia-Pacific (APAC) commercial vehicle market, covering the period 2019-2033. It delves deep into market dynamics, competitive landscapes, technological advancements, and future growth projections, offering invaluable insights for stakeholders across the automotive industry. The report utilizes a robust methodology, combining historical data (2019-2024), base year (2025), and forecast data (2025-2033) to present a clear and actionable outlook. Key segments analyzed include LPG vehicles, hybrid and electric commercial vehicles, encompassing diverse vehicle types across major APAC countries.
APAC Commercial Vehicle Market Composition & Trends
This section evaluates the APAC commercial vehicle market's structure, identifying key trends influencing its evolution. We analyze market concentration, revealing the market share distribution among leading players like Toyota, Hyundai, and Isuzu. Furthermore, the report examines the role of innovation, including the rising adoption of electric and hybrid vehicles, and the impact of evolving regulatory landscapes on market dynamics. The analysis also includes a deep dive into substitute products, end-user profiles, and M&A activities, presenting quantitative data on deal values (xx Million) and their impact on market consolidation.
- Market Concentration: The market is moderately concentrated, with the top 5 players holding approximately xx% market share in 2024.
- Innovation Catalysts: Stringent emission norms and government incentives are driving the adoption of electric and hybrid commercial vehicles.
- Regulatory Landscape: Varying regulations across APAC nations create both opportunities and challenges for manufacturers.
- Substitute Products: Alternative transportation solutions, such as rail and waterways, pose a competitive threat to certain commercial vehicle segments.
- End-User Profiles: The report segments end-users into logistics, construction, and transportation sectors, analyzing their distinct needs and preferences.
- M&A Activities: The report details significant M&A transactions in the APAC commercial vehicle market, with a total deal value of approximately xx Million during the historical period.
APAC Commercial Vehicle Market Industry Evolution
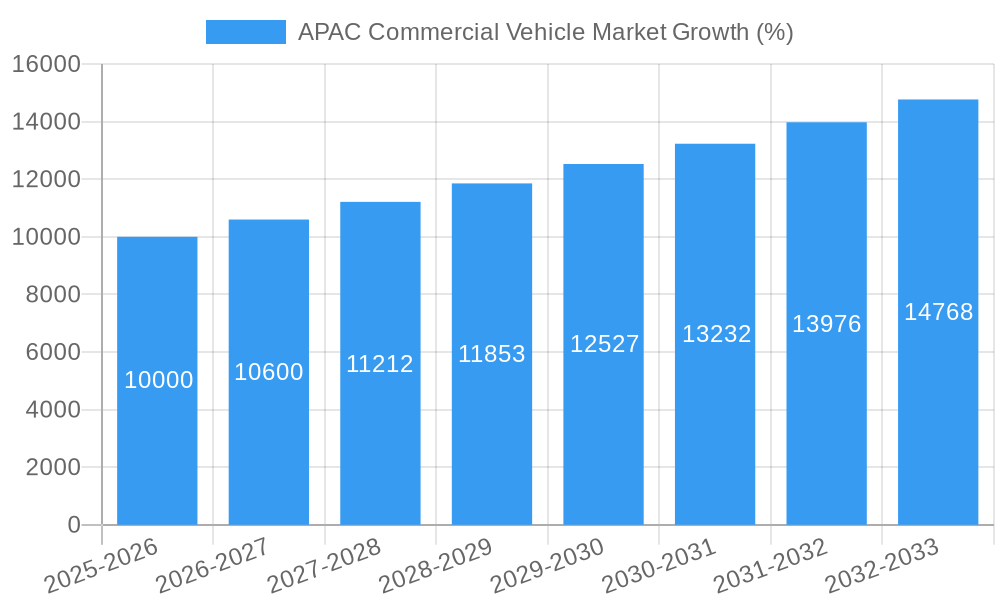
This section traces the evolution of the APAC commercial vehicle market, analyzing its growth trajectory from 2019 to 2033. We examine the impact of technological advancements, such as the introduction of advanced driver-assistance systems (ADAS) and autonomous driving capabilities, on market growth. The analysis also considers shifting consumer demands, focusing on factors like fuel efficiency, safety features, and environmental concerns, as well as the impact of macroeconomic factors on market dynamics. The report projects a Compound Annual Growth Rate (CAGR) of xx% during the forecast period (2025-2033), driven by factors like infrastructural development and rising e-commerce activities. Specific data points, such as adoption rates for electric commercial vehicles and growth rates for specific vehicle segments, will be detailed within the report.
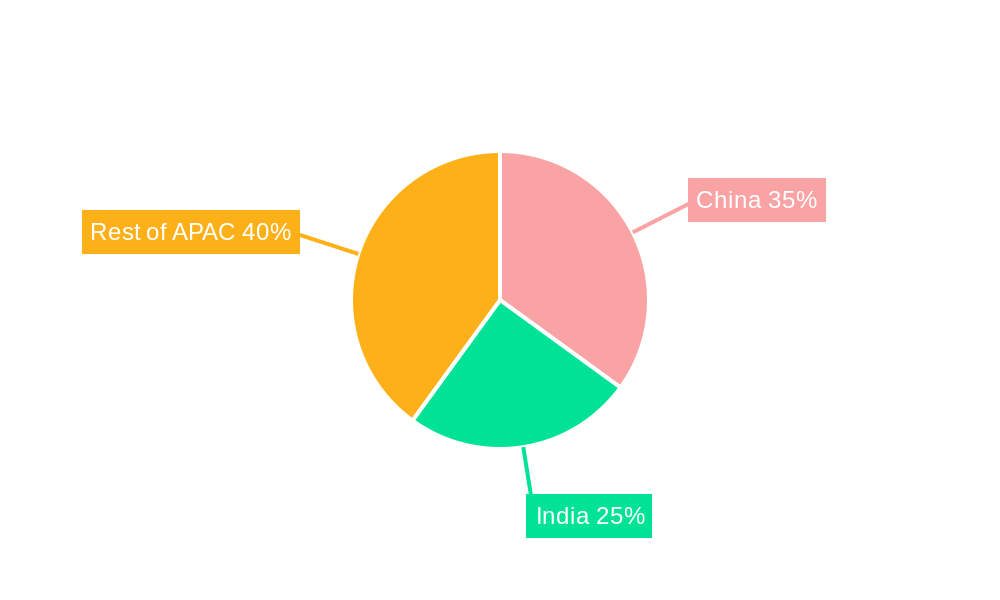
Leading Regions, Countries, or Segments in APAC Commercial Vehicle Market
China, India, and Japan emerge as dominant markets within the APAC region. This section provides an in-depth analysis of the leading regions, countries, and segments, exploring the factors driving their dominance. The analysis includes LPG, hybrid and electric vehicles, across diverse vehicle types and across key APAC countries (Australia, China, India, Indonesia, Japan, Malaysia, South Korea, Thailand, and Rest-of-APAC).
- Key Drivers for China: Massive infrastructure projects, expanding e-commerce, and government support for electric vehicle adoption.
- Key Drivers for India: Rapid economic growth, increasing urbanization, and a burgeoning logistics sector.
- Key Drivers for Japan: Technological advancements, high vehicle quality standards, and a well-established automotive industry.
- Hybrid and Electric Vehicles (HEV): Government regulations and consumer preference for eco-friendly options are driving growth in this segment.
- LPG Vehicles: LPG remains a significant fuel source in certain regions due to cost-effectiveness and availability.
The report provides a detailed breakdown of market share by country and segment, supporting the analysis of dominance factors.
APAC Commercial Vehicle Market Product Innovations
The APAC commercial vehicle market is witnessing significant product innovations, including the integration of advanced technologies like telematics, connected vehicle systems, and improved fuel efficiency features. These innovations aim to enhance operational efficiency, safety, and driver comfort. Manufacturers are focusing on developing vehicles with longer service life, reduced maintenance costs, and improved payload capacity to cater to specific end-user needs. The adoption of lightweight materials and advanced engine technologies are also key trends shaping product development.
Propelling Factors for APAC Commercial Vehicle Market Growth
Several factors contribute to the growth of the APAC commercial vehicle market. Government initiatives promoting infrastructure development and the expansion of logistics networks are creating strong demand. Technological advancements, such as the development of fuel-efficient engines and alternative fuel vehicles, are also driving market expansion. Furthermore, increasing urbanization and rising e-commerce activities are contributing to the growth in demand for commercial vehicles.
Obstacles in the APAC Commercial Vehicle Market
The APAC commercial vehicle market faces several challenges. Stringent emission norms and fluctuating fuel prices pose significant hurdles for manufacturers. Supply chain disruptions caused by global events can impact production and availability. Intense competition from both domestic and international players adds further complexity. These factors can influence pricing, profitability, and overall market growth.
Future Opportunities in APAC Commercial Vehicle Market
Emerging opportunities exist in the APAC commercial vehicle market, primarily in the expanding electric vehicle segment. The development of charging infrastructure and the increasing availability of battery technologies are opening up new avenues for growth. Furthermore, the rise of shared mobility services and the growing demand for last-mile delivery solutions present potential opportunities for innovative business models and technological advancements.
Major Players in the APAC Commercial Vehicle Market Ecosystem
- Mazda Motor Corporation
- Subaru Corporation
- Wuling Motors Holdings Limite
- Nissan Motor Co Ltd
- Isuzu Motors Limited
- General Motors Company
- Anhui Ankai Automobile Co Ltd
- Dongfeng Motor Corporation
- Daihatsu Motor Co Ltd
- Tata Motors Limited
- Renault-Nissan-Mitsubishi Alliance
- Hyundai Motor Company
- Kia Corporation
- Toyota Motor Corporation
- Honda Motor Co Ltd
- Great Wall Motor Company Ltd (GWM)
- Mitsubishi Motors Corporation
- Suzuki Motor Corporation
- Ford Motor Company
Key Developments in APAC Commercial Vehicle Market Industry
- August 2023: General Motors will launch an all-electric Cadillac Escalade in late 2024. This signifies a significant push towards electric vehicle adoption in the luxury segment.
- August 2023: General Motors doubles down on plans for an electric future in the Middle East. This highlights the strategic importance of the region for GM's electrification strategy.
- August 2023: Toyota Kirloskar Motor launched the all-new MPV Vellfire strong hybrid electric vehicle (SHEV) for a starting price of INR 11.99 Million and going to INR 12.99 Million. This underscores the increasing popularity of hybrid vehicles in the APAC market.
Strategic APAC Commercial Vehicle Market Forecast
The APAC commercial vehicle market is poised for substantial growth in the coming years, driven by factors like infrastructure development, economic expansion, and the increasing adoption of electric and hybrid vehicles. Government policies promoting sustainable transportation and technological advancements will further stimulate market expansion. The market is expected to witness strong growth across various segments, presenting significant opportunities for industry players.
APAC Commercial Vehicle Market Segmentation
-
1. Vehicle Type
-
1.1. Commercial Vehicles
- 1.1.1. Buses
- 1.1.2. Heavy-duty Commercial Trucks
- 1.1.3. Light Commercial Pick-up Trucks
- 1.1.4. Light Commercial Vans
- 1.1.5. Medium-duty Commercial Trucks
-
1.1. Commercial Vehicles
-
2. Propulsion Type
-
2.1. Hybrid and Electric Vehicles
-
2.1.1. By Fuel Category
- 2.1.1.1. BEV
- 2.1.1.2. FCEV
- 2.1.1.3. HEV
- 2.1.1.4. PHEV
-
2.1.1. By Fuel Category
-
2.2. ICE
- 2.2.1. CNG
- 2.2.2. Diesel
- 2.2.3. Gasoline
- 2.2.4. LPG
-
2.1. Hybrid and Electric Vehicles
APAC Commercial Vehicle Market Segmentation By Geography
-
1. North America
- 1.1. United States
- 1.2. Canada
- 1.3. Mexico
-
2. South America
- 2.1. Brazil
- 2.2. Argentina
- 2.3. Rest of South America
-
3. Europe
- 3.1. United Kingdom
- 3.2. Germany
- 3.3. France
- 3.4. Italy
- 3.5. Spain
- 3.6. Russia
- 3.7. Benelux
- 3.8. Nordics
- 3.9. Rest of Europe
-
4. Middle East & Africa
- 4.1. Turkey
- 4.2. Israel
- 4.3. GCC
- 4.4. North Africa
- 4.5. South Africa
- 4.6. Rest of Middle East & Africa
-
5. Asia Pacific
- 5.1. China
- 5.2. India
- 5.3. Japan
- 5.4. South Korea
- 5.5. ASEAN
- 5.6. Oceania
- 5.7. Rest of Asia Pacific
APAC Commercial Vehicle Market REPORT HIGHLIGHTS
| Aspects | Details |
|---|---|
| Study Period | 2019-2033 |
| Base Year | 2024 |
| Estimated Year | 2025 |
| Forecast Period | 2025-2033 |
| Historical Period | 2019-2024 |
| Growth Rate | CAGR of > 4.00% from 2019-2033 |
| Segmentation |
|
Table of Contents
- 1. Introduction
- 1.1. Research Scope
- 1.2. Market Segmentation
- 1.3. Research Methodology
- 1.4. Definitions and Assumptions
- 2. Executive Summary
- 2.1. Introduction
- 3. Market Dynamics
- 3.1. Introduction
- 3.2. Market Drivers
- 3.2.1. Surge in Trend of Yacht Tourism
- 3.3. Market Restrains
- 3.3.1. Higher Rentals During Peak Season
- 3.4. Market Trends
- 3.4.1. OTHER KEY INDUSTRY TRENDS COVERED IN THE REPORT
- 4. Market Factor Analysis
- 4.1. Porters Five Forces
- 4.2. Supply/Value Chain
- 4.3. PESTEL analysis
- 4.4. Market Entropy
- 4.5. Patent/Trademark Analysis
- 5. Global APAC Commercial Vehicle Market Analysis, Insights and Forecast, 2019-2031
- 5.1. Market Analysis, Insights and Forecast - by Vehicle Type
- 5.1.1. Commercial Vehicles
- 5.1.1.1. Buses
- 5.1.1.2. Heavy-duty Commercial Trucks
- 5.1.1.3. Light Commercial Pick-up Trucks
- 5.1.1.4. Light Commercial Vans
- 5.1.1.5. Medium-duty Commercial Trucks
- 5.1.1. Commercial Vehicles
- 5.2. Market Analysis, Insights and Forecast - by Propulsion Type
- 5.2.1. Hybrid and Electric Vehicles
- 5.2.1.1. By Fuel Category
- 5.2.1.1.1. BEV
- 5.2.1.1.2. FCEV
- 5.2.1.1.3. HEV
- 5.2.1.1.4. PHEV
- 5.2.1.1. By Fuel Category
- 5.2.2. ICE
- 5.2.2.1. CNG
- 5.2.2.2. Diesel
- 5.2.2.3. Gasoline
- 5.2.2.4. LPG
- 5.2.1. Hybrid and Electric Vehicles
- 5.3. Market Analysis, Insights and Forecast - by Region
- 5.3.1. North America
- 5.3.2. South America
- 5.3.3. Europe
- 5.3.4. Middle East & Africa
- 5.3.5. Asia Pacific
- 5.1. Market Analysis, Insights and Forecast - by Vehicle Type
- 6. North America APAC Commercial Vehicle Market Analysis, Insights and Forecast, 2019-2031
- 6.1. Market Analysis, Insights and Forecast - by Vehicle Type
- 6.1.1. Commercial Vehicles
- 6.1.1.1. Buses
- 6.1.1.2. Heavy-duty Commercial Trucks
- 6.1.1.3. Light Commercial Pick-up Trucks
- 6.1.1.4. Light Commercial Vans
- 6.1.1.5. Medium-duty Commercial Trucks
- 6.1.1. Commercial Vehicles
- 6.2. Market Analysis, Insights and Forecast - by Propulsion Type
- 6.2.1. Hybrid and Electric Vehicles
- 6.2.1.1. By Fuel Category
- 6.2.1.1.1. BEV
- 6.2.1.1.2. FCEV
- 6.2.1.1.3. HEV
- 6.2.1.1.4. PHEV
- 6.2.1.1. By Fuel Category
- 6.2.2. ICE
- 6.2.2.1. CNG
- 6.2.2.2. Diesel
- 6.2.2.3. Gasoline
- 6.2.2.4. LPG
- 6.2.1. Hybrid and Electric Vehicles
- 6.1. Market Analysis, Insights and Forecast - by Vehicle Type
- 7. South America APAC Commercial Vehicle Market Analysis, Insights and Forecast, 2019-2031
- 7.1. Market Analysis, Insights and Forecast - by Vehicle Type
- 7.1.1. Commercial Vehicles
- 7.1.1.1. Buses
- 7.1.1.2. Heavy-duty Commercial Trucks
- 7.1.1.3. Light Commercial Pick-up Trucks
- 7.1.1.4. Light Commercial Vans
- 7.1.1.5. Medium-duty Commercial Trucks
- 7.1.1. Commercial Vehicles
- 7.2. Market Analysis, Insights and Forecast - by Propulsion Type
- 7.2.1. Hybrid and Electric Vehicles
- 7.2.1.1. By Fuel Category
- 7.2.1.1.1. BEV
- 7.2.1.1.2. FCEV
- 7.2.1.1.3. HEV
- 7.2.1.1.4. PHEV
- 7.2.1.1. By Fuel Category
- 7.2.2. ICE
- 7.2.2.1. CNG
- 7.2.2.2. Diesel
- 7.2.2.3. Gasoline
- 7.2.2.4. LPG
- 7.2.1. Hybrid and Electric Vehicles
- 7.1. Market Analysis, Insights and Forecast - by Vehicle Type
- 8. Europe APAC Commercial Vehicle Market Analysis, Insights and Forecast, 2019-2031
- 8.1. Market Analysis, Insights and Forecast - by Vehicle Type
- 8.1.1. Commercial Vehicles
- 8.1.1.1. Buses
- 8.1.1.2. Heavy-duty Commercial Trucks
- 8.1.1.3. Light Commercial Pick-up Trucks
- 8.1.1.4. Light Commercial Vans
- 8.1.1.5. Medium-duty Commercial Trucks
- 8.1.1. Commercial Vehicles
- 8.2. Market Analysis, Insights and Forecast - by Propulsion Type
- 8.2.1. Hybrid and Electric Vehicles
- 8.2.1.1. By Fuel Category
- 8.2.1.1.1. BEV
- 8.2.1.1.2. FCEV
- 8.2.1.1.3. HEV
- 8.2.1.1.4. PHEV
- 8.2.1.1. By Fuel Category
- 8.2.2. ICE
- 8.2.2.1. CNG
- 8.2.2.2. Diesel
- 8.2.2.3. Gasoline
- 8.2.2.4. LPG
- 8.2.1. Hybrid and Electric Vehicles
- 8.1. Market Analysis, Insights and Forecast - by Vehicle Type
- 9. Middle East & Africa APAC Commercial Vehicle Market Analysis, Insights and Forecast, 2019-2031
- 9.1. Market Analysis, Insights and Forecast - by Vehicle Type
- 9.1.1. Commercial Vehicles
- 9.1.1.1. Buses
- 9.1.1.2. Heavy-duty Commercial Trucks
- 9.1.1.3. Light Commercial Pick-up Trucks
- 9.1.1.4. Light Commercial Vans
- 9.1.1.5. Medium-duty Commercial Trucks
- 9.1.1. Commercial Vehicles
- 9.2. Market Analysis, Insights and Forecast - by Propulsion Type
- 9.2.1. Hybrid and Electric Vehicles
- 9.2.1.1. By Fuel Category
- 9.2.1.1.1. BEV
- 9.2.1.1.2. FCEV
- 9.2.1.1.3. HEV
- 9.2.1.1.4. PHEV
- 9.2.1.1. By Fuel Category
- 9.2.2. ICE
- 9.2.2.1. CNG
- 9.2.2.2. Diesel
- 9.2.2.3. Gasoline
- 9.2.2.4. LPG
- 9.2.1. Hybrid and Electric Vehicles
- 9.1. Market Analysis, Insights and Forecast - by Vehicle Type
- 10. Asia Pacific APAC Commercial Vehicle Market Analysis, Insights and Forecast, 2019-2031
- 10.1. Market Analysis, Insights and Forecast - by Vehicle Type
- 10.1.1. Commercial Vehicles
- 10.1.1.1. Buses
- 10.1.1.2. Heavy-duty Commercial Trucks
- 10.1.1.3. Light Commercial Pick-up Trucks
- 10.1.1.4. Light Commercial Vans
- 10.1.1.5. Medium-duty Commercial Trucks
- 10.1.1. Commercial Vehicles
- 10.2. Market Analysis, Insights and Forecast - by Propulsion Type
- 10.2.1. Hybrid and Electric Vehicles
- 10.2.1.1. By Fuel Category
- 10.2.1.1.1. BEV
- 10.2.1.1.2. FCEV
- 10.2.1.1.3. HEV
- 10.2.1.1.4. PHEV
- 10.2.1.1. By Fuel Category
- 10.2.2. ICE
- 10.2.2.1. CNG
- 10.2.2.2. Diesel
- 10.2.2.3. Gasoline
- 10.2.2.4. LPG
- 10.2.1. Hybrid and Electric Vehicles
- 10.1. Market Analysis, Insights and Forecast - by Vehicle Type
- 11. Competitive Analysis
- 11.1. Global Market Share Analysis 2024
- 11.2. Company Profiles
- 11.2.1 Mazda Motor Corporation
- 11.2.1.1. Overview
- 11.2.1.2. Products
- 11.2.1.3. SWOT Analysis
- 11.2.1.4. Recent Developments
- 11.2.1.5. Financials (Based on Availability)
- 11.2.2 Subaru Corporation
- 11.2.2.1. Overview
- 11.2.2.2. Products
- 11.2.2.3. SWOT Analysis
- 11.2.2.4. Recent Developments
- 11.2.2.5. Financials (Based on Availability)
- 11.2.3 Wuling Motors Holdings Limite
- 11.2.3.1. Overview
- 11.2.3.2. Products
- 11.2.3.3. SWOT Analysis
- 11.2.3.4. Recent Developments
- 11.2.3.5. Financials (Based on Availability)
- 11.2.4 Nissan Motor Co Ltd
- 11.2.4.1. Overview
- 11.2.4.2. Products
- 11.2.4.3. SWOT Analysis
- 11.2.4.4. Recent Developments
- 11.2.4.5. Financials (Based on Availability)
- 11.2.5 Isuzu Motors Limited
- 11.2.5.1. Overview
- 11.2.5.2. Products
- 11.2.5.3. SWOT Analysis
- 11.2.5.4. Recent Developments
- 11.2.5.5. Financials (Based on Availability)
- 11.2.6 General Motors Company
- 11.2.6.1. Overview
- 11.2.6.2. Products
- 11.2.6.3. SWOT Analysis
- 11.2.6.4. Recent Developments
- 11.2.6.5. Financials (Based on Availability)
- 11.2.7 Anhui Ankai Automobile Co Ltd
- 11.2.7.1. Overview
- 11.2.7.2. Products
- 11.2.7.3. SWOT Analysis
- 11.2.7.4. Recent Developments
- 11.2.7.5. Financials (Based on Availability)
- 11.2.8 Dongfeng Motor Corporation
- 11.2.8.1. Overview
- 11.2.8.2. Products
- 11.2.8.3. SWOT Analysis
- 11.2.8.4. Recent Developments
- 11.2.8.5. Financials (Based on Availability)
- 11.2.9 Daihatsu Motor Co Ltd
- 11.2.9.1. Overview
- 11.2.9.2. Products
- 11.2.9.3. SWOT Analysis
- 11.2.9.4. Recent Developments
- 11.2.9.5. Financials (Based on Availability)
- 11.2.10 Tata Motors Limited
- 11.2.10.1. Overview
- 11.2.10.2. Products
- 11.2.10.3. SWOT Analysis
- 11.2.10.4. Recent Developments
- 11.2.10.5. Financials (Based on Availability)
- 11.2.11 Renault-Nissan-Mitsubishi Alliance
- 11.2.11.1. Overview
- 11.2.11.2. Products
- 11.2.11.3. SWOT Analysis
- 11.2.11.4. Recent Developments
- 11.2.11.5. Financials (Based on Availability)
- 11.2.12 Hyundai Motor Company
- 11.2.12.1. Overview
- 11.2.12.2. Products
- 11.2.12.3. SWOT Analysis
- 11.2.12.4. Recent Developments
- 11.2.12.5. Financials (Based on Availability)
- 11.2.13 Kia Corporation
- 11.2.13.1. Overview
- 11.2.13.2. Products
- 11.2.13.3. SWOT Analysis
- 11.2.13.4. Recent Developments
- 11.2.13.5. Financials (Based on Availability)
- 11.2.14 Toyota Motor Corporation
- 11.2.14.1. Overview
- 11.2.14.2. Products
- 11.2.14.3. SWOT Analysis
- 11.2.14.4. Recent Developments
- 11.2.14.5. Financials (Based on Availability)
- 11.2.15 Honda Motor Co Ltd
- 11.2.15.1. Overview
- 11.2.15.2. Products
- 11.2.15.3. SWOT Analysis
- 11.2.15.4. Recent Developments
- 11.2.15.5. Financials (Based on Availability)
- 11.2.16 Great Wall Motor Company Ltd (GWM)
- 11.2.16.1. Overview
- 11.2.16.2. Products
- 11.2.16.3. SWOT Analysis
- 11.2.16.4. Recent Developments
- 11.2.16.5. Financials (Based on Availability)
- 11.2.17 Mitsubishi Motors Corporation
- 11.2.17.1. Overview
- 11.2.17.2. Products
- 11.2.17.3. SWOT Analysis
- 11.2.17.4. Recent Developments
- 11.2.17.5. Financials (Based on Availability)
- 11.2.18 Suzuki Motor Corporation
- 11.2.18.1. Overview
- 11.2.18.2. Products
- 11.2.18.3. SWOT Analysis
- 11.2.18.4. Recent Developments
- 11.2.18.5. Financials (Based on Availability)
- 11.2.19 Ford Motor Company
- 11.2.19.1. Overview
- 11.2.19.2. Products
- 11.2.19.3. SWOT Analysis
- 11.2.19.4. Recent Developments
- 11.2.19.5. Financials (Based on Availability)
- 11.2.1 Mazda Motor Corporation
List of Figures
- Figure 1: Global APAC Commercial Vehicle Market Revenue Breakdown (Million, %) by Region 2024 & 2032
- Figure 2: North America APAC Commercial Vehicle Market Revenue (Million), by Vehicle Type 2024 & 2032
- Figure 3: North America APAC Commercial Vehicle Market Revenue Share (%), by Vehicle Type 2024 & 2032
- Figure 4: North America APAC Commercial Vehicle Market Revenue (Million), by Propulsion Type 2024 & 2032
- Figure 5: North America APAC Commercial Vehicle Market Revenue Share (%), by Propulsion Type 2024 & 2032
- Figure 6: North America APAC Commercial Vehicle Market Revenue (Million), by Country 2024 & 2032
- Figure 7: North America APAC Commercial Vehicle Market Revenue Share (%), by Country 2024 & 2032
- Figure 8: South America APAC Commercial Vehicle Market Revenue (Million), by Vehicle Type 2024 & 2032
- Figure 9: South America APAC Commercial Vehicle Market Revenue Share (%), by Vehicle Type 2024 & 2032
- Figure 10: South America APAC Commercial Vehicle Market Revenue (Million), by Propulsion Type 2024 & 2032
- Figure 11: South America APAC Commercial Vehicle Market Revenue Share (%), by Propulsion Type 2024 & 2032
- Figure 12: South America APAC Commercial Vehicle Market Revenue (Million), by Country 2024 & 2032
- Figure 13: South America APAC Commercial Vehicle Market Revenue Share (%), by Country 2024 & 2032
- Figure 14: Europe APAC Commercial Vehicle Market Revenue (Million), by Vehicle Type 2024 & 2032
- Figure 15: Europe APAC Commercial Vehicle Market Revenue Share (%), by Vehicle Type 2024 & 2032
- Figure 16: Europe APAC Commercial Vehicle Market Revenue (Million), by Propulsion Type 2024 & 2032
- Figure 17: Europe APAC Commercial Vehicle Market Revenue Share (%), by Propulsion Type 2024 & 2032
- Figure 18: Europe APAC Commercial Vehicle Market Revenue (Million), by Country 2024 & 2032
- Figure 19: Europe APAC Commercial Vehicle Market Revenue Share (%), by Country 2024 & 2032
- Figure 20: Middle East & Africa APAC Commercial Vehicle Market Revenue (Million), by Vehicle Type 2024 & 2032
- Figure 21: Middle East & Africa APAC Commercial Vehicle Market Revenue Share (%), by Vehicle Type 2024 & 2032
- Figure 22: Middle East & Africa APAC Commercial Vehicle Market Revenue (Million), by Propulsion Type 2024 & 2032
- Figure 23: Middle East & Africa APAC Commercial Vehicle Market Revenue Share (%), by Propulsion Type 2024 & 2032
- Figure 24: Middle East & Africa APAC Commercial Vehicle Market Revenue (Million), by Country 2024 & 2032
- Figure 25: Middle East & Africa APAC Commercial Vehicle Market Revenue Share (%), by Country 2024 & 2032
- Figure 26: Asia Pacific APAC Commercial Vehicle Market Revenue (Million), by Vehicle Type 2024 & 2032
- Figure 27: Asia Pacific APAC Commercial Vehicle Market Revenue Share (%), by Vehicle Type 2024 & 2032
- Figure 28: Asia Pacific APAC Commercial Vehicle Market Revenue (Million), by Propulsion Type 2024 & 2032
- Figure 29: Asia Pacific APAC Commercial Vehicle Market Revenue Share (%), by Propulsion Type 2024 & 2032
- Figure 30: Asia Pacific APAC Commercial Vehicle Market Revenue (Million), by Country 2024 & 2032
- Figure 31: Asia Pacific APAC Commercial Vehicle Market Revenue Share (%), by Country 2024 & 2032
List of Tables
- Table 1: Global APAC Commercial Vehicle Market Revenue Million Forecast, by Region 2019 & 2032
- Table 2: Global APAC Commercial Vehicle Market Revenue Million Forecast, by Vehicle Type 2019 & 2032
- Table 3: Global APAC Commercial Vehicle Market Revenue Million Forecast, by Propulsion Type 2019 & 2032
- Table 4: Global APAC Commercial Vehicle Market Revenue Million Forecast, by Region 2019 & 2032
- Table 5: Global APAC Commercial Vehicle Market Revenue Million Forecast, by Vehicle Type 2019 & 2032
- Table 6: Global APAC Commercial Vehicle Market Revenue Million Forecast, by Propulsion Type 2019 & 2032
- Table 7: Global APAC Commercial Vehicle Market Revenue Million Forecast, by Country 2019 & 2032
- Table 8: United States APAC Commercial Vehicle Market Revenue (Million) Forecast, by Application 2019 & 2032
- Table 9: Canada APAC Commercial Vehicle Market Revenue (Million) Forecast, by Application 2019 & 2032
- Table 10: Mexico APAC Commercial Vehicle Market Revenue (Million) Forecast, by Application 2019 & 2032
- Table 11: Global APAC Commercial Vehicle Market Revenue Million Forecast, by Vehicle Type 2019 & 2032
- Table 12: Global APAC Commercial Vehicle Market Revenue Million Forecast, by Propulsion Type 2019 & 2032
- Table 13: Global APAC Commercial Vehicle Market Revenue Million Forecast, by Country 2019 & 2032
- Table 14: Brazil APAC Commercial Vehicle Market Revenue (Million) Forecast, by Application 2019 & 2032
- Table 15: Argentina APAC Commercial Vehicle Market Revenue (Million) Forecast, by Application 2019 & 2032
- Table 16: Rest of South America APAC Commercial Vehicle Market Revenue (Million) Forecast, by Application 2019 & 2032
- Table 17: Global APAC Commercial Vehicle Market Revenue Million Forecast, by Vehicle Type 2019 & 2032
- Table 18: Global APAC Commercial Vehicle Market Revenue Million Forecast, by Propulsion Type 2019 & 2032
- Table 19: Global APAC Commercial Vehicle Market Revenue Million Forecast, by Country 2019 & 2032
- Table 20: United Kingdom APAC Commercial Vehicle Market Revenue (Million) Forecast, by Application 2019 & 2032
- Table 21: Germany APAC Commercial Vehicle Market Revenue (Million) Forecast, by Application 2019 & 2032
- Table 22: France APAC Commercial Vehicle Market Revenue (Million) Forecast, by Application 2019 & 2032
- Table 23: Italy APAC Commercial Vehicle Market Revenue (Million) Forecast, by Application 2019 & 2032
- Table 24: Spain APAC Commercial Vehicle Market Revenue (Million) Forecast, by Application 2019 & 2032
- Table 25: Russia APAC Commercial Vehicle Market Revenue (Million) Forecast, by Application 2019 & 2032
- Table 26: Benelux APAC Commercial Vehicle Market Revenue (Million) Forecast, by Application 2019 & 2032
- Table 27: Nordics APAC Commercial Vehicle Market Revenue (Million) Forecast, by Application 2019 & 2032
- Table 28: Rest of Europe APAC Commercial Vehicle Market Revenue (Million) Forecast, by Application 2019 & 2032
- Table 29: Global APAC Commercial Vehicle Market Revenue Million Forecast, by Vehicle Type 2019 & 2032
- Table 30: Global APAC Commercial Vehicle Market Revenue Million Forecast, by Propulsion Type 2019 & 2032
- Table 31: Global APAC Commercial Vehicle Market Revenue Million Forecast, by Country 2019 & 2032
- Table 32: Turkey APAC Commercial Vehicle Market Revenue (Million) Forecast, by Application 2019 & 2032
- Table 33: Israel APAC Commercial Vehicle Market Revenue (Million) Forecast, by Application 2019 & 2032
- Table 34: GCC APAC Commercial Vehicle Market Revenue (Million) Forecast, by Application 2019 & 2032
- Table 35: North Africa APAC Commercial Vehicle Market Revenue (Million) Forecast, by Application 2019 & 2032
- Table 36: South Africa APAC Commercial Vehicle Market Revenue (Million) Forecast, by Application 2019 & 2032
- Table 37: Rest of Middle East & Africa APAC Commercial Vehicle Market Revenue (Million) Forecast, by Application 2019 & 2032
- Table 38: Global APAC Commercial Vehicle Market Revenue Million Forecast, by Vehicle Type 2019 & 2032
- Table 39: Global APAC Commercial Vehicle Market Revenue Million Forecast, by Propulsion Type 2019 & 2032
- Table 40: Global APAC Commercial Vehicle Market Revenue Million Forecast, by Country 2019 & 2032
- Table 41: China APAC Commercial Vehicle Market Revenue (Million) Forecast, by Application 2019 & 2032
- Table 42: India APAC Commercial Vehicle Market Revenue (Million) Forecast, by Application 2019 & 2032
- Table 43: Japan APAC Commercial Vehicle Market Revenue (Million) Forecast, by Application 2019 & 2032
- Table 44: South Korea APAC Commercial Vehicle Market Revenue (Million) Forecast, by Application 2019 & 2032
- Table 45: ASEAN APAC Commercial Vehicle Market Revenue (Million) Forecast, by Application 2019 & 2032
- Table 46: Oceania APAC Commercial Vehicle Market Revenue (Million) Forecast, by Application 2019 & 2032
- Table 47: Rest of Asia Pacific APAC Commercial Vehicle Market Revenue (Million) Forecast, by Application 2019 & 2032
Frequently Asked Questions
1. What is the projected Compound Annual Growth Rate (CAGR) of the APAC Commercial Vehicle Market?
The projected CAGR is approximately > 4.00%.
2. Which companies are prominent players in the APAC Commercial Vehicle Market?
Key companies in the market include Mazda Motor Corporation, Subaru Corporation, Wuling Motors Holdings Limite, Nissan Motor Co Ltd, Isuzu Motors Limited, General Motors Company, Anhui Ankai Automobile Co Ltd, Dongfeng Motor Corporation, Daihatsu Motor Co Ltd, Tata Motors Limited, Renault-Nissan-Mitsubishi Alliance, Hyundai Motor Company, Kia Corporation, Toyota Motor Corporation, Honda Motor Co Ltd, Great Wall Motor Company Ltd (GWM), Mitsubishi Motors Corporation, Suzuki Motor Corporation, Ford Motor Company.
3. What are the main segments of the APAC Commercial Vehicle Market?
The market segments include Vehicle Type, Propulsion Type.
4. Can you provide details about the market size?
The market size is estimated to be USD XX Million as of 2022.
5. What are some drivers contributing to market growth?
Surge in Trend of Yacht Tourism.
6. What are the notable trends driving market growth?
OTHER KEY INDUSTRY TRENDS COVERED IN THE REPORT.
7. Are there any restraints impacting market growth?
Higher Rentals During Peak Season.
8. Can you provide examples of recent developments in the market?
August 2023: General Motors will launch an all-electric Cadillac Escalade in late 2024August 2023: General Motors doubles down on plans for an electric future in the Middle East.August 2023: Toyota Kirloskar Motor launched the all-new MPV Vellfire strong hybrid electric vehicle (SHEV) for a starting price of INR 11.99 million and going to INR 12.99 million.
9. What pricing options are available for accessing the report?
Pricing options include single-user, multi-user, and enterprise licenses priced at USD 3800, USD 4500, and USD 5800 respectively.
10. Is the market size provided in terms of value or volume?
The market size is provided in terms of value, measured in Million.
11. Are there any specific market keywords associated with the report?
Yes, the market keyword associated with the report is "APAC Commercial Vehicle Market," which aids in identifying and referencing the specific market segment covered.
12. How do I determine which pricing option suits my needs best?
The pricing options vary based on user requirements and access needs. Individual users may opt for single-user licenses, while businesses requiring broader access may choose multi-user or enterprise licenses for cost-effective access to the report.
13. Are there any additional resources or data provided in the APAC Commercial Vehicle Market report?
While the report offers comprehensive insights, it's advisable to review the specific contents or supplementary materials provided to ascertain if additional resources or data are available.
14. How can I stay updated on further developments or reports in the APAC Commercial Vehicle Market?
To stay informed about further developments, trends, and reports in the APAC Commercial Vehicle Market, consider subscribing to industry newsletters, following relevant companies and organizations, or regularly checking reputable industry news sources and publications.
Methodology
Step 1 - Identification of Relevant Samples Size from Population Database


Step 2 - Approaches for Defining Global Market Size (Value, Volume* & Price*)

Note*: In applicable scenarios
Step 3 - Data Sources
Primary Research
- Web Analytics
- Survey Reports
- Research Institute
- Latest Research Reports
- Opinion Leaders
Secondary Research
- Annual Reports
- White Paper
- Latest Press Release
- Industry Association
- Paid Database
- Investor Presentations

Step 4 - Data Triangulation
Involves using different sources of information in order to increase the validity of a study
These sources are likely to be stakeholders in a program - participants, other researchers, program staff, other community members, and so on.
Then we put all data in single framework & apply various statistical tools to find out the dynamic on the market.
During the analysis stage, feedback from the stakeholder groups would be compared to determine areas of agreement as well as areas of divergence
