

Key Insights
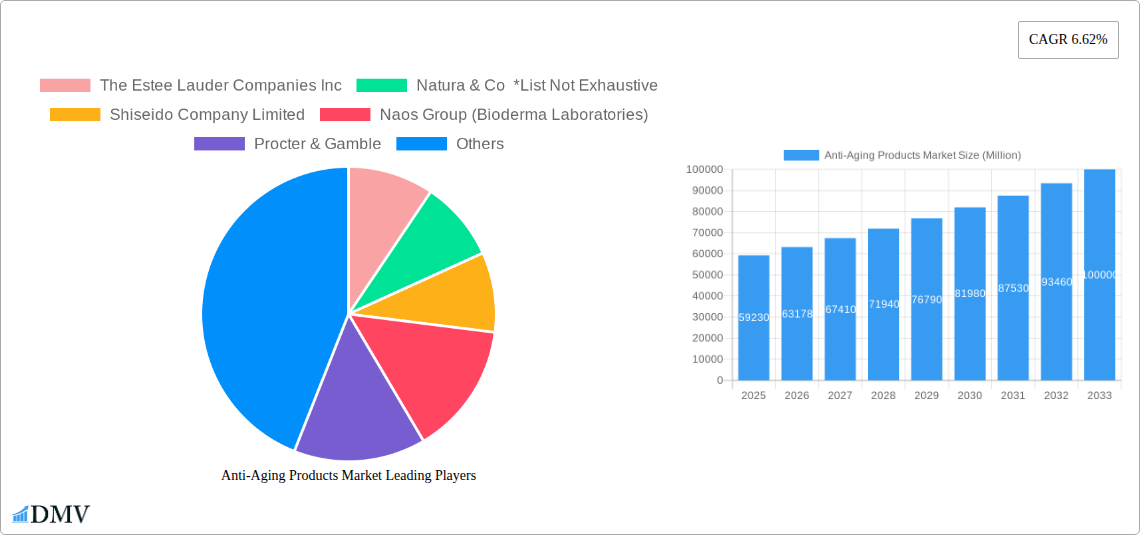
The global anti-aging products market, valued at $59.23 billion in 2025, is projected to experience robust growth, driven by a rising aging population globally and increasing consumer awareness of skincare and anti-aging solutions. A compound annual growth rate (CAGR) of 6.62% from 2025 to 2033 indicates a significant market expansion, reaching an estimated value exceeding $100 billion by 2033. Key drivers include the increasing prevalence of age-related skin concerns like wrinkles, age spots, and loss of elasticity, coupled with advancements in skincare technology leading to more effective and targeted anti-aging products. The market is segmented by product type, with facial creams and lotions holding the largest market share due to their widespread use and accessibility, followed by serums and concentrates, which are gaining popularity due to their concentrated formulations and targeted benefits. Distribution channels are diverse, with online retail stores showing strong growth due to the convenience and wider reach offered by e-commerce platforms. Major players like Estée Lauder, L'Oréal, and Shiseido dominate the market, leveraging brand recognition and extensive product portfolios. However, the market also witnesses the emergence of smaller niche brands focusing on natural and organic ingredients, catering to the growing demand for sustainable and ethically sourced anti-aging solutions. Regional growth varies, with North America and Asia Pacific anticipated to lead, fueled by high disposable incomes and increasing health consciousness in these regions.
The market faces certain restraints, including the potential for adverse reactions to certain ingredients and concerns about the efficacy of some anti-aging products. However, the continued innovation in ingredient technology, along with the rising demand for preventive skincare solutions, is expected to mitigate these challenges. The increasing adoption of personalized skincare routines and the rising popularity of advanced technologies like stem cell treatments and laser therapies are shaping the future of the anti-aging products market. This segment’s future growth hinges on continued technological advancements and consumer education regarding the efficacy and safety of various anti-aging products. The market's trajectory is largely optimistic, driven by strong consumer demand and the consistent introduction of innovative products addressing a wider range of skincare needs.
Anti-Aging Products Market Report: 2019-2033
This comprehensive report provides an in-depth analysis of the global Anti-Aging Products Market, offering valuable insights for stakeholders seeking to navigate this dynamic industry. The study covers the period 2019-2033, with a base year of 2025 and a forecast period of 2025-2033. The report delves into market size, segmentation, competitive landscape, and future growth prospects, providing actionable intelligence for strategic decision-making. The market is projected to reach xx Million by 2033, showcasing significant growth potential.
Anti-Aging Products Market Composition & Trends
This section analyzes the competitive intensity, driving forces behind innovation, regulatory frameworks, substitute products, key consumer demographics, and mergers & acquisitions within the anti-aging products market. The market exhibits a moderately concentrated landscape with key players holding significant shares. The Estee Lauder Companies Inc., Natura & Co, Shiseido Company Limited, Naos Group (Bioderma Laboratories), Procter & Gamble, Caudalie, L'Oréal SA, Groupe Clarins, Beiersdorf Limited, and Oriflame Cosmetics AG are some of the prominent players, although the market also includes a multitude of smaller companies.
- Market Share Distribution: The top 5 companies hold approximately xx% of the market share in 2025, while the remaining share is distributed amongst numerous smaller players. Precise figures for each player are detailed within the full report.
- M&A Activity: The market has witnessed significant M&A activity in recent years, with deal values totaling approximately xx Million in the period 2019-2024. These activities are primarily driven by the pursuit of market expansion, technological advancement, and brand portfolio diversification. Detailed analysis of notable M&A events is included in the report.
- Innovation Catalysts: Growing consumer awareness of anti-aging benefits and advancements in skincare technology are propelling innovation, leading to the development of advanced formulations and delivery systems.
- Regulatory Landscape: Stringent regulations regarding product safety and efficacy vary across regions, influencing product development and market access strategies. The report provides a regional overview of these regulations.
- Substitute Products: The presence of alternative treatments (e.g., cosmetic procedures) presents a competitive challenge, impacting the market growth trajectory.
- End-User Profile: The primary end-users are predominantly women aged 35-65 years, representing a significant and growing market segment across global markets. Demographic and psychographic details are fully examined within the report.
Anti-Aging Products Market Industry Evolution
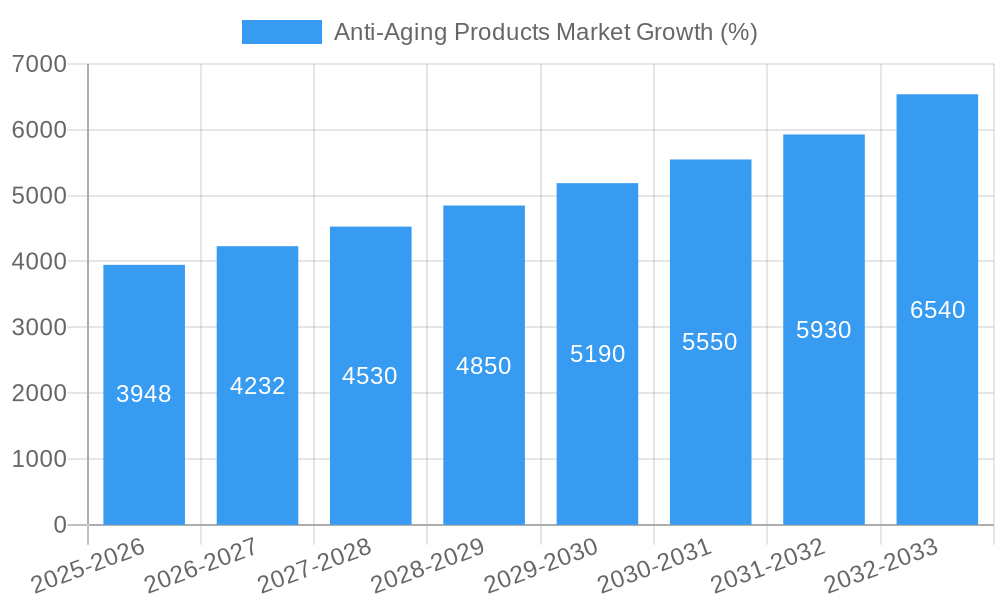
The global anti-aging products market has experienced robust growth throughout the historical period (2019-2024), driven by increasing consumer awareness of skin aging and a rising demand for effective anti-aging solutions. Technological advancements, such as the incorporation of peptides, stem cells, and advanced delivery systems, have significantly enhanced product efficacy and appeal. The market has witnessed a notable shift in consumer preferences towards natural and organic ingredients, influencing product formulations and marketing strategies. Furthermore, the e-commerce boom has played a major role in reshaping the distribution channels and consumer reach. Growth rates averaged xx% annually between 2019 and 2024, with a projected increase to xx% annually for the forecast period (2025-2033). The adoption rate of premium anti-aging products shows a consistent rise, showcasing consumer willingness to invest in high-quality solutions. Detailed data on market growth trajectories and the adoption of specific technologies is available in the full report.
Leading Regions, Countries, or Segments in Anti-Aging Products Market
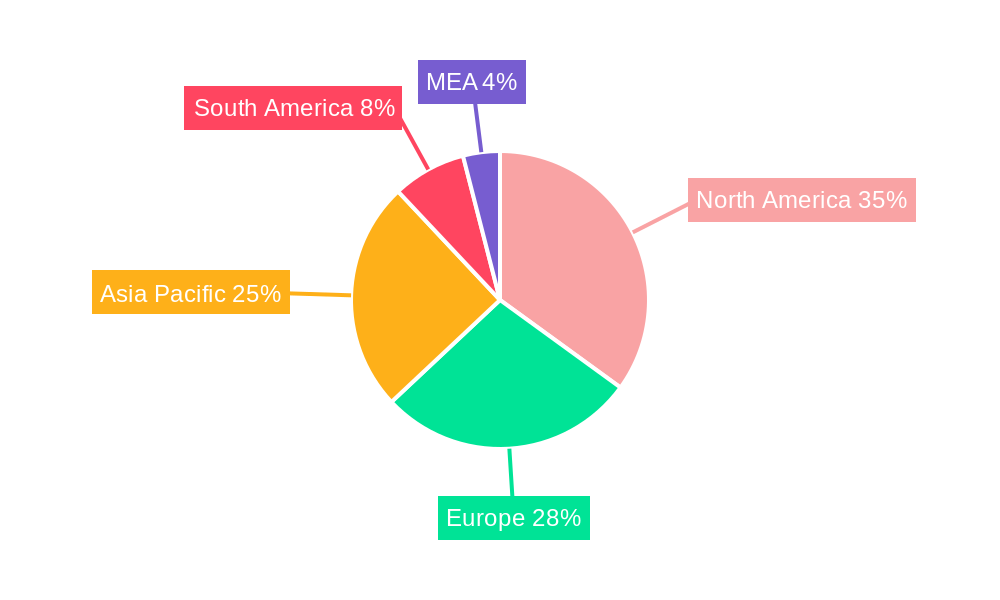
The North American region currently dominates the anti-aging products market, driven by high consumer spending, advanced skincare technology, and a strong presence of established players. However, Asia Pacific is anticipated to display significant growth potential, fueled by rising disposable incomes and increasing consumer awareness of anti-aging benefits.
By Product Type:
- Facial Creams and Lotions: This segment maintains a leading position due to its widespread acceptance and relatively lower price points compared to other categories.
- Serums and Concentrates: The increasing popularity of serums and concentrates reflects the growing consumer demand for highly concentrated active ingredients.
- Under Eye Creams: The targeted approach of under-eye creams is driving the growth of this specific segment.
- Others (Facial Oils, Sheet Masks): This segment is experiencing growth, driven by increasing consumer interest in innovative formulations and convenient applications.
By Distribution Channel:
- Online Retail Stores: The rapid expansion of online retail presents a significant growth opportunity, with increasing accessibility and convenience for consumers.
- Specialty Stores: Specialty stores remain relevant due to their ability to provide expert advice and cater to a niche market.
- Pharmacies/Drug Stores: This channel remains essential for certain anti-aging products.
- Supermarkets/Hypermarkets: Supermarkets and hypermarkets serve a broader consumer base, though with possibly less focus on specialized products.
- Other Distribution Channels: Direct-to-consumer models and professional channels offer niche opportunities.
Key drivers across these segments include increasing disposable income, higher health consciousness among consumers, and supportive government regulations, particularly in countries with aging populations.
Anti-Aging Products Market Product Innovations
Recent innovations in anti-aging products encompass the integration of advanced ingredients such as peptides, retinoids, and antioxidants, as well as innovative delivery systems like liposomes and micro-needling patches. These advancements aim to enhance product efficacy, improve skin absorption, and provide a superior consumer experience. Unique selling propositions often focus on targeting specific skin concerns, like wrinkles, hyperpigmentation, and sagging, or natural ingredients and sustainable practices.
Propelling Factors for Anti-Aging Products Market Growth
Several factors contribute to the market's expansion. Technological advancements continuously improve the efficacy of anti-aging products. Rising disposable incomes in developing economies broaden the market reach. Supportive government regulations in certain regions promote market growth. For example, the increasing awareness of the benefits of preventative skincare is fueling the expansion of the market, alongside the growing prevalence of social media influencers promoting such products.
Obstacles in the Anti-Aging Products Market
The market faces challenges including stringent regulatory requirements, supply chain disruptions impacting ingredient sourcing and manufacturing, and intense competition from both established and emerging players. Furthermore, negative perceptions of certain ingredients and concerns over the potential side effects can hinder market growth. The total impact of these factors is estimated to reduce the market size by approximately xx Million annually in the forecast period.
Future Opportunities in Anti-Aging Products Market
Future opportunities lie in developing personalized anti-aging solutions leveraging advancements in genomics and artificial intelligence. The growing demand for sustainable and ethically sourced ingredients presents a significant opportunity for brands focusing on eco-friendly practices. Expanding into new and emerging markets, particularly in Asia-Pacific, holds immense potential for growth.
Major Players in the Anti-Aging Products Market Ecosystem
- The Estée Lauder Companies Inc. (https://www.elcompanies.com/)
- Natura & Co (https://www.naturaeco.com/)
- Shiseido Company Limited (https://www.shiseido.co.jp/en/)
- Naos Group (Bioderma Laboratories)
- Procter & Gamble (https://www.pg.com/)
- Caudalie (https://us.caudalie.com/)
- L'Oréal SA (https://www.loreal.com/en/index.aspx)
- Groupe Clarins (https://www.clarins.com/us/)
- Beiersdorf Limited (https://www.beiersdorf.com/en/)
- Oriflame Cosmetics AG (https://www.oriflame.com/)
Key Developments in Anti-Aging Products Market Industry
- March 2024: Dermalogica launched its Circular Hydration Serum, focusing on hyaluronic acid and algae extracts for intense hydration.
- March 2024: L'Oréal Canada introduced SkinBetter Science, expanding its medical aesthetic skincare portfolio.
- April 2024: Nivea launched its Q10 Dual Action serum, targeting sugar-induced skin aging.
Strategic Anti-Aging Products Market Forecast
The anti-aging products market is poised for continued growth, driven by technological innovations, increasing consumer awareness, and expansion into new markets. The market’s future success hinges on adapting to evolving consumer preferences, leveraging technological advancements, and addressing regulatory challenges effectively. The forecasted growth provides ample opportunities for both established players and new entrants, provided they demonstrate innovation and consumer-centric strategies.
Anti-Aging Products Market Segmentation
-
1. Product Type
- 1.1. Facial Creams and Lotions
- 1.2. Serums and Concentrates
- 1.3. Under Eye Creams
- 1.4. Others (Facial Oils, Sheet Masks)
-
2. Distribution Channel
- 2.1. Supermarkets/Hypermarkets
- 2.2. Specialty Stores
- 2.3. Pharmacies/Drug Stores
- 2.4. Online Retail Stores
- 2.5. Other Distribution Channels
Anti-Aging Products Market Segmentation By Geography
-
1. North America
- 1.1. United States
- 1.2. Canada
- 1.3. Mexico
- 1.4. Rest of North America
-
2. Europe
- 2.1. Spain
- 2.2. United Kingdom
- 2.3. Germany
- 2.4. France
- 2.5. Italy
- 2.6. Russia
- 2.7. Rest of Europe
-
3. Asia Pacific
- 3.1. China
- 3.2. Japan
- 3.3. India
- 3.4. Australia
- 3.5. Rest of Asia Pacific
-
4. South America
- 4.1. Brazil
- 4.2. Colombia
- 4.3. Rest of South America
-
5. Middle East and Africa
- 5.1. South Africa
- 5.2. Saudi Arabia
- 5.3. Rest of Middle East and Africa
Anti-Aging Products Market REPORT HIGHLIGHTS
| Aspects | Details |
|---|---|
| Study Period | 2019-2033 |
| Base Year | 2024 |
| Estimated Year | 2025 |
| Forecast Period | 2025-2033 |
| Historical Period | 2019-2024 |
| Growth Rate | CAGR of 6.62% from 2019-2033 |
| Segmentation |
|
Table of Contents
- 1. Introduction
- 1.1. Research Scope
- 1.2. Market Segmentation
- 1.3. Research Methodology
- 1.4. Definitions and Assumptions
- 2. Executive Summary
- 2.1. Introduction
- 3. Market Dynamics
- 3.1. Introduction
- 3.2. Market Drivers
- 3.2.1. Aggressive Marketing and Advertising By Brands; Desire Among Consumers For Youthful Skin
- 3.3. Market Restrains
- 3.3.1. Availability of Counterfeit Products
- 3.4. Market Trends
- 3.4.1. Aggressive Marketing and Advertising By Brands
- 4. Market Factor Analysis
- 4.1. Porters Five Forces
- 4.2. Supply/Value Chain
- 4.3. PESTEL analysis
- 4.4. Market Entropy
- 4.5. Patent/Trademark Analysis
- 5. Global Anti-Aging Products Market Analysis, Insights and Forecast, 2019-2031
- 5.1. Market Analysis, Insights and Forecast - by Product Type
- 5.1.1. Facial Creams and Lotions
- 5.1.2. Serums and Concentrates
- 5.1.3. Under Eye Creams
- 5.1.4. Others (Facial Oils, Sheet Masks)
- 5.2. Market Analysis, Insights and Forecast - by Distribution Channel
- 5.2.1. Supermarkets/Hypermarkets
- 5.2.2. Specialty Stores
- 5.2.3. Pharmacies/Drug Stores
- 5.2.4. Online Retail Stores
- 5.2.5. Other Distribution Channels
- 5.3. Market Analysis, Insights and Forecast - by Region
- 5.3.1. North America
- 5.3.2. Europe
- 5.3.3. Asia Pacific
- 5.3.4. South America
- 5.3.5. Middle East and Africa
- 5.1. Market Analysis, Insights and Forecast - by Product Type
- 6. North America Anti-Aging Products Market Analysis, Insights and Forecast, 2019-2031
- 6.1. Market Analysis, Insights and Forecast - by Product Type
- 6.1.1. Facial Creams and Lotions
- 6.1.2. Serums and Concentrates
- 6.1.3. Under Eye Creams
- 6.1.4. Others (Facial Oils, Sheet Masks)
- 6.2. Market Analysis, Insights and Forecast - by Distribution Channel
- 6.2.1. Supermarkets/Hypermarkets
- 6.2.2. Specialty Stores
- 6.2.3. Pharmacies/Drug Stores
- 6.2.4. Online Retail Stores
- 6.2.5. Other Distribution Channels
- 6.1. Market Analysis, Insights and Forecast - by Product Type
- 7. Europe Anti-Aging Products Market Analysis, Insights and Forecast, 2019-2031
- 7.1. Market Analysis, Insights and Forecast - by Product Type
- 7.1.1. Facial Creams and Lotions
- 7.1.2. Serums and Concentrates
- 7.1.3. Under Eye Creams
- 7.1.4. Others (Facial Oils, Sheet Masks)
- 7.2. Market Analysis, Insights and Forecast - by Distribution Channel
- 7.2.1. Supermarkets/Hypermarkets
- 7.2.2. Specialty Stores
- 7.2.3. Pharmacies/Drug Stores
- 7.2.4. Online Retail Stores
- 7.2.5. Other Distribution Channels
- 7.1. Market Analysis, Insights and Forecast - by Product Type
- 8. Asia Pacific Anti-Aging Products Market Analysis, Insights and Forecast, 2019-2031
- 8.1. Market Analysis, Insights and Forecast - by Product Type
- 8.1.1. Facial Creams and Lotions
- 8.1.2. Serums and Concentrates
- 8.1.3. Under Eye Creams
- 8.1.4. Others (Facial Oils, Sheet Masks)
- 8.2. Market Analysis, Insights and Forecast - by Distribution Channel
- 8.2.1. Supermarkets/Hypermarkets
- 8.2.2. Specialty Stores
- 8.2.3. Pharmacies/Drug Stores
- 8.2.4. Online Retail Stores
- 8.2.5. Other Distribution Channels
- 8.1. Market Analysis, Insights and Forecast - by Product Type
- 9. South America Anti-Aging Products Market Analysis, Insights and Forecast, 2019-2031
- 9.1. Market Analysis, Insights and Forecast - by Product Type
- 9.1.1. Facial Creams and Lotions
- 9.1.2. Serums and Concentrates
- 9.1.3. Under Eye Creams
- 9.1.4. Others (Facial Oils, Sheet Masks)
- 9.2. Market Analysis, Insights and Forecast - by Distribution Channel
- 9.2.1. Supermarkets/Hypermarkets
- 9.2.2. Specialty Stores
- 9.2.3. Pharmacies/Drug Stores
- 9.2.4. Online Retail Stores
- 9.2.5. Other Distribution Channels
- 9.1. Market Analysis, Insights and Forecast - by Product Type
- 10. Middle East and Africa Anti-Aging Products Market Analysis, Insights and Forecast, 2019-2031
- 10.1. Market Analysis, Insights and Forecast - by Product Type
- 10.1.1. Facial Creams and Lotions
- 10.1.2. Serums and Concentrates
- 10.1.3. Under Eye Creams
- 10.1.4. Others (Facial Oils, Sheet Masks)
- 10.2. Market Analysis, Insights and Forecast - by Distribution Channel
- 10.2.1. Supermarkets/Hypermarkets
- 10.2.2. Specialty Stores
- 10.2.3. Pharmacies/Drug Stores
- 10.2.4. Online Retail Stores
- 10.2.5. Other Distribution Channels
- 10.1. Market Analysis, Insights and Forecast - by Product Type
- 11. North America Anti-Aging Products Market Analysis, Insights and Forecast, 2019-2031
- 11.1. Market Analysis, Insights and Forecast - By Country/Sub-region
- 11.1.1 United States
- 11.1.2 Canada
- 11.1.3 Mexico
- 12. Europe Anti-Aging Products Market Analysis, Insights and Forecast, 2019-2031
- 12.1. Market Analysis, Insights and Forecast - By Country/Sub-region
- 12.1.1 Germany
- 12.1.2 United Kingdom
- 12.1.3 France
- 12.1.4 Spain
- 12.1.5 Italy
- 12.1.6 Spain
- 12.1.7 Belgium
- 12.1.8 Netherland
- 12.1.9 Nordics
- 12.1.10 Rest of Europe
- 13. Asia Pacific Anti-Aging Products Market Analysis, Insights and Forecast, 2019-2031
- 13.1. Market Analysis, Insights and Forecast - By Country/Sub-region
- 13.1.1 China
- 13.1.2 Japan
- 13.1.3 India
- 13.1.4 South Korea
- 13.1.5 Southeast Asia
- 13.1.6 Australia
- 13.1.7 Indonesia
- 13.1.8 Phillipes
- 13.1.9 Singapore
- 13.1.10 Thailandc
- 13.1.11 Rest of Asia Pacific
- 14. South America Anti-Aging Products Market Analysis, Insights and Forecast, 2019-2031
- 14.1. Market Analysis, Insights and Forecast - By Country/Sub-region
- 14.1.1 Brazil
- 14.1.2 Argentina
- 14.1.3 Peru
- 14.1.4 Chile
- 14.1.5 Colombia
- 14.1.6 Ecuador
- 14.1.7 Venezuela
- 14.1.8 Rest of South America
- 15. North America Anti-Aging Products Market Analysis, Insights and Forecast, 2019-2031
- 15.1. Market Analysis, Insights and Forecast - By Country/Sub-region
- 15.1.1 United States
- 15.1.2 Canada
- 15.1.3 Mexico
- 16. MEA Anti-Aging Products Market Analysis, Insights and Forecast, 2019-2031
- 16.1. Market Analysis, Insights and Forecast - By Country/Sub-region
- 16.1.1 United Arab Emirates
- 16.1.2 Saudi Arabia
- 16.1.3 South Africa
- 16.1.4 Rest of Middle East and Africa
- 17. Competitive Analysis
- 17.1. Global Market Share Analysis 2024
- 17.2. Company Profiles
- 17.2.1 The Estee Lauder Companies Inc
- 17.2.1.1. Overview
- 17.2.1.2. Products
- 17.2.1.3. SWOT Analysis
- 17.2.1.4. Recent Developments
- 17.2.1.5. Financials (Based on Availability)
- 17.2.2 Natura & Co *List Not Exhaustive
- 17.2.2.1. Overview
- 17.2.2.2. Products
- 17.2.2.3. SWOT Analysis
- 17.2.2.4. Recent Developments
- 17.2.2.5. Financials (Based on Availability)
- 17.2.3 Shiseido Company Limited
- 17.2.3.1. Overview
- 17.2.3.2. Products
- 17.2.3.3. SWOT Analysis
- 17.2.3.4. Recent Developments
- 17.2.3.5. Financials (Based on Availability)
- 17.2.4 Naos Group (Bioderma Laboratories)
- 17.2.4.1. Overview
- 17.2.4.2. Products
- 17.2.4.3. SWOT Analysis
- 17.2.4.4. Recent Developments
- 17.2.4.5. Financials (Based on Availability)
- 17.2.5 Procter & Gamble
- 17.2.5.1. Overview
- 17.2.5.2. Products
- 17.2.5.3. SWOT Analysis
- 17.2.5.4. Recent Developments
- 17.2.5.5. Financials (Based on Availability)
- 17.2.6 Caudalie
- 17.2.6.1. Overview
- 17.2.6.2. Products
- 17.2.6.3. SWOT Analysis
- 17.2.6.4. Recent Developments
- 17.2.6.5. Financials (Based on Availability)
- 17.2.7 LOreal SA
- 17.2.7.1. Overview
- 17.2.7.2. Products
- 17.2.7.3. SWOT Analysis
- 17.2.7.4. Recent Developments
- 17.2.7.5. Financials (Based on Availability)
- 17.2.8 Groupe Clarins
- 17.2.8.1. Overview
- 17.2.8.2. Products
- 17.2.8.3. SWOT Analysis
- 17.2.8.4. Recent Developments
- 17.2.8.5. Financials (Based on Availability)
- 17.2.9 Beiersdorf Limited
- 17.2.9.1. Overview
- 17.2.9.2. Products
- 17.2.9.3. SWOT Analysis
- 17.2.9.4. Recent Developments
- 17.2.9.5. Financials (Based on Availability)
- 17.2.10 Oriflame Cosmetics AG
- 17.2.10.1. Overview
- 17.2.10.2. Products
- 17.2.10.3. SWOT Analysis
- 17.2.10.4. Recent Developments
- 17.2.10.5. Financials (Based on Availability)
- 17.2.1 The Estee Lauder Companies Inc
List of Figures
- Figure 1: Global Anti-Aging Products Market Revenue Breakdown (Million, %) by Region 2024 & 2032
- Figure 2: North America Anti-Aging Products Market Revenue (Million), by Country 2024 & 2032
- Figure 3: North America Anti-Aging Products Market Revenue Share (%), by Country 2024 & 2032
- Figure 4: Europe Anti-Aging Products Market Revenue (Million), by Country 2024 & 2032
- Figure 5: Europe Anti-Aging Products Market Revenue Share (%), by Country 2024 & 2032
- Figure 6: Asia Pacific Anti-Aging Products Market Revenue (Million), by Country 2024 & 2032
- Figure 7: Asia Pacific Anti-Aging Products Market Revenue Share (%), by Country 2024 & 2032
- Figure 8: South America Anti-Aging Products Market Revenue (Million), by Country 2024 & 2032
- Figure 9: South America Anti-Aging Products Market Revenue Share (%), by Country 2024 & 2032
- Figure 10: North America Anti-Aging Products Market Revenue (Million), by Country 2024 & 2032
- Figure 11: North America Anti-Aging Products Market Revenue Share (%), by Country 2024 & 2032
- Figure 12: MEA Anti-Aging Products Market Revenue (Million), by Country 2024 & 2032
- Figure 13: MEA Anti-Aging Products Market Revenue Share (%), by Country 2024 & 2032
- Figure 14: North America Anti-Aging Products Market Revenue (Million), by Product Type 2024 & 2032
- Figure 15: North America Anti-Aging Products Market Revenue Share (%), by Product Type 2024 & 2032
- Figure 16: North America Anti-Aging Products Market Revenue (Million), by Distribution Channel 2024 & 2032
- Figure 17: North America Anti-Aging Products Market Revenue Share (%), by Distribution Channel 2024 & 2032
- Figure 18: North America Anti-Aging Products Market Revenue (Million), by Country 2024 & 2032
- Figure 19: North America Anti-Aging Products Market Revenue Share (%), by Country 2024 & 2032
- Figure 20: Europe Anti-Aging Products Market Revenue (Million), by Product Type 2024 & 2032
- Figure 21: Europe Anti-Aging Products Market Revenue Share (%), by Product Type 2024 & 2032
- Figure 22: Europe Anti-Aging Products Market Revenue (Million), by Distribution Channel 2024 & 2032
- Figure 23: Europe Anti-Aging Products Market Revenue Share (%), by Distribution Channel 2024 & 2032
- Figure 24: Europe Anti-Aging Products Market Revenue (Million), by Country 2024 & 2032
- Figure 25: Europe Anti-Aging Products Market Revenue Share (%), by Country 2024 & 2032
- Figure 26: Asia Pacific Anti-Aging Products Market Revenue (Million), by Product Type 2024 & 2032
- Figure 27: Asia Pacific Anti-Aging Products Market Revenue Share (%), by Product Type 2024 & 2032
- Figure 28: Asia Pacific Anti-Aging Products Market Revenue (Million), by Distribution Channel 2024 & 2032
- Figure 29: Asia Pacific Anti-Aging Products Market Revenue Share (%), by Distribution Channel 2024 & 2032
- Figure 30: Asia Pacific Anti-Aging Products Market Revenue (Million), by Country 2024 & 2032
- Figure 31: Asia Pacific Anti-Aging Products Market Revenue Share (%), by Country 2024 & 2032
- Figure 32: South America Anti-Aging Products Market Revenue (Million), by Product Type 2024 & 2032
- Figure 33: South America Anti-Aging Products Market Revenue Share (%), by Product Type 2024 & 2032
- Figure 34: South America Anti-Aging Products Market Revenue (Million), by Distribution Channel 2024 & 2032
- Figure 35: South America Anti-Aging Products Market Revenue Share (%), by Distribution Channel 2024 & 2032
- Figure 36: South America Anti-Aging Products Market Revenue (Million), by Country 2024 & 2032
- Figure 37: South America Anti-Aging Products Market Revenue Share (%), by Country 2024 & 2032
- Figure 38: Middle East and Africa Anti-Aging Products Market Revenue (Million), by Product Type 2024 & 2032
- Figure 39: Middle East and Africa Anti-Aging Products Market Revenue Share (%), by Product Type 2024 & 2032
- Figure 40: Middle East and Africa Anti-Aging Products Market Revenue (Million), by Distribution Channel 2024 & 2032
- Figure 41: Middle East and Africa Anti-Aging Products Market Revenue Share (%), by Distribution Channel 2024 & 2032
- Figure 42: Middle East and Africa Anti-Aging Products Market Revenue (Million), by Country 2024 & 2032
- Figure 43: Middle East and Africa Anti-Aging Products Market Revenue Share (%), by Country 2024 & 2032
List of Tables
- Table 1: Global Anti-Aging Products Market Revenue Million Forecast, by Region 2019 & 2032
- Table 2: Global Anti-Aging Products Market Revenue Million Forecast, by Product Type 2019 & 2032
- Table 3: Global Anti-Aging Products Market Revenue Million Forecast, by Distribution Channel 2019 & 2032
- Table 4: Global Anti-Aging Products Market Revenue Million Forecast, by Region 2019 & 2032
- Table 5: Global Anti-Aging Products Market Revenue Million Forecast, by Country 2019 & 2032
- Table 6: United States Anti-Aging Products Market Revenue (Million) Forecast, by Application 2019 & 2032
- Table 7: Canada Anti-Aging Products Market Revenue (Million) Forecast, by Application 2019 & 2032
- Table 8: Mexico Anti-Aging Products Market Revenue (Million) Forecast, by Application 2019 & 2032
- Table 9: Global Anti-Aging Products Market Revenue Million Forecast, by Country 2019 & 2032
- Table 10: Germany Anti-Aging Products Market Revenue (Million) Forecast, by Application 2019 & 2032
- Table 11: United Kingdom Anti-Aging Products Market Revenue (Million) Forecast, by Application 2019 & 2032
- Table 12: France Anti-Aging Products Market Revenue (Million) Forecast, by Application 2019 & 2032
- Table 13: Spain Anti-Aging Products Market Revenue (Million) Forecast, by Application 2019 & 2032
- Table 14: Italy Anti-Aging Products Market Revenue (Million) Forecast, by Application 2019 & 2032
- Table 15: Spain Anti-Aging Products Market Revenue (Million) Forecast, by Application 2019 & 2032
- Table 16: Belgium Anti-Aging Products Market Revenue (Million) Forecast, by Application 2019 & 2032
- Table 17: Netherland Anti-Aging Products Market Revenue (Million) Forecast, by Application 2019 & 2032
- Table 18: Nordics Anti-Aging Products Market Revenue (Million) Forecast, by Application 2019 & 2032
- Table 19: Rest of Europe Anti-Aging Products Market Revenue (Million) Forecast, by Application 2019 & 2032
- Table 20: Global Anti-Aging Products Market Revenue Million Forecast, by Country 2019 & 2032
- Table 21: China Anti-Aging Products Market Revenue (Million) Forecast, by Application 2019 & 2032
- Table 22: Japan Anti-Aging Products Market Revenue (Million) Forecast, by Application 2019 & 2032
- Table 23: India Anti-Aging Products Market Revenue (Million) Forecast, by Application 2019 & 2032
- Table 24: South Korea Anti-Aging Products Market Revenue (Million) Forecast, by Application 2019 & 2032
- Table 25: Southeast Asia Anti-Aging Products Market Revenue (Million) Forecast, by Application 2019 & 2032
- Table 26: Australia Anti-Aging Products Market Revenue (Million) Forecast, by Application 2019 & 2032
- Table 27: Indonesia Anti-Aging Products Market Revenue (Million) Forecast, by Application 2019 & 2032
- Table 28: Phillipes Anti-Aging Products Market Revenue (Million) Forecast, by Application 2019 & 2032
- Table 29: Singapore Anti-Aging Products Market Revenue (Million) Forecast, by Application 2019 & 2032
- Table 30: Thailandc Anti-Aging Products Market Revenue (Million) Forecast, by Application 2019 & 2032
- Table 31: Rest of Asia Pacific Anti-Aging Products Market Revenue (Million) Forecast, by Application 2019 & 2032
- Table 32: Global Anti-Aging Products Market Revenue Million Forecast, by Country 2019 & 2032
- Table 33: Brazil Anti-Aging Products Market Revenue (Million) Forecast, by Application 2019 & 2032
- Table 34: Argentina Anti-Aging Products Market Revenue (Million) Forecast, by Application 2019 & 2032
- Table 35: Peru Anti-Aging Products Market Revenue (Million) Forecast, by Application 2019 & 2032
- Table 36: Chile Anti-Aging Products Market Revenue (Million) Forecast, by Application 2019 & 2032
- Table 37: Colombia Anti-Aging Products Market Revenue (Million) Forecast, by Application 2019 & 2032
- Table 38: Ecuador Anti-Aging Products Market Revenue (Million) Forecast, by Application 2019 & 2032
- Table 39: Venezuela Anti-Aging Products Market Revenue (Million) Forecast, by Application 2019 & 2032
- Table 40: Rest of South America Anti-Aging Products Market Revenue (Million) Forecast, by Application 2019 & 2032
- Table 41: Global Anti-Aging Products Market Revenue Million Forecast, by Country 2019 & 2032
- Table 42: United States Anti-Aging Products Market Revenue (Million) Forecast, by Application 2019 & 2032
- Table 43: Canada Anti-Aging Products Market Revenue (Million) Forecast, by Application 2019 & 2032
- Table 44: Mexico Anti-Aging Products Market Revenue (Million) Forecast, by Application 2019 & 2032
- Table 45: Global Anti-Aging Products Market Revenue Million Forecast, by Country 2019 & 2032
- Table 46: United Arab Emirates Anti-Aging Products Market Revenue (Million) Forecast, by Application 2019 & 2032
- Table 47: Saudi Arabia Anti-Aging Products Market Revenue (Million) Forecast, by Application 2019 & 2032
- Table 48: South Africa Anti-Aging Products Market Revenue (Million) Forecast, by Application 2019 & 2032
- Table 49: Rest of Middle East and Africa Anti-Aging Products Market Revenue (Million) Forecast, by Application 2019 & 2032
- Table 50: Global Anti-Aging Products Market Revenue Million Forecast, by Product Type 2019 & 2032
- Table 51: Global Anti-Aging Products Market Revenue Million Forecast, by Distribution Channel 2019 & 2032
- Table 52: Global Anti-Aging Products Market Revenue Million Forecast, by Country 2019 & 2032
- Table 53: United States Anti-Aging Products Market Revenue (Million) Forecast, by Application 2019 & 2032
- Table 54: Canada Anti-Aging Products Market Revenue (Million) Forecast, by Application 2019 & 2032
- Table 55: Mexico Anti-Aging Products Market Revenue (Million) Forecast, by Application 2019 & 2032
- Table 56: Rest of North America Anti-Aging Products Market Revenue (Million) Forecast, by Application 2019 & 2032
- Table 57: Global Anti-Aging Products Market Revenue Million Forecast, by Product Type 2019 & 2032
- Table 58: Global Anti-Aging Products Market Revenue Million Forecast, by Distribution Channel 2019 & 2032
- Table 59: Global Anti-Aging Products Market Revenue Million Forecast, by Country 2019 & 2032
- Table 60: Spain Anti-Aging Products Market Revenue (Million) Forecast, by Application 2019 & 2032
- Table 61: United Kingdom Anti-Aging Products Market Revenue (Million) Forecast, by Application 2019 & 2032
- Table 62: Germany Anti-Aging Products Market Revenue (Million) Forecast, by Application 2019 & 2032
- Table 63: France Anti-Aging Products Market Revenue (Million) Forecast, by Application 2019 & 2032
- Table 64: Italy Anti-Aging Products Market Revenue (Million) Forecast, by Application 2019 & 2032
- Table 65: Russia Anti-Aging Products Market Revenue (Million) Forecast, by Application 2019 & 2032
- Table 66: Rest of Europe Anti-Aging Products Market Revenue (Million) Forecast, by Application 2019 & 2032
- Table 67: Global Anti-Aging Products Market Revenue Million Forecast, by Product Type 2019 & 2032
- Table 68: Global Anti-Aging Products Market Revenue Million Forecast, by Distribution Channel 2019 & 2032
- Table 69: Global Anti-Aging Products Market Revenue Million Forecast, by Country 2019 & 2032
- Table 70: China Anti-Aging Products Market Revenue (Million) Forecast, by Application 2019 & 2032
- Table 71: Japan Anti-Aging Products Market Revenue (Million) Forecast, by Application 2019 & 2032
- Table 72: India Anti-Aging Products Market Revenue (Million) Forecast, by Application 2019 & 2032
- Table 73: Australia Anti-Aging Products Market Revenue (Million) Forecast, by Application 2019 & 2032
- Table 74: Rest of Asia Pacific Anti-Aging Products Market Revenue (Million) Forecast, by Application 2019 & 2032
- Table 75: Global Anti-Aging Products Market Revenue Million Forecast, by Product Type 2019 & 2032
- Table 76: Global Anti-Aging Products Market Revenue Million Forecast, by Distribution Channel 2019 & 2032
- Table 77: Global Anti-Aging Products Market Revenue Million Forecast, by Country 2019 & 2032
- Table 78: Brazil Anti-Aging Products Market Revenue (Million) Forecast, by Application 2019 & 2032
- Table 79: Colombia Anti-Aging Products Market Revenue (Million) Forecast, by Application 2019 & 2032
- Table 80: Rest of South America Anti-Aging Products Market Revenue (Million) Forecast, by Application 2019 & 2032
- Table 81: Global Anti-Aging Products Market Revenue Million Forecast, by Product Type 2019 & 2032
- Table 82: Global Anti-Aging Products Market Revenue Million Forecast, by Distribution Channel 2019 & 2032
- Table 83: Global Anti-Aging Products Market Revenue Million Forecast, by Country 2019 & 2032
- Table 84: South Africa Anti-Aging Products Market Revenue (Million) Forecast, by Application 2019 & 2032
- Table 85: Saudi Arabia Anti-Aging Products Market Revenue (Million) Forecast, by Application 2019 & 2032
- Table 86: Rest of Middle East and Africa Anti-Aging Products Market Revenue (Million) Forecast, by Application 2019 & 2032
Frequently Asked Questions
1. What is the projected Compound Annual Growth Rate (CAGR) of the Anti-Aging Products Market?
The projected CAGR is approximately 6.62%.
2. Which companies are prominent players in the Anti-Aging Products Market?
Key companies in the market include The Estee Lauder Companies Inc, Natura & Co *List Not Exhaustive, Shiseido Company Limited, Naos Group (Bioderma Laboratories), Procter & Gamble, Caudalie, LOreal SA, Groupe Clarins, Beiersdorf Limited, Oriflame Cosmetics AG.
3. What are the main segments of the Anti-Aging Products Market?
The market segments include Product Type, Distribution Channel.
4. Can you provide details about the market size?
The market size is estimated to be USD 59.23 Million as of 2022.
5. What are some drivers contributing to market growth?
Aggressive Marketing and Advertising By Brands; Desire Among Consumers For Youthful Skin.
6. What are the notable trends driving market growth?
Aggressive Marketing and Advertising By Brands.
7. Are there any restraints impacting market growth?
Availability of Counterfeit Products.
8. Can you provide examples of recent developments in the market?
April 2024: Nivea expanded its anti-aging product portfolio by launching the Q10 Dual Action serum. The company claims that the serum targets sugar-induced skin aging and wrinkle formation. The formula was designed to prevent protein glycation in the dermis skin layer, protecting collagen and elastin from damage.
9. What pricing options are available for accessing the report?
Pricing options include single-user, multi-user, and enterprise licenses priced at USD 4750, USD 5250, and USD 8750 respectively.
10. Is the market size provided in terms of value or volume?
The market size is provided in terms of value, measured in Million.
11. Are there any specific market keywords associated with the report?
Yes, the market keyword associated with the report is "Anti-Aging Products Market," which aids in identifying and referencing the specific market segment covered.
12. How do I determine which pricing option suits my needs best?
The pricing options vary based on user requirements and access needs. Individual users may opt for single-user licenses, while businesses requiring broader access may choose multi-user or enterprise licenses for cost-effective access to the report.
13. Are there any additional resources or data provided in the Anti-Aging Products Market report?
While the report offers comprehensive insights, it's advisable to review the specific contents or supplementary materials provided to ascertain if additional resources or data are available.
14. How can I stay updated on further developments or reports in the Anti-Aging Products Market?
To stay informed about further developments, trends, and reports in the Anti-Aging Products Market, consider subscribing to industry newsletters, following relevant companies and organizations, or regularly checking reputable industry news sources and publications.
Methodology
Step 1 - Identification of Relevant Samples Size from Population Database


Step 2 - Approaches for Defining Global Market Size (Value, Volume* & Price*)

Note*: In applicable scenarios
Step 3 - Data Sources
Primary Research
- Web Analytics
- Survey Reports
- Research Institute
- Latest Research Reports
- Opinion Leaders
Secondary Research
- Annual Reports
- White Paper
- Latest Press Release
- Industry Association
- Paid Database
- Investor Presentations

Step 4 - Data Triangulation
Involves using different sources of information in order to increase the validity of a study
These sources are likely to be stakeholders in a program - participants, other researchers, program staff, other community members, and so on.
Then we put all data in single framework & apply various statistical tools to find out the dynamic on the market.
During the analysis stage, feedback from the stakeholder groups would be compared to determine areas of agreement as well as areas of divergence
