

Key Insights
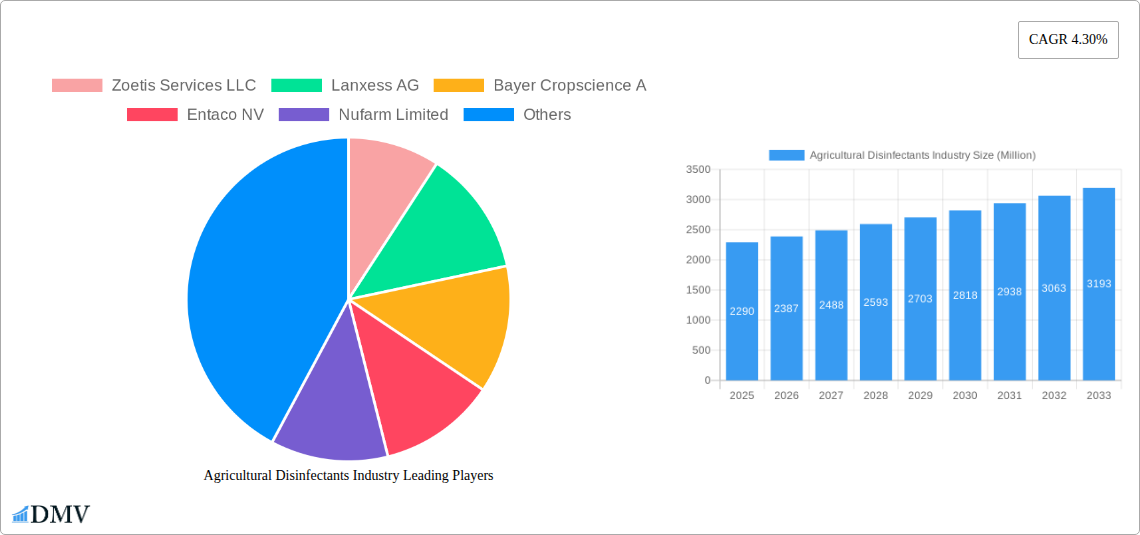
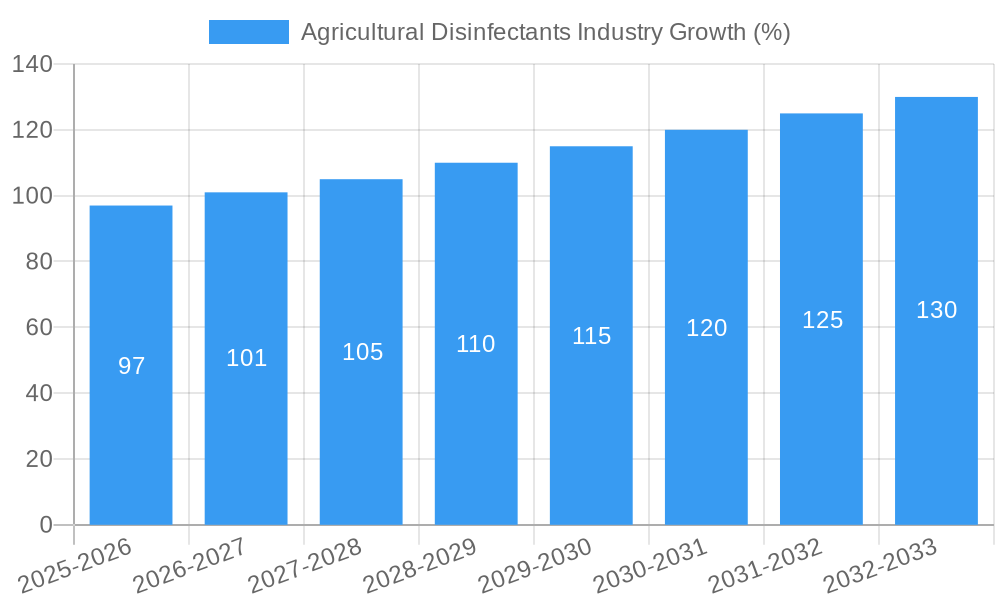
The agricultural disinfectants market, valued at $2.29 billion in 2025, is projected to experience steady growth, driven by rising concerns over animal and plant diseases, increasing demand for food safety, and stringent government regulations. The market's Compound Annual Growth Rate (CAGR) of 4.30% from 2025 to 2033 indicates a consistent expansion, with the market size expected to reach approximately $3.3 billion by 2033. Key drivers include the escalating prevalence of infectious diseases impacting livestock and crops, necessitating effective disinfection strategies. Furthermore, the growing awareness among farmers about hygiene practices and biosecurity measures is fueling the demand for these products. The liquid form dominates the market due to its ease of application and efficacy. Surface sanitizing remains the leading application segment, followed by aerial and water sanitizing, reflecting the diverse usage across agricultural settings. Major players like Zoetis, Lanxess, and Bayer are actively engaged in research and development, leading to the introduction of advanced and environmentally friendly disinfectants. While the market faces challenges such as stringent regulatory approvals and potential environmental concerns regarding certain chemical types, innovation in sustainable solutions and growing consumer demand for safe food products will offset these restraints. Regional growth is expected to be geographically diverse, with North America and Europe maintaining significant market shares while Asia-Pacific demonstrates strong potential due to its expanding agricultural sector and increasing adoption of modern farming practices.
The market segmentation reveals a diversified landscape. Quaternary Ammonium Chloride Salts currently hold a substantial share of the chemical type segment due to their broad-spectrum efficacy and cost-effectiveness. However, the Hydrogen Dioxide and Peracetic Acid segment is anticipated to witness robust growth due to its environmentally friendly nature and increasing consumer preference for sustainable solutions. The liquid form dominates due to ease of application, but powder formulations are gaining traction for ease of storage and transportation in remote areas. The surface disinfection segment will continue to hold the largest market share, driven by widespread use in livestock farms, greenhouses, and post-harvest handling. However, the aerial disinfection segment is expected to see growth fueled by the increasing need to control airborne pathogens. The competitive landscape is marked by both large multinational companies and specialized smaller players, leading to ongoing innovation and diversification of product offerings.
Agricultural Disinfectants Industry: A Comprehensive Market Report (2019-2033)
This insightful report provides a comprehensive analysis of the Agricultural Disinfectants market, projecting a robust growth trajectory driven by increasing concerns over animal and plant health, stringent regulatory frameworks, and technological advancements. Valued at $XX Million in 2025, the market is poised for significant expansion, reaching $XX Million by 2033, exhibiting a CAGR of XX% during the forecast period (2025-2033). This detailed analysis covers the historical period (2019-2024), base year (2025), and estimated year (2025).
Agricultural Disinfectants Industry Market Composition & Trends
The agricultural disinfectants market is characterized by moderate concentration, with key players like Zoetis Services LLC, Lanxess AG, Bayer Cropscience A, Entaco NV, Nufarm Limited, Corteva Agri Science, Stepan Company, Neogen Corporation, Thymox Technology, and Ceva Sante Animale Group vying for market share. Market share distribution is dynamic, with larger companies holding significant portions but facing competitive pressure from smaller, specialized firms. Innovation is driven by the need for more effective, environmentally friendly, and cost-efficient solutions. Stringent regulatory landscapes, particularly regarding the use of chemicals, influence product development and market access. Substitute products, such as natural disinfectants, are gaining traction, presenting both challenges and opportunities. The end-user profile encompasses diverse stakeholders, including farmers, livestock producers, and agricultural processing facilities.
- Market Concentration: Moderate, with top 5 players holding approximately XX% market share in 2025.
- M&A Activity: Significant activity observed in recent years, with notable acquisitions such as Lanxess AG’s acquisition of Theseo in 2021 (deal value: $XX Million).
- Innovation Catalysts: Increasing disease prevalence, stringent regulations, and the rising demand for eco-friendly solutions.
- Regulatory Landscape: Stringent regulations governing the registration and use of agricultural disinfectants vary across regions.
Agricultural Disinfectants Industry Evolution
The agricultural disinfectants market has witnessed substantial growth over the past decade, propelled by factors such as the rising prevalence of animal and plant diseases, growing awareness of biosecurity, and increased demand for food safety. Technological advancements have led to the development of more effective and environmentally friendly disinfectants, including formulations based on natural ingredients. Consumer demands are shifting towards sustainable and residue-free products, further driving innovation. The market growth trajectory is expected to remain positive, with consistent growth rates (XX% during 2019-2024 and XX% projected for 2025-2033). Adoption of new technologies like automated disinfection systems and advanced monitoring tools is also increasing. However, challenges such as price volatility and regulatory hurdles influence the pace of growth.
Leading Regions, Countries, or Segments in Agricultural Disinfectants Industry
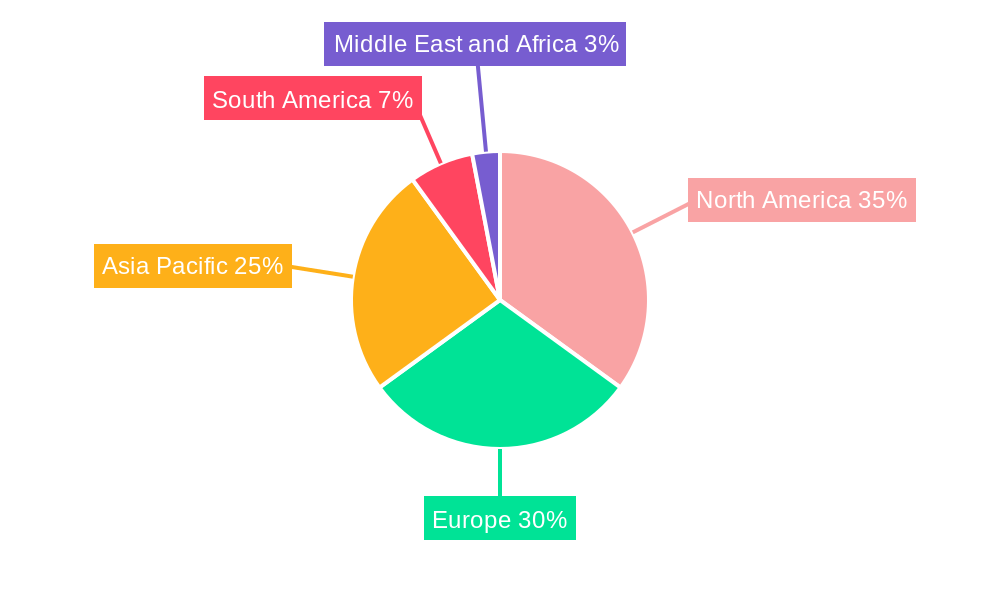
The North American region holds a leading position in the agricultural disinfectants market, driven by factors such as high agricultural output, advanced farming practices, and stringent regulations promoting the use of disinfectants. Europe follows as a significant market, while Asia Pacific is expected to witness robust growth in the coming years, fueled by expanding agricultural activities and rising awareness of animal and plant health.
- Chemical Type: Quaternary Ammonium Chloride Salts dominates the market due to its effectiveness and cost-effectiveness.
- Form: Liquid formulations hold a larger market share due to ease of application.
- Application: Surface disinfection is the most prevalent application, followed by water sanitizing.
Key Drivers:
- High agricultural output and intensive farming practices in North America and Europe.
- Stringent regulations promoting biosecurity and food safety.
- Rising investment in research and development of novel disinfectants.
Agricultural Disinfectants Industry Product Innovations
Recent innovations focus on broad-spectrum efficacy, environmentally friendly formulations (reduced environmental impact and enhanced biodegradability), and improved application methods (e.g., automated systems). The unique selling propositions include extended shelf life, improved compatibility with other agricultural chemicals, and reduced toxicity to beneficial organisms. Technological advancements include nano-encapsulation for targeted delivery and the use of natural antimicrobial agents.
Propelling Factors for Agricultural Disinfectants Industry Growth
Technological advancements, such as the development of more effective and environmentally friendly disinfectants, are key growth drivers. Economic factors, like rising disposable incomes and increased investment in agriculture, also play a role. Stringent regulatory frameworks promoting food safety and biosecurity are creating a demand for higher-quality disinfectants. The rising prevalence of animal and plant diseases necessitates the use of effective disinfectants.
Obstacles in the Agricultural Disinfectants Industry Market
Regulatory hurdles, including complex registration processes and stringent labeling requirements, present significant challenges. Supply chain disruptions due to geopolitical instability and fluctuating raw material prices impact production and pricing. Intense competition among established players and the emergence of new entrants further pressure profitability. The fluctuating prices of raw materials influence product pricing.
Future Opportunities in Agricultural Disinfectants Industry
Emerging markets in developing countries present significant growth potential. Advancements in nanotechnology and biotechnology will enable the development of novel, more effective, and environmentally friendly disinfectants. Growing consumer demand for sustainable agricultural practices will drive the adoption of eco-friendly disinfectants.
Major Players in the Agricultural Disinfectants Industry Ecosystem
- Zoetis Services LLC
- Lanxess AG
- Bayer Cropscience A
- Entaco NV
- Nufarm Limited
- Corteva Agri Science
- Stepan Company
- Neogen Corporation
- Thymox Technology
- Ceva Sante Animale Group
Key Developments in Agricultural Disinfectants Industry Industry
- 2021 (Q1): Ceva Santé Animale Group and INRAE Technologies signed an agreement to collaborate in animal health, focusing on disease prevention and animal welfare.
- 2021 (Q3): Lanxess AG acquired Theseo, expanding its portfolio of disinfection and hygiene solutions.
Strategic Agricultural Disinfectants Industry Market Forecast
The agricultural disinfectants market is set for sustained growth, driven by continued innovation, favorable regulatory landscapes in key regions, and increasing consumer awareness regarding food safety and animal welfare. The market’s expansion will be influenced by technological advancements and increased demand from emerging economies. The market's future is bright due to these opportunities.
Agricultural Disinfectants Industry Segmentation
- 1. Production Analysis
- 2. Consumption Analysis
- 3. Import Market Analysis (Value & Volume)
- 4. Export Market Analysis (Value & Volume)
- 5. Price Trend Analysis
Agricultural Disinfectants Industry Segmentation By Geography
-
1. North America
- 1.1. United States
- 1.2. Canada
- 1.3. Mexico
-
2. South America
- 2.1. Brazil
- 2.2. Argentina
- 2.3. Rest of South America
-
3. Europe
- 3.1. United Kingdom
- 3.2. Germany
- 3.3. France
- 3.4. Italy
- 3.5. Spain
- 3.6. Russia
- 3.7. Benelux
- 3.8. Nordics
- 3.9. Rest of Europe
-
4. Middle East & Africa
- 4.1. Turkey
- 4.2. Israel
- 4.3. GCC
- 4.4. North Africa
- 4.5. South Africa
- 4.6. Rest of Middle East & Africa
-
5. Asia Pacific
- 5.1. China
- 5.2. India
- 5.3. Japan
- 5.4. South Korea
- 5.5. ASEAN
- 5.6. Oceania
- 5.7. Rest of Asia Pacific
Agricultural Disinfectants Industry REPORT HIGHLIGHTS
| Aspects | Details |
|---|---|
| Study Period | 2019-2033 |
| Base Year | 2024 |
| Estimated Year | 2025 |
| Forecast Period | 2025-2033 |
| Historical Period | 2019-2024 |
| Growth Rate | CAGR of 4.30% from 2019-2033 |
| Segmentation |
|
Table of Contents
- 1. Introduction
- 1.1. Research Scope
- 1.2. Market Segmentation
- 1.3. Research Methodology
- 1.4. Definitions and Assumptions
- 2. Executive Summary
- 2.1. Introduction
- 3. Market Dynamics
- 3.1. Introduction
- 3.2. Market Drivers
- 3.2.1. Skilled Labor Shortage; Favorable Government Policies
- 3.3. Market Restrains
- 3.3.1. Fragmentation of Land Holdings; Increasing Interest of Farmers Toward Custom Hiring Center
- 3.4. Market Trends
- 3.4.1. Growing Area Under Protected Cultivation
- 4. Market Factor Analysis
- 4.1. Porters Five Forces
- 4.2. Supply/Value Chain
- 4.3. PESTEL analysis
- 4.4. Market Entropy
- 4.5. Patent/Trademark Analysis
- 5. Global Agricultural Disinfectants Industry Analysis, Insights and Forecast, 2019-2031
- 5.1. Market Analysis, Insights and Forecast - by Production Analysis
- 5.2. Market Analysis, Insights and Forecast - by Consumption Analysis
- 5.3. Market Analysis, Insights and Forecast - by Import Market Analysis (Value & Volume)
- 5.4. Market Analysis, Insights and Forecast - by Export Market Analysis (Value & Volume)
- 5.5. Market Analysis, Insights and Forecast - by Price Trend Analysis
- 5.6. Market Analysis, Insights and Forecast - by Region
- 5.6.1. North America
- 5.6.2. South America
- 5.6.3. Europe
- 5.6.4. Middle East & Africa
- 5.6.5. Asia Pacific
- 5.1. Market Analysis, Insights and Forecast - by Production Analysis
- 6. North America Agricultural Disinfectants Industry Analysis, Insights and Forecast, 2019-2031
- 6.1. Market Analysis, Insights and Forecast - by Production Analysis
- 6.2. Market Analysis, Insights and Forecast - by Consumption Analysis
- 6.3. Market Analysis, Insights and Forecast - by Import Market Analysis (Value & Volume)
- 6.4. Market Analysis, Insights and Forecast - by Export Market Analysis (Value & Volume)
- 6.5. Market Analysis, Insights and Forecast - by Price Trend Analysis
- 6.1. Market Analysis, Insights and Forecast - by Production Analysis
- 7. South America Agricultural Disinfectants Industry Analysis, Insights and Forecast, 2019-2031
- 7.1. Market Analysis, Insights and Forecast - by Production Analysis
- 7.2. Market Analysis, Insights and Forecast - by Consumption Analysis
- 7.3. Market Analysis, Insights and Forecast - by Import Market Analysis (Value & Volume)
- 7.4. Market Analysis, Insights and Forecast - by Export Market Analysis (Value & Volume)
- 7.5. Market Analysis, Insights and Forecast - by Price Trend Analysis
- 7.1. Market Analysis, Insights and Forecast - by Production Analysis
- 8. Europe Agricultural Disinfectants Industry Analysis, Insights and Forecast, 2019-2031
- 8.1. Market Analysis, Insights and Forecast - by Production Analysis
- 8.2. Market Analysis, Insights and Forecast - by Consumption Analysis
- 8.3. Market Analysis, Insights and Forecast - by Import Market Analysis (Value & Volume)
- 8.4. Market Analysis, Insights and Forecast - by Export Market Analysis (Value & Volume)
- 8.5. Market Analysis, Insights and Forecast - by Price Trend Analysis
- 8.1. Market Analysis, Insights and Forecast - by Production Analysis
- 9. Middle East & Africa Agricultural Disinfectants Industry Analysis, Insights and Forecast, 2019-2031
- 9.1. Market Analysis, Insights and Forecast - by Production Analysis
- 9.2. Market Analysis, Insights and Forecast - by Consumption Analysis
- 9.3. Market Analysis, Insights and Forecast - by Import Market Analysis (Value & Volume)
- 9.4. Market Analysis, Insights and Forecast - by Export Market Analysis (Value & Volume)
- 9.5. Market Analysis, Insights and Forecast - by Price Trend Analysis
- 9.1. Market Analysis, Insights and Forecast - by Production Analysis
- 10. Asia Pacific Agricultural Disinfectants Industry Analysis, Insights and Forecast, 2019-2031
- 10.1. Market Analysis, Insights and Forecast - by Production Analysis
- 10.2. Market Analysis, Insights and Forecast - by Consumption Analysis
- 10.3. Market Analysis, Insights and Forecast - by Import Market Analysis (Value & Volume)
- 10.4. Market Analysis, Insights and Forecast - by Export Market Analysis (Value & Volume)
- 10.5. Market Analysis, Insights and Forecast - by Price Trend Analysis
- 10.1. Market Analysis, Insights and Forecast - by Production Analysis
- 11. North America Agricultural Disinfectants Industry Analysis, Insights and Forecast, 2019-2031
- 11.1. Market Analysis, Insights and Forecast - By Country/Sub-region
- 11.1.1 United States
- 11.1.2 Canada
- 11.1.3 Mexico
- 11.1.4 Rest of North America
- 12. Europe Agricultural Disinfectants Industry Analysis, Insights and Forecast, 2019-2031
- 12.1. Market Analysis, Insights and Forecast - By Country/Sub-region
- 12.1.1 Spain
- 12.1.2 United Kingdom
- 12.1.3 France
- 12.1.4 Germany
- 12.1.5 Russia
- 12.1.6 Italy
- 12.1.7 Rest of Europe
- 13. Asia Pacific Agricultural Disinfectants Industry Analysis, Insights and Forecast, 2019-2031
- 13.1. Market Analysis, Insights and Forecast - By Country/Sub-region
- 13.1.1 China
- 13.1.2 Japan
- 13.1.3 India
- 13.1.4 Australia
- 13.1.5 Rest of Asia Pacific
- 14. South America Agricultural Disinfectants Industry Analysis, Insights and Forecast, 2019-2031
- 14.1. Market Analysis, Insights and Forecast - By Country/Sub-region
- 14.1.1 Brazil
- 14.1.2 Argentina
- 14.1.3 Rest of South America
- 15. Middle East and Africa Agricultural Disinfectants Industry Analysis, Insights and Forecast, 2019-2031
- 15.1. Market Analysis, Insights and Forecast - By Country/Sub-region
- 15.1.1 South Africa
- 15.1.2 Saudi Arabia
- 15.1.3 Rest of Middle East and Africa
- 16. Competitive Analysis
- 16.1. Global Market Share Analysis 2024
- 16.2. Company Profiles
- 16.2.1 Zoetis Services LLC
- 16.2.1.1. Overview
- 16.2.1.2. Products
- 16.2.1.3. SWOT Analysis
- 16.2.1.4. Recent Developments
- 16.2.1.5. Financials (Based on Availability)
- 16.2.2 Lanxess AG
- 16.2.2.1. Overview
- 16.2.2.2. Products
- 16.2.2.3. SWOT Analysis
- 16.2.2.4. Recent Developments
- 16.2.2.5. Financials (Based on Availability)
- 16.2.3 Bayer Cropscience A
- 16.2.3.1. Overview
- 16.2.3.2. Products
- 16.2.3.3. SWOT Analysis
- 16.2.3.4. Recent Developments
- 16.2.3.5. Financials (Based on Availability)
- 16.2.4 Entaco NV
- 16.2.4.1. Overview
- 16.2.4.2. Products
- 16.2.4.3. SWOT Analysis
- 16.2.4.4. Recent Developments
- 16.2.4.5. Financials (Based on Availability)
- 16.2.5 Nufarm Limited
- 16.2.5.1. Overview
- 16.2.5.2. Products
- 16.2.5.3. SWOT Analysis
- 16.2.5.4. Recent Developments
- 16.2.5.5. Financials (Based on Availability)
- 16.2.6 Corteva Agri Science
- 16.2.6.1. Overview
- 16.2.6.2. Products
- 16.2.6.3. SWOT Analysis
- 16.2.6.4. Recent Developments
- 16.2.6.5. Financials (Based on Availability)
- 16.2.7 Stepan Company
- 16.2.7.1. Overview
- 16.2.7.2. Products
- 16.2.7.3. SWOT Analysis
- 16.2.7.4. Recent Developments
- 16.2.7.5. Financials (Based on Availability)
- 16.2.8 Neogen Corporation
- 16.2.8.1. Overview
- 16.2.8.2. Products
- 16.2.8.3. SWOT Analysis
- 16.2.8.4. Recent Developments
- 16.2.8.5. Financials (Based on Availability)
- 16.2.9 Thymox Technology
- 16.2.9.1. Overview
- 16.2.9.2. Products
- 16.2.9.3. SWOT Analysis
- 16.2.9.4. Recent Developments
- 16.2.9.5. Financials (Based on Availability)
- 16.2.10 Ceva Sante Animale Group
- 16.2.10.1. Overview
- 16.2.10.2. Products
- 16.2.10.3. SWOT Analysis
- 16.2.10.4. Recent Developments
- 16.2.10.5. Financials (Based on Availability)
- 16.2.1 Zoetis Services LLC
List of Figures
- Figure 1: Global Agricultural Disinfectants Industry Revenue Breakdown (Million, %) by Region 2024 & 2032
- Figure 2: North America Agricultural Disinfectants Industry Revenue (Million), by Country 2024 & 2032
- Figure 3: North America Agricultural Disinfectants Industry Revenue Share (%), by Country 2024 & 2032
- Figure 4: Europe Agricultural Disinfectants Industry Revenue (Million), by Country 2024 & 2032
- Figure 5: Europe Agricultural Disinfectants Industry Revenue Share (%), by Country 2024 & 2032
- Figure 6: Asia Pacific Agricultural Disinfectants Industry Revenue (Million), by Country 2024 & 2032
- Figure 7: Asia Pacific Agricultural Disinfectants Industry Revenue Share (%), by Country 2024 & 2032
- Figure 8: South America Agricultural Disinfectants Industry Revenue (Million), by Country 2024 & 2032
- Figure 9: South America Agricultural Disinfectants Industry Revenue Share (%), by Country 2024 & 2032
- Figure 10: Middle East and Africa Agricultural Disinfectants Industry Revenue (Million), by Country 2024 & 2032
- Figure 11: Middle East and Africa Agricultural Disinfectants Industry Revenue Share (%), by Country 2024 & 2032
- Figure 12: North America Agricultural Disinfectants Industry Revenue (Million), by Production Analysis 2024 & 2032
- Figure 13: North America Agricultural Disinfectants Industry Revenue Share (%), by Production Analysis 2024 & 2032
- Figure 14: North America Agricultural Disinfectants Industry Revenue (Million), by Consumption Analysis 2024 & 2032
- Figure 15: North America Agricultural Disinfectants Industry Revenue Share (%), by Consumption Analysis 2024 & 2032
- Figure 16: North America Agricultural Disinfectants Industry Revenue (Million), by Import Market Analysis (Value & Volume) 2024 & 2032
- Figure 17: North America Agricultural Disinfectants Industry Revenue Share (%), by Import Market Analysis (Value & Volume) 2024 & 2032
- Figure 18: North America Agricultural Disinfectants Industry Revenue (Million), by Export Market Analysis (Value & Volume) 2024 & 2032
- Figure 19: North America Agricultural Disinfectants Industry Revenue Share (%), by Export Market Analysis (Value & Volume) 2024 & 2032
- Figure 20: North America Agricultural Disinfectants Industry Revenue (Million), by Price Trend Analysis 2024 & 2032
- Figure 21: North America Agricultural Disinfectants Industry Revenue Share (%), by Price Trend Analysis 2024 & 2032
- Figure 22: North America Agricultural Disinfectants Industry Revenue (Million), by Country 2024 & 2032
- Figure 23: North America Agricultural Disinfectants Industry Revenue Share (%), by Country 2024 & 2032
- Figure 24: South America Agricultural Disinfectants Industry Revenue (Million), by Production Analysis 2024 & 2032
- Figure 25: South America Agricultural Disinfectants Industry Revenue Share (%), by Production Analysis 2024 & 2032
- Figure 26: South America Agricultural Disinfectants Industry Revenue (Million), by Consumption Analysis 2024 & 2032
- Figure 27: South America Agricultural Disinfectants Industry Revenue Share (%), by Consumption Analysis 2024 & 2032
- Figure 28: South America Agricultural Disinfectants Industry Revenue (Million), by Import Market Analysis (Value & Volume) 2024 & 2032
- Figure 29: South America Agricultural Disinfectants Industry Revenue Share (%), by Import Market Analysis (Value & Volume) 2024 & 2032
- Figure 30: South America Agricultural Disinfectants Industry Revenue (Million), by Export Market Analysis (Value & Volume) 2024 & 2032
- Figure 31: South America Agricultural Disinfectants Industry Revenue Share (%), by Export Market Analysis (Value & Volume) 2024 & 2032
- Figure 32: South America Agricultural Disinfectants Industry Revenue (Million), by Price Trend Analysis 2024 & 2032
- Figure 33: South America Agricultural Disinfectants Industry Revenue Share (%), by Price Trend Analysis 2024 & 2032
- Figure 34: South America Agricultural Disinfectants Industry Revenue (Million), by Country 2024 & 2032
- Figure 35: South America Agricultural Disinfectants Industry Revenue Share (%), by Country 2024 & 2032
- Figure 36: Europe Agricultural Disinfectants Industry Revenue (Million), by Production Analysis 2024 & 2032
- Figure 37: Europe Agricultural Disinfectants Industry Revenue Share (%), by Production Analysis 2024 & 2032
- Figure 38: Europe Agricultural Disinfectants Industry Revenue (Million), by Consumption Analysis 2024 & 2032
- Figure 39: Europe Agricultural Disinfectants Industry Revenue Share (%), by Consumption Analysis 2024 & 2032
- Figure 40: Europe Agricultural Disinfectants Industry Revenue (Million), by Import Market Analysis (Value & Volume) 2024 & 2032
- Figure 41: Europe Agricultural Disinfectants Industry Revenue Share (%), by Import Market Analysis (Value & Volume) 2024 & 2032
- Figure 42: Europe Agricultural Disinfectants Industry Revenue (Million), by Export Market Analysis (Value & Volume) 2024 & 2032
- Figure 43: Europe Agricultural Disinfectants Industry Revenue Share (%), by Export Market Analysis (Value & Volume) 2024 & 2032
- Figure 44: Europe Agricultural Disinfectants Industry Revenue (Million), by Price Trend Analysis 2024 & 2032
- Figure 45: Europe Agricultural Disinfectants Industry Revenue Share (%), by Price Trend Analysis 2024 & 2032
- Figure 46: Europe Agricultural Disinfectants Industry Revenue (Million), by Country 2024 & 2032
- Figure 47: Europe Agricultural Disinfectants Industry Revenue Share (%), by Country 2024 & 2032
- Figure 48: Middle East & Africa Agricultural Disinfectants Industry Revenue (Million), by Production Analysis 2024 & 2032
- Figure 49: Middle East & Africa Agricultural Disinfectants Industry Revenue Share (%), by Production Analysis 2024 & 2032
- Figure 50: Middle East & Africa Agricultural Disinfectants Industry Revenue (Million), by Consumption Analysis 2024 & 2032
- Figure 51: Middle East & Africa Agricultural Disinfectants Industry Revenue Share (%), by Consumption Analysis 2024 & 2032
- Figure 52: Middle East & Africa Agricultural Disinfectants Industry Revenue (Million), by Import Market Analysis (Value & Volume) 2024 & 2032
- Figure 53: Middle East & Africa Agricultural Disinfectants Industry Revenue Share (%), by Import Market Analysis (Value & Volume) 2024 & 2032
- Figure 54: Middle East & Africa Agricultural Disinfectants Industry Revenue (Million), by Export Market Analysis (Value & Volume) 2024 & 2032
- Figure 55: Middle East & Africa Agricultural Disinfectants Industry Revenue Share (%), by Export Market Analysis (Value & Volume) 2024 & 2032
- Figure 56: Middle East & Africa Agricultural Disinfectants Industry Revenue (Million), by Price Trend Analysis 2024 & 2032
- Figure 57: Middle East & Africa Agricultural Disinfectants Industry Revenue Share (%), by Price Trend Analysis 2024 & 2032
- Figure 58: Middle East & Africa Agricultural Disinfectants Industry Revenue (Million), by Country 2024 & 2032
- Figure 59: Middle East & Africa Agricultural Disinfectants Industry Revenue Share (%), by Country 2024 & 2032
- Figure 60: Asia Pacific Agricultural Disinfectants Industry Revenue (Million), by Production Analysis 2024 & 2032
- Figure 61: Asia Pacific Agricultural Disinfectants Industry Revenue Share (%), by Production Analysis 2024 & 2032
- Figure 62: Asia Pacific Agricultural Disinfectants Industry Revenue (Million), by Consumption Analysis 2024 & 2032
- Figure 63: Asia Pacific Agricultural Disinfectants Industry Revenue Share (%), by Consumption Analysis 2024 & 2032
- Figure 64: Asia Pacific Agricultural Disinfectants Industry Revenue (Million), by Import Market Analysis (Value & Volume) 2024 & 2032
- Figure 65: Asia Pacific Agricultural Disinfectants Industry Revenue Share (%), by Import Market Analysis (Value & Volume) 2024 & 2032
- Figure 66: Asia Pacific Agricultural Disinfectants Industry Revenue (Million), by Export Market Analysis (Value & Volume) 2024 & 2032
- Figure 67: Asia Pacific Agricultural Disinfectants Industry Revenue Share (%), by Export Market Analysis (Value & Volume) 2024 & 2032
- Figure 68: Asia Pacific Agricultural Disinfectants Industry Revenue (Million), by Price Trend Analysis 2024 & 2032
- Figure 69: Asia Pacific Agricultural Disinfectants Industry Revenue Share (%), by Price Trend Analysis 2024 & 2032
- Figure 70: Asia Pacific Agricultural Disinfectants Industry Revenue (Million), by Country 2024 & 2032
- Figure 71: Asia Pacific Agricultural Disinfectants Industry Revenue Share (%), by Country 2024 & 2032
List of Tables
- Table 1: Global Agricultural Disinfectants Industry Revenue Million Forecast, by Region 2019 & 2032
- Table 2: Global Agricultural Disinfectants Industry Revenue Million Forecast, by Production Analysis 2019 & 2032
- Table 3: Global Agricultural Disinfectants Industry Revenue Million Forecast, by Consumption Analysis 2019 & 2032
- Table 4: Global Agricultural Disinfectants Industry Revenue Million Forecast, by Import Market Analysis (Value & Volume) 2019 & 2032
- Table 5: Global Agricultural Disinfectants Industry Revenue Million Forecast, by Export Market Analysis (Value & Volume) 2019 & 2032
- Table 6: Global Agricultural Disinfectants Industry Revenue Million Forecast, by Price Trend Analysis 2019 & 2032
- Table 7: Global Agricultural Disinfectants Industry Revenue Million Forecast, by Region 2019 & 2032
- Table 8: Global Agricultural Disinfectants Industry Revenue Million Forecast, by Country 2019 & 2032
- Table 9: United States Agricultural Disinfectants Industry Revenue (Million) Forecast, by Application 2019 & 2032
- Table 10: Canada Agricultural Disinfectants Industry Revenue (Million) Forecast, by Application 2019 & 2032
- Table 11: Mexico Agricultural Disinfectants Industry Revenue (Million) Forecast, by Application 2019 & 2032
- Table 12: Rest of North America Agricultural Disinfectants Industry Revenue (Million) Forecast, by Application 2019 & 2032
- Table 13: Global Agricultural Disinfectants Industry Revenue Million Forecast, by Country 2019 & 2032
- Table 14: Spain Agricultural Disinfectants Industry Revenue (Million) Forecast, by Application 2019 & 2032
- Table 15: United Kingdom Agricultural Disinfectants Industry Revenue (Million) Forecast, by Application 2019 & 2032
- Table 16: France Agricultural Disinfectants Industry Revenue (Million) Forecast, by Application 2019 & 2032
- Table 17: Germany Agricultural Disinfectants Industry Revenue (Million) Forecast, by Application 2019 & 2032
- Table 18: Russia Agricultural Disinfectants Industry Revenue (Million) Forecast, by Application 2019 & 2032
- Table 19: Italy Agricultural Disinfectants Industry Revenue (Million) Forecast, by Application 2019 & 2032
- Table 20: Rest of Europe Agricultural Disinfectants Industry Revenue (Million) Forecast, by Application 2019 & 2032
- Table 21: Global Agricultural Disinfectants Industry Revenue Million Forecast, by Country 2019 & 2032
- Table 22: China Agricultural Disinfectants Industry Revenue (Million) Forecast, by Application 2019 & 2032
- Table 23: Japan Agricultural Disinfectants Industry Revenue (Million) Forecast, by Application 2019 & 2032
- Table 24: India Agricultural Disinfectants Industry Revenue (Million) Forecast, by Application 2019 & 2032
- Table 25: Australia Agricultural Disinfectants Industry Revenue (Million) Forecast, by Application 2019 & 2032
- Table 26: Rest of Asia Pacific Agricultural Disinfectants Industry Revenue (Million) Forecast, by Application 2019 & 2032
- Table 27: Global Agricultural Disinfectants Industry Revenue Million Forecast, by Country 2019 & 2032
- Table 28: Brazil Agricultural Disinfectants Industry Revenue (Million) Forecast, by Application 2019 & 2032
- Table 29: Argentina Agricultural Disinfectants Industry Revenue (Million) Forecast, by Application 2019 & 2032
- Table 30: Rest of South America Agricultural Disinfectants Industry Revenue (Million) Forecast, by Application 2019 & 2032
- Table 31: Global Agricultural Disinfectants Industry Revenue Million Forecast, by Country 2019 & 2032
- Table 32: South Africa Agricultural Disinfectants Industry Revenue (Million) Forecast, by Application 2019 & 2032
- Table 33: Saudi Arabia Agricultural Disinfectants Industry Revenue (Million) Forecast, by Application 2019 & 2032
- Table 34: Rest of Middle East and Africa Agricultural Disinfectants Industry Revenue (Million) Forecast, by Application 2019 & 2032
- Table 35: Global Agricultural Disinfectants Industry Revenue Million Forecast, by Production Analysis 2019 & 2032
- Table 36: Global Agricultural Disinfectants Industry Revenue Million Forecast, by Consumption Analysis 2019 & 2032
- Table 37: Global Agricultural Disinfectants Industry Revenue Million Forecast, by Import Market Analysis (Value & Volume) 2019 & 2032
- Table 38: Global Agricultural Disinfectants Industry Revenue Million Forecast, by Export Market Analysis (Value & Volume) 2019 & 2032
- Table 39: Global Agricultural Disinfectants Industry Revenue Million Forecast, by Price Trend Analysis 2019 & 2032
- Table 40: Global Agricultural Disinfectants Industry Revenue Million Forecast, by Country 2019 & 2032
- Table 41: United States Agricultural Disinfectants Industry Revenue (Million) Forecast, by Application 2019 & 2032
- Table 42: Canada Agricultural Disinfectants Industry Revenue (Million) Forecast, by Application 2019 & 2032
- Table 43: Mexico Agricultural Disinfectants Industry Revenue (Million) Forecast, by Application 2019 & 2032
- Table 44: Global Agricultural Disinfectants Industry Revenue Million Forecast, by Production Analysis 2019 & 2032
- Table 45: Global Agricultural Disinfectants Industry Revenue Million Forecast, by Consumption Analysis 2019 & 2032
- Table 46: Global Agricultural Disinfectants Industry Revenue Million Forecast, by Import Market Analysis (Value & Volume) 2019 & 2032
- Table 47: Global Agricultural Disinfectants Industry Revenue Million Forecast, by Export Market Analysis (Value & Volume) 2019 & 2032
- Table 48: Global Agricultural Disinfectants Industry Revenue Million Forecast, by Price Trend Analysis 2019 & 2032
- Table 49: Global Agricultural Disinfectants Industry Revenue Million Forecast, by Country 2019 & 2032
- Table 50: Brazil Agricultural Disinfectants Industry Revenue (Million) Forecast, by Application 2019 & 2032
- Table 51: Argentina Agricultural Disinfectants Industry Revenue (Million) Forecast, by Application 2019 & 2032
- Table 52: Rest of South America Agricultural Disinfectants Industry Revenue (Million) Forecast, by Application 2019 & 2032
- Table 53: Global Agricultural Disinfectants Industry Revenue Million Forecast, by Production Analysis 2019 & 2032
- Table 54: Global Agricultural Disinfectants Industry Revenue Million Forecast, by Consumption Analysis 2019 & 2032
- Table 55: Global Agricultural Disinfectants Industry Revenue Million Forecast, by Import Market Analysis (Value & Volume) 2019 & 2032
- Table 56: Global Agricultural Disinfectants Industry Revenue Million Forecast, by Export Market Analysis (Value & Volume) 2019 & 2032
- Table 57: Global Agricultural Disinfectants Industry Revenue Million Forecast, by Price Trend Analysis 2019 & 2032
- Table 58: Global Agricultural Disinfectants Industry Revenue Million Forecast, by Country 2019 & 2032
- Table 59: United Kingdom Agricultural Disinfectants Industry Revenue (Million) Forecast, by Application 2019 & 2032
- Table 60: Germany Agricultural Disinfectants Industry Revenue (Million) Forecast, by Application 2019 & 2032
- Table 61: France Agricultural Disinfectants Industry Revenue (Million) Forecast, by Application 2019 & 2032
- Table 62: Italy Agricultural Disinfectants Industry Revenue (Million) Forecast, by Application 2019 & 2032
- Table 63: Spain Agricultural Disinfectants Industry Revenue (Million) Forecast, by Application 2019 & 2032
- Table 64: Russia Agricultural Disinfectants Industry Revenue (Million) Forecast, by Application 2019 & 2032
- Table 65: Benelux Agricultural Disinfectants Industry Revenue (Million) Forecast, by Application 2019 & 2032
- Table 66: Nordics Agricultural Disinfectants Industry Revenue (Million) Forecast, by Application 2019 & 2032
- Table 67: Rest of Europe Agricultural Disinfectants Industry Revenue (Million) Forecast, by Application 2019 & 2032
- Table 68: Global Agricultural Disinfectants Industry Revenue Million Forecast, by Production Analysis 2019 & 2032
- Table 69: Global Agricultural Disinfectants Industry Revenue Million Forecast, by Consumption Analysis 2019 & 2032
- Table 70: Global Agricultural Disinfectants Industry Revenue Million Forecast, by Import Market Analysis (Value & Volume) 2019 & 2032
- Table 71: Global Agricultural Disinfectants Industry Revenue Million Forecast, by Export Market Analysis (Value & Volume) 2019 & 2032
- Table 72: Global Agricultural Disinfectants Industry Revenue Million Forecast, by Price Trend Analysis 2019 & 2032
- Table 73: Global Agricultural Disinfectants Industry Revenue Million Forecast, by Country 2019 & 2032
- Table 74: Turkey Agricultural Disinfectants Industry Revenue (Million) Forecast, by Application 2019 & 2032
- Table 75: Israel Agricultural Disinfectants Industry Revenue (Million) Forecast, by Application 2019 & 2032
- Table 76: GCC Agricultural Disinfectants Industry Revenue (Million) Forecast, by Application 2019 & 2032
- Table 77: North Africa Agricultural Disinfectants Industry Revenue (Million) Forecast, by Application 2019 & 2032
- Table 78: South Africa Agricultural Disinfectants Industry Revenue (Million) Forecast, by Application 2019 & 2032
- Table 79: Rest of Middle East & Africa Agricultural Disinfectants Industry Revenue (Million) Forecast, by Application 2019 & 2032
- Table 80: Global Agricultural Disinfectants Industry Revenue Million Forecast, by Production Analysis 2019 & 2032
- Table 81: Global Agricultural Disinfectants Industry Revenue Million Forecast, by Consumption Analysis 2019 & 2032
- Table 82: Global Agricultural Disinfectants Industry Revenue Million Forecast, by Import Market Analysis (Value & Volume) 2019 & 2032
- Table 83: Global Agricultural Disinfectants Industry Revenue Million Forecast, by Export Market Analysis (Value & Volume) 2019 & 2032
- Table 84: Global Agricultural Disinfectants Industry Revenue Million Forecast, by Price Trend Analysis 2019 & 2032
- Table 85: Global Agricultural Disinfectants Industry Revenue Million Forecast, by Country 2019 & 2032
- Table 86: China Agricultural Disinfectants Industry Revenue (Million) Forecast, by Application 2019 & 2032
- Table 87: India Agricultural Disinfectants Industry Revenue (Million) Forecast, by Application 2019 & 2032
- Table 88: Japan Agricultural Disinfectants Industry Revenue (Million) Forecast, by Application 2019 & 2032
- Table 89: South Korea Agricultural Disinfectants Industry Revenue (Million) Forecast, by Application 2019 & 2032
- Table 90: ASEAN Agricultural Disinfectants Industry Revenue (Million) Forecast, by Application 2019 & 2032
- Table 91: Oceania Agricultural Disinfectants Industry Revenue (Million) Forecast, by Application 2019 & 2032
- Table 92: Rest of Asia Pacific Agricultural Disinfectants Industry Revenue (Million) Forecast, by Application 2019 & 2032
Frequently Asked Questions
1. What is the projected Compound Annual Growth Rate (CAGR) of the Agricultural Disinfectants Industry?
The projected CAGR is approximately 4.30%.
2. Which companies are prominent players in the Agricultural Disinfectants Industry?
Key companies in the market include Zoetis Services LLC, Lanxess AG, Bayer Cropscience A, Entaco NV, Nufarm Limited, Corteva Agri Science, Stepan Company, Neogen Corporation, Thymox Technology, Ceva Sante Animale Group.
3. What are the main segments of the Agricultural Disinfectants Industry?
The market segments include Production Analysis, Consumption Analysis, Import Market Analysis (Value & Volume), Export Market Analysis (Value & Volume), Price Trend Analysis.
4. Can you provide details about the market size?
The market size is estimated to be USD 2.29 Million as of 2022.
5. What are some drivers contributing to market growth?
Skilled Labor Shortage; Favorable Government Policies.
6. What are the notable trends driving market growth?
Growing Area Under Protected Cultivation.
7. Are there any restraints impacting market growth?
Fragmentation of Land Holdings; Increasing Interest of Farmers Toward Custom Hiring Center.
8. Can you provide examples of recent developments in the market?
In 2021, Ceva Santé Animale Group and INRAE Technologies signed an agreement to consolidate their collaboration in animal health. This collaboration will focus on the animal, human, and environmental health. It will particularly focus on the prevention of infectious diseases of animal origin and the improvement of animal welfare.
9. What pricing options are available for accessing the report?
Pricing options include single-user, multi-user, and enterprise licenses priced at USD 4750, USD 5250, and USD 8750 respectively.
10. Is the market size provided in terms of value or volume?
The market size is provided in terms of value, measured in Million.
11. Are there any specific market keywords associated with the report?
Yes, the market keyword associated with the report is "Agricultural Disinfectants Industry," which aids in identifying and referencing the specific market segment covered.
12. How do I determine which pricing option suits my needs best?
The pricing options vary based on user requirements and access needs. Individual users may opt for single-user licenses, while businesses requiring broader access may choose multi-user or enterprise licenses for cost-effective access to the report.
13. Are there any additional resources or data provided in the Agricultural Disinfectants Industry report?
While the report offers comprehensive insights, it's advisable to review the specific contents or supplementary materials provided to ascertain if additional resources or data are available.
14. How can I stay updated on further developments or reports in the Agricultural Disinfectants Industry?
To stay informed about further developments, trends, and reports in the Agricultural Disinfectants Industry, consider subscribing to industry newsletters, following relevant companies and organizations, or regularly checking reputable industry news sources and publications.
Methodology
Step 1 - Identification of Relevant Samples Size from Population Database


Step 2 - Approaches for Defining Global Market Size (Value, Volume* & Price*)

Note*: In applicable scenarios
Step 3 - Data Sources
Primary Research
- Web Analytics
- Survey Reports
- Research Institute
- Latest Research Reports
- Opinion Leaders
Secondary Research
- Annual Reports
- White Paper
- Latest Press Release
- Industry Association
- Paid Database
- Investor Presentations

Step 4 - Data Triangulation
Involves using different sources of information in order to increase the validity of a study
These sources are likely to be stakeholders in a program - participants, other researchers, program staff, other community members, and so on.
Then we put all data in single framework & apply various statistical tools to find out the dynamic on the market.
During the analysis stage, feedback from the stakeholder groups would be compared to determine areas of agreement as well as areas of divergence
