

Key Insights
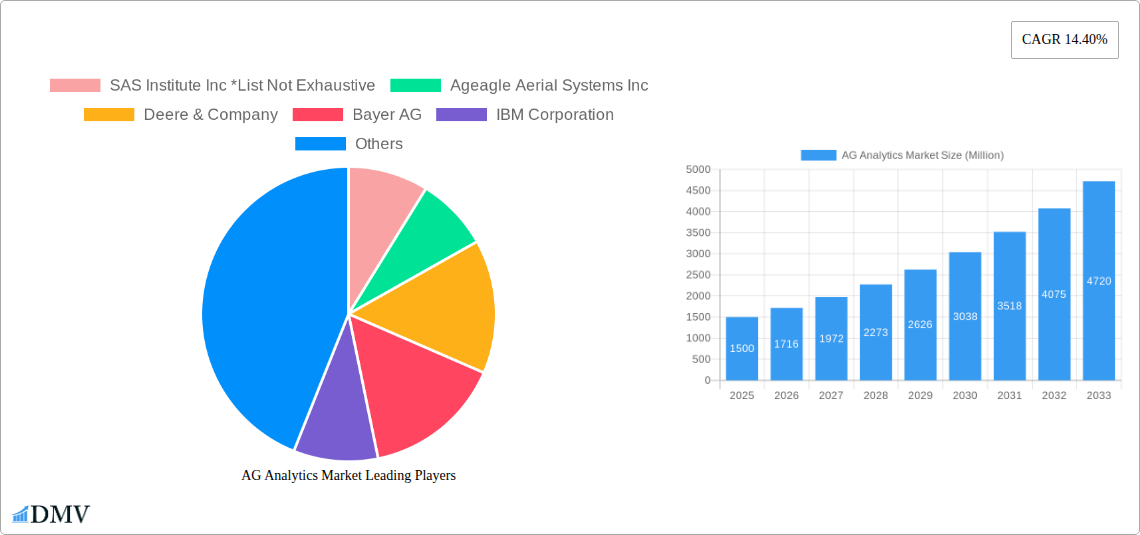
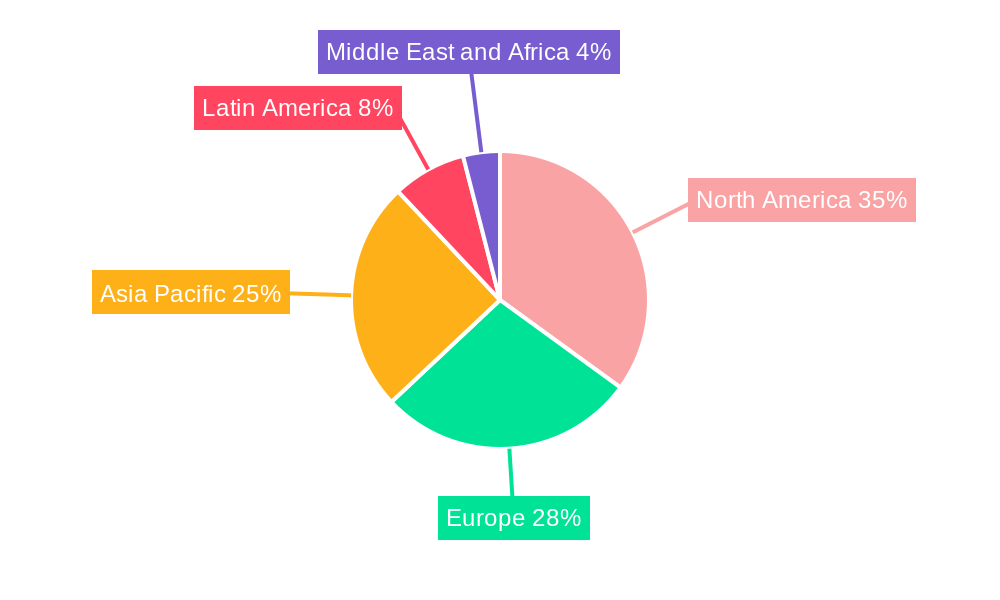
The global agricultural analytics market is experiencing robust growth, driven by the increasing adoption of precision agriculture techniques and the growing need for data-driven decision-making in farming. A Compound Annual Growth Rate (CAGR) of 14.40% from 2019 to 2024 indicates a significant upward trajectory. This growth is fueled by several key factors: the rising demand for increased crop yields in the face of growing global populations and limited arable land, the expanding availability of affordable sensors and IoT devices enabling data collection, and the increasing sophistication of analytical tools capable of extracting actionable insights from complex agricultural datasets. The market is segmented by deployment type (on-premise, cloud), farm size (small and medium, large), component type (solutions, services), and type of analytics (farm analytics, livestock analytics). Cloud-based solutions are gaining significant traction due to their scalability, accessibility, and cost-effectiveness. Large farms are currently the dominant segment, but increasing adoption among small and medium farms is expected to contribute to substantial market expansion in the coming years. The services segment, encompassing consulting and implementation services, is witnessing substantial growth as farmers seek expert assistance in leveraging agricultural analytics effectively. North America and Europe currently hold the largest market share, but the Asia-Pacific region is projected to show significant growth potential driven by rising agricultural investment and technological advancements.
The market faces certain restraints including the high initial investment costs associated with implementing agricultural analytics technologies, the need for reliable internet connectivity in many agricultural regions, and the data privacy and security concerns associated with handling sensitive agricultural data. However, ongoing technological advancements, such as the development of more affordable and user-friendly solutions, coupled with increased government support for digital agriculture initiatives, are expected to mitigate these challenges. Leading companies such as Deere & Company, IBM Corporation, and SAS Institute Inc. are driving innovation and competition in the market, further accelerating its growth. The forecast period from 2025 to 2033 anticipates continued expansion based on the present market dynamics, with a potential increase in market size driven by sustained technological innovation, increased government funding and rising farmer awareness of precision agriculture's benefits.
AG Analytics Market: A Comprehensive Report (2019-2033)
This insightful report provides a detailed analysis of the global AG Analytics market, offering a comprehensive overview of its current state, future trajectory, and key players. Covering the period from 2019 to 2033, with a base year of 2025 and a forecast period extending to 2033, this report is an invaluable resource for stakeholders seeking to understand and capitalize on the opportunities within this rapidly evolving sector. The market is projected to reach xx Million by 2033, representing substantial growth from xx Million in 2025.
AG Analytics Market Market Composition & Trends
The AG Analytics market exhibits a moderately concentrated landscape, with key players like SAS Institute Inc, Deere & Company, and Bayer AG holding significant market share. However, the market is dynamic, characterized by continuous innovation and strategic mergers and acquisitions (M&A). The increasing adoption of precision agriculture techniques and the growing need for data-driven decision-making are primary drivers of market growth.
- Market Concentration: The top 5 players account for approximately xx% of the market share in 2025.
- Innovation Catalysts: Advancements in AI, IoT, and cloud computing are fueling the development of sophisticated analytics solutions.
- Regulatory Landscape: Government initiatives promoting sustainable agriculture and digitalization are creating favorable market conditions.
- Substitute Products: Traditional farming practices pose a competitive challenge, but the superior efficiency of AG Analytics is driving adoption.
- End-User Profiles: Large farms are currently the largest segment, but the market is expanding rapidly to include small and medium farms.
- M&A Activities: The past five years have witnessed xx M&A deals, with an average deal value of xx Million, indicating considerable consolidation within the sector.
AG Analytics Market Industry Evolution
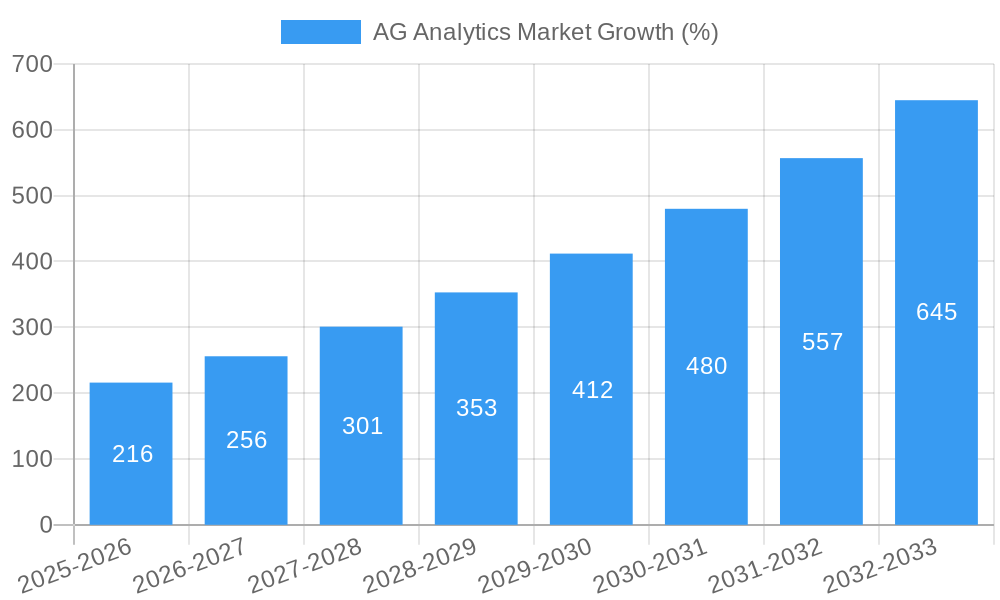
The AG Analytics market has experienced remarkable growth over the past five years (2019-2024), with a Compound Annual Growth Rate (CAGR) of xx%. This growth is attributable to several factors including increased awareness of the benefits of data-driven decision-making, advancements in sensor technology, and improved data analytics capabilities. The market is shifting towards cloud-based solutions, offering enhanced scalability and accessibility. The demand for livestock analytics is also growing rapidly, fueled by the increasing need for efficient livestock management. Adoption rates have increased significantly, with xx% of large farms and xx% of small and medium farms currently utilizing AG Analytics solutions in 2025. This trend is projected to continue throughout the forecast period.
Leading Regions, Countries, or Segments in AG Analytics Market
North America currently dominates the AG Analytics market, driven by high technology adoption rates, significant investments in agricultural technology, and supportive regulatory frameworks. However, regions like Europe and Asia-Pacific are showing strong growth potential.
- Deployment Type: Cloud-based solutions are gaining traction due to their flexibility and cost-effectiveness.
- Farm Size: Large farms represent the largest segment, due to their higher capital expenditure capacity and greater need for optimized operations.
- Component Type: The demand for both solutions and services is significant, with a slight preference towards integrated solutions.
- Type: Farm analytics is currently the larger segment, but livestock analytics is demonstrating rapid growth.
Key Drivers:
- High investment in agricultural research and development
- Government incentives for technology adoption
- Growing awareness of precision agriculture benefits
AG Analytics Market Product Innovations
Recent innovations in AG Analytics include the integration of AI-powered predictive models for crop yield forecasting, the development of drone-based solutions for remote field monitoring, and the use of blockchain technology to enhance data security and traceability. These advancements offer improved accuracy, efficiency, and cost savings for farmers, leading to increased adoption and market expansion. Unique selling propositions often center around ease of use, data visualization capabilities, and integration with existing farm management systems.
Propelling Factors for AG Analytics Market Growth
Several factors are driving the growth of the AG Analytics market. Technological advancements, such as the proliferation of IoT sensors and the development of sophisticated analytical algorithms, are significantly improving the accuracy and efficiency of data-driven farming practices. Economic factors, such as the increasing cost of labor and the growing demand for higher agricultural yields, are also fueling the demand for AG Analytics solutions. Lastly, supportive government policies and regulations aimed at promoting sustainable and efficient agriculture are creating a favorable environment for market expansion.
Obstacles in the AG Analytics Market Market
Despite the promising outlook, the AG Analytics market faces several challenges. High initial investment costs, particularly for smaller farms, can be a barrier to entry. Data security and privacy concerns remain a significant issue, especially with the increased reliance on cloud-based solutions. Furthermore, intense competition from established players and the emergence of new entrants is creating a dynamic and competitive landscape.
Future Opportunities in AG Analytics Market
Significant opportunities lie ahead for the AG Analytics market. The expansion into emerging markets, the development of more user-friendly and affordable solutions for smallholder farmers, and the integration of AG Analytics with other precision agriculture technologies present promising avenues for future growth. Moreover, the increasing focus on sustainable agriculture will drive demand for solutions that optimize resource utilization and minimize environmental impact.
Major Players in the AG Analytics Market Ecosystem
- SAS Institute Inc
- Ageagle Aerial Systems Inc
- Deere & Company
- Bayer AG
- IBM Corporation
- Conservis Corporation
- PrecisionHawk Inc
- Trimble Inc
- Vistex Inc
- Iteris Inc
- Agrivi
Key Developments in AG Analytics Market Industry
- Jan 2023: SAS Institute Inc. launched a new AI-powered solution for crop yield prediction.
- May 2022: Deere & Company acquired a precision agriculture startup, enhancing its analytics capabilities.
- Oct 2021: Bayer AG invested in a drone technology company to expand its data collection infrastructure.
- (Further developments to be added based on available data)
Strategic AG Analytics Market Market Forecast
The AG Analytics market is poised for continued strong growth, driven by technological advancements, increasing adoption rates, and supportive regulatory frameworks. The market is expected to witness significant expansion in both developed and emerging economies, particularly in regions with rapidly developing agricultural sectors. The continued focus on innovation and strategic partnerships will further shape the market landscape and drive growth in the coming years.
AG Analytics Market Segmentation
-
1. Component Type
- 1.1. Solutions
- 1.2. Services
-
2. Type
- 2.1. Farm Analytics
- 2.2. Livestock Analytics
-
3. Deployment Type
- 3.1. On-Premise
- 3.2. Cloud
-
4. Farm Size
- 4.1. Small and Medium Farms
- 4.2. Large Farms
AG Analytics Market Segmentation By Geography
- 1. North America
- 2. Europe
- 3. Asia Pacific
- 4. Latin America
- 5. Middle East and Africa
AG Analytics Market REPORT HIGHLIGHTS
| Aspects | Details |
|---|---|
| Study Period | 2019-2033 |
| Base Year | 2024 |
| Estimated Year | 2025 |
| Forecast Period | 2025-2033 |
| Historical Period | 2019-2024 |
| Growth Rate | CAGR of 14.40% from 2019-2033 |
| Segmentation |
|
Table of Contents
- 1. Introduction
- 1.1. Research Scope
- 1.2. Market Segmentation
- 1.3. Research Methodology
- 1.4. Definitions and Assumptions
- 2. Executive Summary
- 2.1. Introduction
- 3. Market Dynamics
- 3.1. Introduction
- 3.2. Market Drivers
- 3.2.1. ; Rising Usage of Cutting-edge Technology-based Solutions for Farming
- 3.3. Market Restrains
- 3.3.1. ; High Capital Cost and Complexity Regarding System Upgrades
- 3.4. Market Trends
- 3.4.1. Farm Analytics is Expected to Grow at a Significant Rate Over the Forecast Period
- 4. Market Factor Analysis
- 4.1. Porters Five Forces
- 4.2. Supply/Value Chain
- 4.3. PESTEL analysis
- 4.4. Market Entropy
- 4.5. Patent/Trademark Analysis
- 5. Global AG Analytics Market Analysis, Insights and Forecast, 2019-2031
- 5.1. Market Analysis, Insights and Forecast - by Component Type
- 5.1.1. Solutions
- 5.1.2. Services
- 5.2. Market Analysis, Insights and Forecast - by Type
- 5.2.1. Farm Analytics
- 5.2.2. Livestock Analytics
- 5.3. Market Analysis, Insights and Forecast - by Deployment Type
- 5.3.1. On-Premise
- 5.3.2. Cloud
- 5.4. Market Analysis, Insights and Forecast - by Farm Size
- 5.4.1. Small and Medium Farms
- 5.4.2. Large Farms
- 5.5. Market Analysis, Insights and Forecast - by Region
- 5.5.1. North America
- 5.5.2. Europe
- 5.5.3. Asia Pacific
- 5.5.4. Latin America
- 5.5.5. Middle East and Africa
- 5.1. Market Analysis, Insights and Forecast - by Component Type
- 6. North America AG Analytics Market Analysis, Insights and Forecast, 2019-2031
- 6.1. Market Analysis, Insights and Forecast - by Component Type
- 6.1.1. Solutions
- 6.1.2. Services
- 6.2. Market Analysis, Insights and Forecast - by Type
- 6.2.1. Farm Analytics
- 6.2.2. Livestock Analytics
- 6.3. Market Analysis, Insights and Forecast - by Deployment Type
- 6.3.1. On-Premise
- 6.3.2. Cloud
- 6.4. Market Analysis, Insights and Forecast - by Farm Size
- 6.4.1. Small and Medium Farms
- 6.4.2. Large Farms
- 6.1. Market Analysis, Insights and Forecast - by Component Type
- 7. Europe AG Analytics Market Analysis, Insights and Forecast, 2019-2031
- 7.1. Market Analysis, Insights and Forecast - by Component Type
- 7.1.1. Solutions
- 7.1.2. Services
- 7.2. Market Analysis, Insights and Forecast - by Type
- 7.2.1. Farm Analytics
- 7.2.2. Livestock Analytics
- 7.3. Market Analysis, Insights and Forecast - by Deployment Type
- 7.3.1. On-Premise
- 7.3.2. Cloud
- 7.4. Market Analysis, Insights and Forecast - by Farm Size
- 7.4.1. Small and Medium Farms
- 7.4.2. Large Farms
- 7.1. Market Analysis, Insights and Forecast - by Component Type
- 8. Asia Pacific AG Analytics Market Analysis, Insights and Forecast, 2019-2031
- 8.1. Market Analysis, Insights and Forecast - by Component Type
- 8.1.1. Solutions
- 8.1.2. Services
- 8.2. Market Analysis, Insights and Forecast - by Type
- 8.2.1. Farm Analytics
- 8.2.2. Livestock Analytics
- 8.3. Market Analysis, Insights and Forecast - by Deployment Type
- 8.3.1. On-Premise
- 8.3.2. Cloud
- 8.4. Market Analysis, Insights and Forecast - by Farm Size
- 8.4.1. Small and Medium Farms
- 8.4.2. Large Farms
- 8.1. Market Analysis, Insights and Forecast - by Component Type
- 9. Latin America AG Analytics Market Analysis, Insights and Forecast, 2019-2031
- 9.1. Market Analysis, Insights and Forecast - by Component Type
- 9.1.1. Solutions
- 9.1.2. Services
- 9.2. Market Analysis, Insights and Forecast - by Type
- 9.2.1. Farm Analytics
- 9.2.2. Livestock Analytics
- 9.3. Market Analysis, Insights and Forecast - by Deployment Type
- 9.3.1. On-Premise
- 9.3.2. Cloud
- 9.4. Market Analysis, Insights and Forecast - by Farm Size
- 9.4.1. Small and Medium Farms
- 9.4.2. Large Farms
- 9.1. Market Analysis, Insights and Forecast - by Component Type
- 10. Middle East and Africa AG Analytics Market Analysis, Insights and Forecast, 2019-2031
- 10.1. Market Analysis, Insights and Forecast - by Component Type
- 10.1.1. Solutions
- 10.1.2. Services
- 10.2. Market Analysis, Insights and Forecast - by Type
- 10.2.1. Farm Analytics
- 10.2.2. Livestock Analytics
- 10.3. Market Analysis, Insights and Forecast - by Deployment Type
- 10.3.1. On-Premise
- 10.3.2. Cloud
- 10.4. Market Analysis, Insights and Forecast - by Farm Size
- 10.4.1. Small and Medium Farms
- 10.4.2. Large Farms
- 10.1. Market Analysis, Insights and Forecast - by Component Type
- 11. North America AG Analytics Market Analysis, Insights and Forecast, 2019-2031
- 11.1. Market Analysis, Insights and Forecast - By Country/Sub-region
- 11.1.1.
- 12. Europe AG Analytics Market Analysis, Insights and Forecast, 2019-2031
- 12.1. Market Analysis, Insights and Forecast - By Country/Sub-region
- 12.1.1.
- 13. Asia Pacific AG Analytics Market Analysis, Insights and Forecast, 2019-2031
- 13.1. Market Analysis, Insights and Forecast - By Country/Sub-region
- 13.1.1.
- 14. Latin America AG Analytics Market Analysis, Insights and Forecast, 2019-2031
- 14.1. Market Analysis, Insights and Forecast - By Country/Sub-region
- 14.1.1.
- 15. Middle East and Africa AG Analytics Market Analysis, Insights and Forecast, 2019-2031
- 15.1. Market Analysis, Insights and Forecast - By Country/Sub-region
- 15.1.1.
- 16. Competitive Analysis
- 16.1. Global Market Share Analysis 2024
- 16.2. Company Profiles
- 16.2.1 SAS Institute Inc *List Not Exhaustive
- 16.2.1.1. Overview
- 16.2.1.2. Products
- 16.2.1.3. SWOT Analysis
- 16.2.1.4. Recent Developments
- 16.2.1.5. Financials (Based on Availability)
- 16.2.2 Ageagle Aerial Systems Inc
- 16.2.2.1. Overview
- 16.2.2.2. Products
- 16.2.2.3. SWOT Analysis
- 16.2.2.4. Recent Developments
- 16.2.2.5. Financials (Based on Availability)
- 16.2.3 Deere & Company
- 16.2.3.1. Overview
- 16.2.3.2. Products
- 16.2.3.3. SWOT Analysis
- 16.2.3.4. Recent Developments
- 16.2.3.5. Financials (Based on Availability)
- 16.2.4 Bayer AG
- 16.2.4.1. Overview
- 16.2.4.2. Products
- 16.2.4.3. SWOT Analysis
- 16.2.4.4. Recent Developments
- 16.2.4.5. Financials (Based on Availability)
- 16.2.5 IBM Corporation
- 16.2.5.1. Overview
- 16.2.5.2. Products
- 16.2.5.3. SWOT Analysis
- 16.2.5.4. Recent Developments
- 16.2.5.5. Financials (Based on Availability)
- 16.2.6 Conservis Corporation
- 16.2.6.1. Overview
- 16.2.6.2. Products
- 16.2.6.3. SWOT Analysis
- 16.2.6.4. Recent Developments
- 16.2.6.5. Financials (Based on Availability)
- 16.2.7 PrecisionHawk Inc
- 16.2.7.1. Overview
- 16.2.7.2. Products
- 16.2.7.3. SWOT Analysis
- 16.2.7.4. Recent Developments
- 16.2.7.5. Financials (Based on Availability)
- 16.2.8 Trimble Inc
- 16.2.8.1. Overview
- 16.2.8.2. Products
- 16.2.8.3. SWOT Analysis
- 16.2.8.4. Recent Developments
- 16.2.8.5. Financials (Based on Availability)
- 16.2.9 Vistex Inc
- 16.2.9.1. Overview
- 16.2.9.2. Products
- 16.2.9.3. SWOT Analysis
- 16.2.9.4. Recent Developments
- 16.2.9.5. Financials (Based on Availability)
- 16.2.10 Iteris Inc
- 16.2.10.1. Overview
- 16.2.10.2. Products
- 16.2.10.3. SWOT Analysis
- 16.2.10.4. Recent Developments
- 16.2.10.5. Financials (Based on Availability)
- 16.2.11 Agrivi
- 16.2.11.1. Overview
- 16.2.11.2. Products
- 16.2.11.3. SWOT Analysis
- 16.2.11.4. Recent Developments
- 16.2.11.5. Financials (Based on Availability)
- 16.2.1 SAS Institute Inc *List Not Exhaustive
List of Figures
- Figure 1: Global AG Analytics Market Revenue Breakdown (Million, %) by Region 2024 & 2032
- Figure 2: North America AG Analytics Market Revenue (Million), by Country 2024 & 2032
- Figure 3: North America AG Analytics Market Revenue Share (%), by Country 2024 & 2032
- Figure 4: Europe AG Analytics Market Revenue (Million), by Country 2024 & 2032
- Figure 5: Europe AG Analytics Market Revenue Share (%), by Country 2024 & 2032
- Figure 6: Asia Pacific AG Analytics Market Revenue (Million), by Country 2024 & 2032
- Figure 7: Asia Pacific AG Analytics Market Revenue Share (%), by Country 2024 & 2032
- Figure 8: Latin America AG Analytics Market Revenue (Million), by Country 2024 & 2032
- Figure 9: Latin America AG Analytics Market Revenue Share (%), by Country 2024 & 2032
- Figure 10: Middle East and Africa AG Analytics Market Revenue (Million), by Country 2024 & 2032
- Figure 11: Middle East and Africa AG Analytics Market Revenue Share (%), by Country 2024 & 2032
- Figure 12: North America AG Analytics Market Revenue (Million), by Component Type 2024 & 2032
- Figure 13: North America AG Analytics Market Revenue Share (%), by Component Type 2024 & 2032
- Figure 14: North America AG Analytics Market Revenue (Million), by Type 2024 & 2032
- Figure 15: North America AG Analytics Market Revenue Share (%), by Type 2024 & 2032
- Figure 16: North America AG Analytics Market Revenue (Million), by Deployment Type 2024 & 2032
- Figure 17: North America AG Analytics Market Revenue Share (%), by Deployment Type 2024 & 2032
- Figure 18: North America AG Analytics Market Revenue (Million), by Farm Size 2024 & 2032
- Figure 19: North America AG Analytics Market Revenue Share (%), by Farm Size 2024 & 2032
- Figure 20: North America AG Analytics Market Revenue (Million), by Country 2024 & 2032
- Figure 21: North America AG Analytics Market Revenue Share (%), by Country 2024 & 2032
- Figure 22: Europe AG Analytics Market Revenue (Million), by Component Type 2024 & 2032
- Figure 23: Europe AG Analytics Market Revenue Share (%), by Component Type 2024 & 2032
- Figure 24: Europe AG Analytics Market Revenue (Million), by Type 2024 & 2032
- Figure 25: Europe AG Analytics Market Revenue Share (%), by Type 2024 & 2032
- Figure 26: Europe AG Analytics Market Revenue (Million), by Deployment Type 2024 & 2032
- Figure 27: Europe AG Analytics Market Revenue Share (%), by Deployment Type 2024 & 2032
- Figure 28: Europe AG Analytics Market Revenue (Million), by Farm Size 2024 & 2032
- Figure 29: Europe AG Analytics Market Revenue Share (%), by Farm Size 2024 & 2032
- Figure 30: Europe AG Analytics Market Revenue (Million), by Country 2024 & 2032
- Figure 31: Europe AG Analytics Market Revenue Share (%), by Country 2024 & 2032
- Figure 32: Asia Pacific AG Analytics Market Revenue (Million), by Component Type 2024 & 2032
- Figure 33: Asia Pacific AG Analytics Market Revenue Share (%), by Component Type 2024 & 2032
- Figure 34: Asia Pacific AG Analytics Market Revenue (Million), by Type 2024 & 2032
- Figure 35: Asia Pacific AG Analytics Market Revenue Share (%), by Type 2024 & 2032
- Figure 36: Asia Pacific AG Analytics Market Revenue (Million), by Deployment Type 2024 & 2032
- Figure 37: Asia Pacific AG Analytics Market Revenue Share (%), by Deployment Type 2024 & 2032
- Figure 38: Asia Pacific AG Analytics Market Revenue (Million), by Farm Size 2024 & 2032
- Figure 39: Asia Pacific AG Analytics Market Revenue Share (%), by Farm Size 2024 & 2032
- Figure 40: Asia Pacific AG Analytics Market Revenue (Million), by Country 2024 & 2032
- Figure 41: Asia Pacific AG Analytics Market Revenue Share (%), by Country 2024 & 2032
- Figure 42: Latin America AG Analytics Market Revenue (Million), by Component Type 2024 & 2032
- Figure 43: Latin America AG Analytics Market Revenue Share (%), by Component Type 2024 & 2032
- Figure 44: Latin America AG Analytics Market Revenue (Million), by Type 2024 & 2032
- Figure 45: Latin America AG Analytics Market Revenue Share (%), by Type 2024 & 2032
- Figure 46: Latin America AG Analytics Market Revenue (Million), by Deployment Type 2024 & 2032
- Figure 47: Latin America AG Analytics Market Revenue Share (%), by Deployment Type 2024 & 2032
- Figure 48: Latin America AG Analytics Market Revenue (Million), by Farm Size 2024 & 2032
- Figure 49: Latin America AG Analytics Market Revenue Share (%), by Farm Size 2024 & 2032
- Figure 50: Latin America AG Analytics Market Revenue (Million), by Country 2024 & 2032
- Figure 51: Latin America AG Analytics Market Revenue Share (%), by Country 2024 & 2032
- Figure 52: Middle East and Africa AG Analytics Market Revenue (Million), by Component Type 2024 & 2032
- Figure 53: Middle East and Africa AG Analytics Market Revenue Share (%), by Component Type 2024 & 2032
- Figure 54: Middle East and Africa AG Analytics Market Revenue (Million), by Type 2024 & 2032
- Figure 55: Middle East and Africa AG Analytics Market Revenue Share (%), by Type 2024 & 2032
- Figure 56: Middle East and Africa AG Analytics Market Revenue (Million), by Deployment Type 2024 & 2032
- Figure 57: Middle East and Africa AG Analytics Market Revenue Share (%), by Deployment Type 2024 & 2032
- Figure 58: Middle East and Africa AG Analytics Market Revenue (Million), by Farm Size 2024 & 2032
- Figure 59: Middle East and Africa AG Analytics Market Revenue Share (%), by Farm Size 2024 & 2032
- Figure 60: Middle East and Africa AG Analytics Market Revenue (Million), by Country 2024 & 2032
- Figure 61: Middle East and Africa AG Analytics Market Revenue Share (%), by Country 2024 & 2032
List of Tables
- Table 1: Global AG Analytics Market Revenue Million Forecast, by Region 2019 & 2032
- Table 2: Global AG Analytics Market Revenue Million Forecast, by Component Type 2019 & 2032
- Table 3: Global AG Analytics Market Revenue Million Forecast, by Type 2019 & 2032
- Table 4: Global AG Analytics Market Revenue Million Forecast, by Deployment Type 2019 & 2032
- Table 5: Global AG Analytics Market Revenue Million Forecast, by Farm Size 2019 & 2032
- Table 6: Global AG Analytics Market Revenue Million Forecast, by Region 2019 & 2032
- Table 7: Global AG Analytics Market Revenue Million Forecast, by Country 2019 & 2032
- Table 8: AG Analytics Market Revenue (Million) Forecast, by Application 2019 & 2032
- Table 9: Global AG Analytics Market Revenue Million Forecast, by Country 2019 & 2032
- Table 10: AG Analytics Market Revenue (Million) Forecast, by Application 2019 & 2032
- Table 11: Global AG Analytics Market Revenue Million Forecast, by Country 2019 & 2032
- Table 12: AG Analytics Market Revenue (Million) Forecast, by Application 2019 & 2032
- Table 13: Global AG Analytics Market Revenue Million Forecast, by Country 2019 & 2032
- Table 14: AG Analytics Market Revenue (Million) Forecast, by Application 2019 & 2032
- Table 15: Global AG Analytics Market Revenue Million Forecast, by Country 2019 & 2032
- Table 16: AG Analytics Market Revenue (Million) Forecast, by Application 2019 & 2032
- Table 17: Global AG Analytics Market Revenue Million Forecast, by Component Type 2019 & 2032
- Table 18: Global AG Analytics Market Revenue Million Forecast, by Type 2019 & 2032
- Table 19: Global AG Analytics Market Revenue Million Forecast, by Deployment Type 2019 & 2032
- Table 20: Global AG Analytics Market Revenue Million Forecast, by Farm Size 2019 & 2032
- Table 21: Global AG Analytics Market Revenue Million Forecast, by Country 2019 & 2032
- Table 22: Global AG Analytics Market Revenue Million Forecast, by Component Type 2019 & 2032
- Table 23: Global AG Analytics Market Revenue Million Forecast, by Type 2019 & 2032
- Table 24: Global AG Analytics Market Revenue Million Forecast, by Deployment Type 2019 & 2032
- Table 25: Global AG Analytics Market Revenue Million Forecast, by Farm Size 2019 & 2032
- Table 26: Global AG Analytics Market Revenue Million Forecast, by Country 2019 & 2032
- Table 27: Global AG Analytics Market Revenue Million Forecast, by Component Type 2019 & 2032
- Table 28: Global AG Analytics Market Revenue Million Forecast, by Type 2019 & 2032
- Table 29: Global AG Analytics Market Revenue Million Forecast, by Deployment Type 2019 & 2032
- Table 30: Global AG Analytics Market Revenue Million Forecast, by Farm Size 2019 & 2032
- Table 31: Global AG Analytics Market Revenue Million Forecast, by Country 2019 & 2032
- Table 32: Global AG Analytics Market Revenue Million Forecast, by Component Type 2019 & 2032
- Table 33: Global AG Analytics Market Revenue Million Forecast, by Type 2019 & 2032
- Table 34: Global AG Analytics Market Revenue Million Forecast, by Deployment Type 2019 & 2032
- Table 35: Global AG Analytics Market Revenue Million Forecast, by Farm Size 2019 & 2032
- Table 36: Global AG Analytics Market Revenue Million Forecast, by Country 2019 & 2032
- Table 37: Global AG Analytics Market Revenue Million Forecast, by Component Type 2019 & 2032
- Table 38: Global AG Analytics Market Revenue Million Forecast, by Type 2019 & 2032
- Table 39: Global AG Analytics Market Revenue Million Forecast, by Deployment Type 2019 & 2032
- Table 40: Global AG Analytics Market Revenue Million Forecast, by Farm Size 2019 & 2032
- Table 41: Global AG Analytics Market Revenue Million Forecast, by Country 2019 & 2032
Frequently Asked Questions
1. What is the projected Compound Annual Growth Rate (CAGR) of the AG Analytics Market?
The projected CAGR is approximately 14.40%.
2. Which companies are prominent players in the AG Analytics Market?
Key companies in the market include SAS Institute Inc *List Not Exhaustive, Ageagle Aerial Systems Inc, Deere & Company, Bayer AG, IBM Corporation, Conservis Corporation, PrecisionHawk Inc, Trimble Inc, Vistex Inc, Iteris Inc, Agrivi.
3. What are the main segments of the AG Analytics Market?
The market segments include Component Type, Type, Deployment Type, Farm Size.
4. Can you provide details about the market size?
The market size is estimated to be USD XX Million as of 2022.
5. What are some drivers contributing to market growth?
; Rising Usage of Cutting-edge Technology-based Solutions for Farming.
6. What are the notable trends driving market growth?
Farm Analytics is Expected to Grow at a Significant Rate Over the Forecast Period.
7. Are there any restraints impacting market growth?
; High Capital Cost and Complexity Regarding System Upgrades.
8. Can you provide examples of recent developments in the market?
N/A
9. What pricing options are available for accessing the report?
Pricing options include single-user, multi-user, and enterprise licenses priced at USD 4750, USD 5250, and USD 8750 respectively.
10. Is the market size provided in terms of value or volume?
The market size is provided in terms of value, measured in Million.
11. Are there any specific market keywords associated with the report?
Yes, the market keyword associated with the report is "AG Analytics Market," which aids in identifying and referencing the specific market segment covered.
12. How do I determine which pricing option suits my needs best?
The pricing options vary based on user requirements and access needs. Individual users may opt for single-user licenses, while businesses requiring broader access may choose multi-user or enterprise licenses for cost-effective access to the report.
13. Are there any additional resources or data provided in the AG Analytics Market report?
While the report offers comprehensive insights, it's advisable to review the specific contents or supplementary materials provided to ascertain if additional resources or data are available.
14. How can I stay updated on further developments or reports in the AG Analytics Market?
To stay informed about further developments, trends, and reports in the AG Analytics Market, consider subscribing to industry newsletters, following relevant companies and organizations, or regularly checking reputable industry news sources and publications.
Methodology
Step 1 - Identification of Relevant Samples Size from Population Database


Step 2 - Approaches for Defining Global Market Size (Value, Volume* & Price*)

Note*: In applicable scenarios
Step 3 - Data Sources
Primary Research
- Web Analytics
- Survey Reports
- Research Institute
- Latest Research Reports
- Opinion Leaders
Secondary Research
- Annual Reports
- White Paper
- Latest Press Release
- Industry Association
- Paid Database
- Investor Presentations

Step 4 - Data Triangulation
Involves using different sources of information in order to increase the validity of a study
These sources are likely to be stakeholders in a program - participants, other researchers, program staff, other community members, and so on.
Then we put all data in single framework & apply various statistical tools to find out the dynamic on the market.
During the analysis stage, feedback from the stakeholder groups would be compared to determine areas of agreement as well as areas of divergence
