

Key Insights
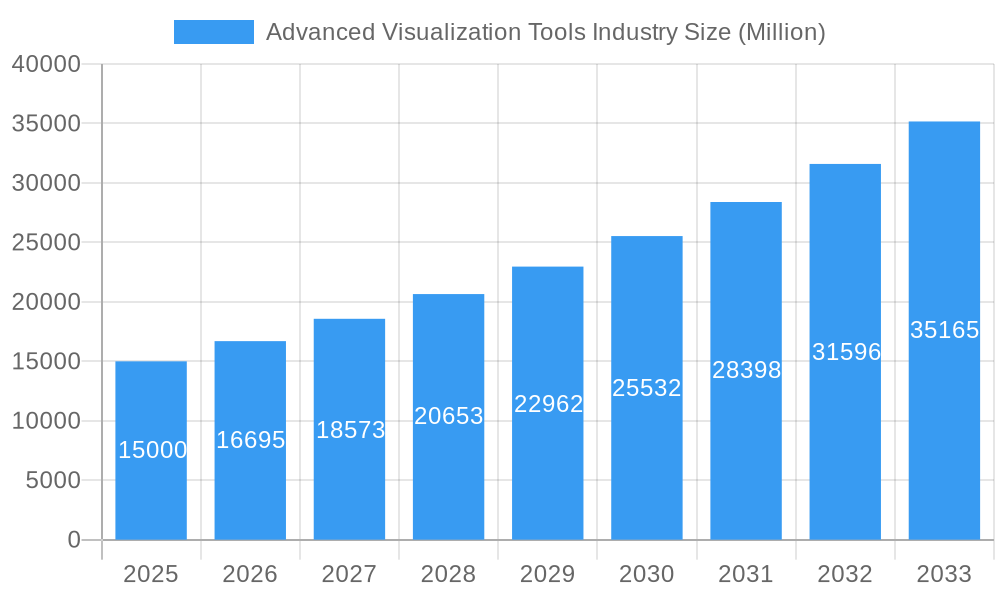
The Advanced Visualization Tools market is poised for significant expansion, projected to reach $4.14 billion by 2033, driven by a robust Compound Annual Growth Rate (CAGR) of 13.8% from 2025 to 2033. This growth is underpinned by the escalating incidence of chronic diseases, necessitating sophisticated diagnostic imaging solutions. Technological innovations in medical imaging modalities, including MRI, CT, and Ultrasound, are key drivers, alongside the burgeoning adoption of AI-powered image analysis software to enhance diagnostic accuracy and operational efficiency. Demand for advanced visualization tools is particularly pronounced in specialized clinical areas such as oncology, cardiology, and neurology, where precise imaging is critical for effective treatment planning and patient management. The market is segmented by imaging modality, clinical application, product type (hardware, software, services), and solution type (enterprise, standalone), catering to diverse healthcare requirements and budgetary considerations. Key market participants include industry leaders like Siemens, GE Healthcare, and Philips, alongside emerging technology innovators. Geographic expansion, especially in developing economies with increasing healthcare infrastructure investment, presents substantial growth prospects.
Advanced Visualization Tools Industry Market Size (In Billion)
While the market presents considerable opportunities, certain challenges exist. High initial investment for advanced visualization systems can pose a barrier for smaller healthcare institutions. A shortage of skilled professionals capable of operating and interpreting complex data from these tools also presents a hurdle, alongside regulatory approvals and data privacy concerns. Nevertheless, continuous technological advancements, including the development of user-friendly interfaces and cloud-based solutions, are actively mitigating these challenges, promoting wider market penetration and accessibility. The future trajectory of the Advanced Visualization Tools market indicates a deeper integration of AI and machine learning, fostering automation, improving diagnostic efficiency, enabling personalized medicine, and ultimately enhancing patient outcomes and overall market growth.
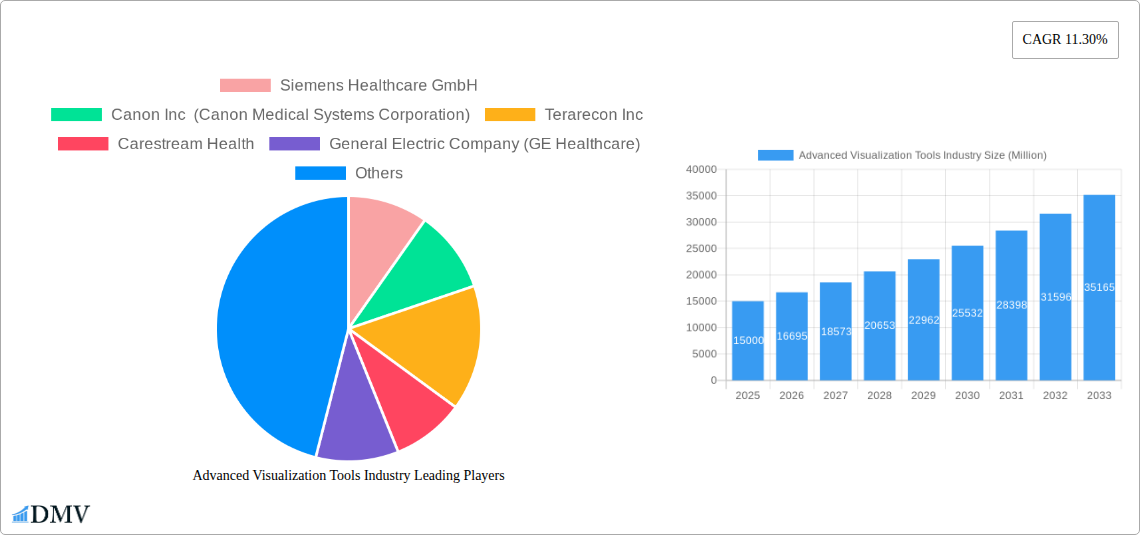
Advanced Visualization Tools Industry Company Market Share
Advanced Visualization Tools Industry: A Comprehensive Market Report (2019-2033)
This insightful report provides a detailed analysis of the Advanced Visualization Tools industry, projecting a market value of $XX Million by 2033. It encompasses a thorough examination of market trends, leading players, technological advancements, and future growth prospects across various segments. The study period covers 2019-2033, with 2025 as the base and estimated year. The report is invaluable for stakeholders seeking to understand the dynamic landscape of this crucial sector within the healthcare industry.
Advanced Visualization Tools Industry Market Composition & Trends
The Advanced Visualization Tools market is characterized by moderate concentration, with key players like Siemens Healthcare GmbH, Canon Inc (Canon Medical Systems Corporation), and GE Healthcare holding significant market share. However, the emergence of innovative startups and the increasing adoption of cloud-based solutions are fostering competition. Market share distribution in 2025 is estimated as follows: Siemens Healthcare GmbH (15%), Canon Inc (12%), GE Healthcare (10%), and others (63%). Innovation is primarily driven by the need for improved diagnostic accuracy, enhanced workflow efficiency, and the growing demand for AI-powered image analysis. The regulatory landscape, particularly concerning data privacy and cybersecurity, significantly influences market dynamics. Substitute products, such as traditional imaging techniques, pose a moderate competitive threat. The end-user profile largely consists of hospitals, diagnostic imaging centers, and research institutions. Significant M&A activity has been observed in the historical period (2019-2024), with total deal values exceeding $XX Million. Future M&A activity is expected to focus on expanding capabilities in AI and cloud-based solutions.
- Market Concentration: Moderately concentrated, with top players holding significant share.
- Innovation Catalysts: AI integration, cloud computing, improved diagnostic accuracy.
- Regulatory Landscape: Stringent data privacy and cybersecurity regulations.
- Substitute Products: Traditional imaging techniques pose a moderate threat.
- End-User Profile: Hospitals, diagnostic centers, and research institutions.
- M&A Activity: Total deal value exceeded $XX Million (2019-2024).
Advanced Visualization Tools Industry Industry Evolution
The Advanced Visualization Tools industry has experienced substantial growth between 2019 and 2024, with a Compound Annual Growth Rate (CAGR) of XX%. This growth is primarily attributable to technological advancements, such as the integration of artificial intelligence (AI) and machine learning (ML) algorithms into imaging software, leading to improved diagnostic accuracy and efficiency. The increasing prevalence of chronic diseases and the growing geriatric population have further fueled demand for advanced visualization tools. The shift towards personalized medicine has also driven innovation, with tools tailored to specific clinical applications gaining traction. The adoption rate of AI-powered diagnostic tools has increased by XX% from 2021 to 2024. This trend is expected to accelerate in the forecast period (2025-2033), with a projected CAGR of XX%, driven by the increasing availability of high-quality medical images and the decreasing cost of AI-powered software. Consumer demand is shifting towards cloud-based solutions offering scalability, accessibility, and reduced infrastructure costs. The market is also witnessing a rise in demand for integrated solutions that streamline workflows and improve collaboration among healthcare professionals.
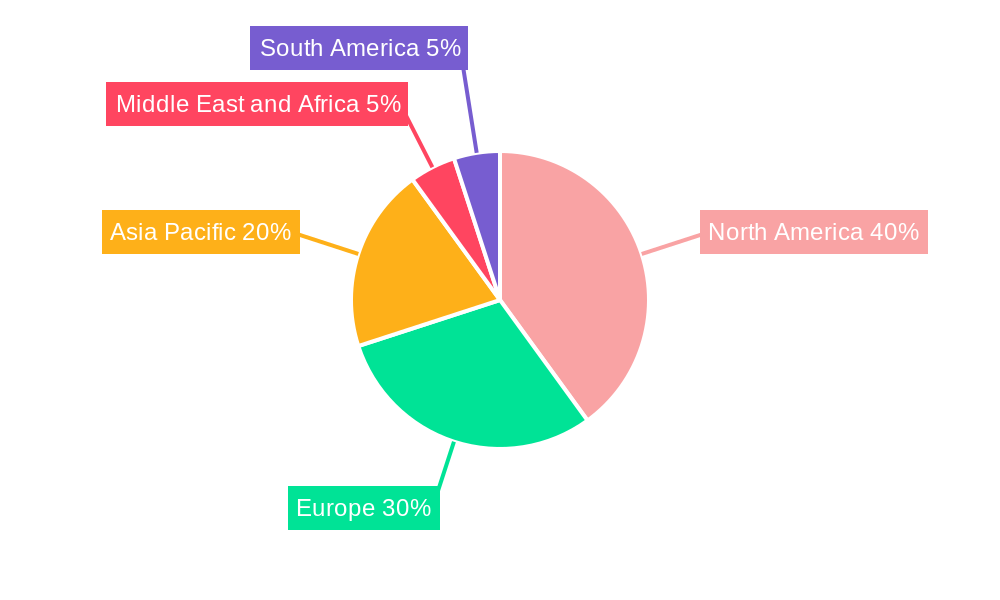
Leading Regions, Countries, or Segments in Advanced Visualization Tools Industry
The North American region is currently the leading market for advanced visualization tools, driven by factors such as high healthcare expenditure, technological advancements, and strong regulatory support. However, the Asia-Pacific region is projected to experience significant growth in the coming years, fueled by increasing healthcare infrastructure development and rising disposable incomes.
Key Drivers:
- High Healthcare Expenditure: North America.
- Technological Advancements: Global.
- Regulatory Support: North America, Europe.
- Rising Disposable Incomes: Asia-Pacific.
Dominant Segments:
- Imaging Modality: MRI and CT remain dominant due to their high diagnostic capabilities, with Ultrasound showing strong growth potential.
- Clinical Application: Oncology and Cardiovascular applications lead the market, driven by the high prevalence of related diseases.
- Product and Service: Software and Services segments are experiencing faster growth compared to Hardware due to increased demand for AI-powered analytics and cloud-based solutions.
- Type of Solution: Enterprise solutions are dominant, reflecting the preference for integrated systems in large healthcare institutions.
Advanced Visualization Tools Industry Product Innovations
Recent innovations include AI-powered image analysis software that can detect subtle abnormalities, cloud-based platforms enabling remote collaboration and image sharing, and 3D visualization tools offering enhanced diagnostic capabilities. These innovations are focused on improving diagnostic accuracy, streamlining workflows, and enhancing collaborative capabilities, ultimately leading to improved patient care and reduced healthcare costs. Unique selling propositions include increased efficiency, improved diagnostic accuracy through AI and enhanced visualization capabilities, and cost-effectiveness through cloud-based solutions.
Propelling Factors for Advanced Visualization Tools Industry Growth
Several factors contribute to the industry's growth: technological advancements like AI and machine learning enhancing diagnostic capabilities; increasing prevalence of chronic diseases driving demand for better diagnostic tools; rising healthcare expenditure globally; and supportive regulatory frameworks promoting adoption of advanced technologies. The development of cloud-based platforms improves accessibility and reduces infrastructure costs, further accelerating market expansion.
Obstacles in the Advanced Visualization Tools Industry Market
High initial investment costs for advanced systems, complex integration challenges, stringent regulatory requirements, data privacy concerns, and intense competition from established players and emerging companies pose significant obstacles to market growth. Supply chain disruptions can also impact the availability and pricing of critical components.
Future Opportunities in Advanced Visualization Tools Industry
Future opportunities lie in integrating advanced visualization tools with other healthcare technologies such as telemedicine and wearable sensors, creating a more comprehensive and integrated approach to healthcare. Further expansion into emerging markets, especially in developing countries, is a significant opportunity. The increasing focus on preventive care also opens new avenues for advanced visualization tools.
Major Players in the Advanced Visualization Tools Industry Ecosystem
Key Developments in Advanced Visualization Tools Industry Industry
- August 2022: Kitware launched MIQA, a cloud-based application for medical image quality assurance, enhancing collaboration and longitudinal studies.
- February 2022: Siemens Healthineers and Universal Medical Imaging partnered to improve image screening and diagnosis efficiency in Chinese primary healthcare institutions.
Strategic Advanced Visualization Tools Industry Market Forecast
The Advanced Visualization Tools market is poised for significant growth in the forecast period (2025-2033), driven by technological advancements, increasing demand for improved diagnostic capabilities, and expansion into new markets. The integration of AI and cloud computing will continue to shape the industry, offering enhanced efficiency, accuracy, and accessibility. The market is expected to witness a robust expansion, with strong growth in emerging economies and increasing adoption of advanced imaging technologies across various clinical applications.
Advanced Visualization Tools Industry Segmentation
-
1. Product and Service
- 1.1. Hardware
- 1.2. Software
- 1.3. Services
-
2. Type of Solution
- 2.1. Enterprise
- 2.2. Standalone
-
3. Imaging Modality
- 3.1. Magnetic Resonance Imaging (MRI)
- 3.2. Computed Tomography (CT)
- 3.3. Ultrasound
- 3.4. Nuclear Medicine
- 3.5. Other Imaging Modalities
-
4. Clinical Application
- 4.1. Oncology
- 4.2. Orthopedics
- 4.3. Cardiovascular
- 4.4. Neurology
- 4.5. Other Clinical Applications
Advanced Visualization Tools Industry Segmentation By Geography
-
1. North America
- 1.1. United States
- 1.2. Canada
- 1.3. Mexico
-
2. Europe
- 2.1. Germany
- 2.2. United Kingdom
- 2.3. France
- 2.4. Italy
- 2.5. Spain
- 2.6. Rest of Europe
-
3. Asia Pacific
- 3.1. China
- 3.2. Japan
- 3.3. India
- 3.4. Australia
- 3.5. South Korea
- 3.6. Rest of Asia Pacific
-
4. Middle East and Africa
- 4.1. GCC
- 4.2. South Africa
- 4.3. Rest of Middle East and Africa
-
5. South America
- 5.1. Brazil
- 5.2. Argentina
- 5.3. Rest of South America
Advanced Visualization Tools Industry Regional Market Share
Geographic Coverage of Advanced Visualization Tools Industry
Advanced Visualization Tools Industry REPORT HIGHLIGHTS
| Aspects | Details |
|---|---|
| Study Period | 2020-2034 |
| Base Year | 2025 |
| Estimated Year | 2026 |
| Forecast Period | 2026-2034 |
| Historical Period | 2020-2025 |
| Growth Rate | CAGR of 13.8% from 2020-2034 |
| Segmentation |
|
Table of Contents
- 1. Introduction
- 1.1. Research Scope
- 1.2. Market Segmentation
- 1.3. Research Objective
- 1.4. Definitions and Assumptions
- 2. Executive Summary
- 2.1. Market Snapshot
- 3. Market Dynamics
- 3.1. Market Drivers
- 3.2. Market Restrains
- 3.3. Market Trends
- 3.4. Market Opportunities
- 4. Market Factor Analysis
- 4.1. Porters Five Forces
- 4.1.1. Bargaining Power of Suppliers
- 4.1.2. Bargaining Power of Buyers
- 4.1.3. Threat of New Entrants
- 4.1.4. Threat of Substitutes
- 4.1.5. Competitive Rivalry
- 4.2. PESTEL analysis
- 4.3. BCG Analysis
- 4.3.1. Stars (High Growth, High Market Share)
- 4.3.2. Cash Cows (Low Growth, High Market Share)
- 4.3.3. Question Mark (High Growth, Low Market Share)
- 4.3.4. Dogs (Low Growth, Low Market Share)
- 4.4. Ansoff Matrix Analysis
- 4.5. Supply Chain Analysis
- 4.6. Regulatory Landscape
- 4.7. Current Market Potential and Opportunity Assessment (TAM–SAM–SOM Framework)
- 4.8. DMV Analyst Note
- 4.1. Porters Five Forces
- 5. Market Analysis, Insights and Forecast 2021-2033
- 5.1. Market Analysis, Insights and Forecast - by Product and Service
- 5.1.1. Hardware
- 5.1.2. Software
- 5.1.3. Services
- 5.2. Market Analysis, Insights and Forecast - by Type of Solution
- 5.2.1. Enterprise
- 5.2.2. Standalone
- 5.3. Market Analysis, Insights and Forecast - by Imaging Modality
- 5.3.1. Magnetic Resonance Imaging (MRI)
- 5.3.2. Computed Tomography (CT)
- 5.3.3. Ultrasound
- 5.3.4. Nuclear Medicine
- 5.3.5. Other Imaging Modalities
- 5.4. Market Analysis, Insights and Forecast - by Clinical Application
- 5.4.1. Oncology
- 5.4.2. Orthopedics
- 5.4.3. Cardiovascular
- 5.4.4. Neurology
- 5.4.5. Other Clinical Applications
- 5.5. Market Analysis, Insights and Forecast - by Region
- 5.5.1. North America
- 5.5.2. Europe
- 5.5.3. Asia Pacific
- 5.5.4. Middle East and Africa
- 5.5.5. South America
- 5.1. Market Analysis, Insights and Forecast - by Product and Service
- 6. Global Advanced Visualization Tools Industry Analysis, Insights and Forecast, 2021-2033
- 6.1. Market Analysis, Insights and Forecast - by Product and Service
- 6.1.1. Hardware
- 6.1.2. Software
- 6.1.3. Services
- 6.2. Market Analysis, Insights and Forecast - by Type of Solution
- 6.2.1. Enterprise
- 6.2.2. Standalone
- 6.3. Market Analysis, Insights and Forecast - by Imaging Modality
- 6.3.1. Magnetic Resonance Imaging (MRI)
- 6.3.2. Computed Tomography (CT)
- 6.3.3. Ultrasound
- 6.3.4. Nuclear Medicine
- 6.3.5. Other Imaging Modalities
- 6.4. Market Analysis, Insights and Forecast - by Clinical Application
- 6.4.1. Oncology
- 6.4.2. Orthopedics
- 6.4.3. Cardiovascular
- 6.4.4. Neurology
- 6.4.5. Other Clinical Applications
- 6.1. Market Analysis, Insights and Forecast - by Product and Service
- 7. North America Advanced Visualization Tools Industry Analysis, Insights and Forecast, 2020-2032
- 7.1. Market Analysis, Insights and Forecast - by Product and Service
- 7.1.1. Hardware
- 7.1.2. Software
- 7.1.3. Services
- 7.2. Market Analysis, Insights and Forecast - by Type of Solution
- 7.2.1. Enterprise
- 7.2.2. Standalone
- 7.3. Market Analysis, Insights and Forecast - by Imaging Modality
- 7.3.1. Magnetic Resonance Imaging (MRI)
- 7.3.2. Computed Tomography (CT)
- 7.3.3. Ultrasound
- 7.3.4. Nuclear Medicine
- 7.3.5. Other Imaging Modalities
- 7.4. Market Analysis, Insights and Forecast - by Clinical Application
- 7.4.1. Oncology
- 7.4.2. Orthopedics
- 7.4.3. Cardiovascular
- 7.4.4. Neurology
- 7.4.5. Other Clinical Applications
- 7.1. Market Analysis, Insights and Forecast - by Product and Service
- 8. Europe Advanced Visualization Tools Industry Analysis, Insights and Forecast, 2020-2032
- 8.1. Market Analysis, Insights and Forecast - by Product and Service
- 8.1.1. Hardware
- 8.1.2. Software
- 8.1.3. Services
- 8.2. Market Analysis, Insights and Forecast - by Type of Solution
- 8.2.1. Enterprise
- 8.2.2. Standalone
- 8.3. Market Analysis, Insights and Forecast - by Imaging Modality
- 8.3.1. Magnetic Resonance Imaging (MRI)
- 8.3.2. Computed Tomography (CT)
- 8.3.3. Ultrasound
- 8.3.4. Nuclear Medicine
- 8.3.5. Other Imaging Modalities
- 8.4. Market Analysis, Insights and Forecast - by Clinical Application
- 8.4.1. Oncology
- 8.4.2. Orthopedics
- 8.4.3. Cardiovascular
- 8.4.4. Neurology
- 8.4.5. Other Clinical Applications
- 8.1. Market Analysis, Insights and Forecast - by Product and Service
- 9. Asia Pacific Advanced Visualization Tools Industry Analysis, Insights and Forecast, 2020-2032
- 9.1. Market Analysis, Insights and Forecast - by Product and Service
- 9.1.1. Hardware
- 9.1.2. Software
- 9.1.3. Services
- 9.2. Market Analysis, Insights and Forecast - by Type of Solution
- 9.2.1. Enterprise
- 9.2.2. Standalone
- 9.3. Market Analysis, Insights and Forecast - by Imaging Modality
- 9.3.1. Magnetic Resonance Imaging (MRI)
- 9.3.2. Computed Tomography (CT)
- 9.3.3. Ultrasound
- 9.3.4. Nuclear Medicine
- 9.3.5. Other Imaging Modalities
- 9.4. Market Analysis, Insights and Forecast - by Clinical Application
- 9.4.1. Oncology
- 9.4.2. Orthopedics
- 9.4.3. Cardiovascular
- 9.4.4. Neurology
- 9.4.5. Other Clinical Applications
- 9.1. Market Analysis, Insights and Forecast - by Product and Service
- 10. Middle East and Africa Advanced Visualization Tools Industry Analysis, Insights and Forecast, 2020-2032
- 10.1. Market Analysis, Insights and Forecast - by Product and Service
- 10.1.1. Hardware
- 10.1.2. Software
- 10.1.3. Services
- 10.2. Market Analysis, Insights and Forecast - by Type of Solution
- 10.2.1. Enterprise
- 10.2.2. Standalone
- 10.3. Market Analysis, Insights and Forecast - by Imaging Modality
- 10.3.1. Magnetic Resonance Imaging (MRI)
- 10.3.2. Computed Tomography (CT)
- 10.3.3. Ultrasound
- 10.3.4. Nuclear Medicine
- 10.3.5. Other Imaging Modalities
- 10.4. Market Analysis, Insights and Forecast - by Clinical Application
- 10.4.1. Oncology
- 10.4.2. Orthopedics
- 10.4.3. Cardiovascular
- 10.4.4. Neurology
- 10.4.5. Other Clinical Applications
- 10.1. Market Analysis, Insights and Forecast - by Product and Service
- 11. South America Advanced Visualization Tools Industry Analysis, Insights and Forecast, 2020-2032
- 11.1. Market Analysis, Insights and Forecast - by Product and Service
- 11.1.1. Hardware
- 11.1.2. Software
- 11.1.3. Services
- 11.2. Market Analysis, Insights and Forecast - by Type of Solution
- 11.2.1. Enterprise
- 11.2.2. Standalone
- 11.3. Market Analysis, Insights and Forecast - by Imaging Modality
- 11.3.1. Magnetic Resonance Imaging (MRI)
- 11.3.2. Computed Tomography (CT)
- 11.3.3. Ultrasound
- 11.3.4. Nuclear Medicine
- 11.3.5. Other Imaging Modalities
- 11.4. Market Analysis, Insights and Forecast - by Clinical Application
- 11.4.1. Oncology
- 11.4.2. Orthopedics
- 11.4.3. Cardiovascular
- 11.4.4. Neurology
- 11.4.5. Other Clinical Applications
- 11.1. Market Analysis, Insights and Forecast - by Product and Service
- 12. Competitive Analysis
- 12.1. Company Profiles
- 12.1.1 Siemens Healthcare GmbH
- 12.1.1.1. Company Overview
- 12.1.1.2. Products
- 12.1.1.3. Company Financials
- 12.1.1.4. SWOT Analysis
- 12.1.2 Canon Inc (Canon Medical Systems Corporation)
- 12.1.2.1. Company Overview
- 12.1.2.2. Products
- 12.1.2.3. Company Financials
- 12.1.2.4. SWOT Analysis
- 12.1.3 Terarecon Inc
- 12.1.3.1. Company Overview
- 12.1.3.2. Products
- 12.1.3.3. Company Financials
- 12.1.3.4. SWOT Analysis
- 12.1.4 Carestream Health
- 12.1.4.1. Company Overview
- 12.1.4.2. Products
- 12.1.4.3. Company Financials
- 12.1.4.4. SWOT Analysis
- 12.1.5 General Electric Company (GE Healthcare)
- 12.1.5.1. Company Overview
- 12.1.5.2. Products
- 12.1.5.3. Company Financials
- 12.1.5.4. SWOT Analysis
- 12.1.6 Koninklijke Philips NV
- 12.1.6.1. Company Overview
- 12.1.6.2. Products
- 12.1.6.3. Company Financials
- 12.1.6.4. SWOT Analysis
- 12.1.7 Pro Medicus Ltd
- 12.1.7.1. Company Overview
- 12.1.7.2. Products
- 12.1.7.3. Company Financials
- 12.1.7.4. SWOT Analysis
- 12.1.8 Agfa-Gevaert Group
- 12.1.8.1. Company Overview
- 12.1.8.2. Products
- 12.1.8.3. Company Financials
- 12.1.8.4. SWOT Analysis
- 12.1.9 Fujifilm Holdings Corporation
- 12.1.9.1. Company Overview
- 12.1.9.2. Products
- 12.1.9.3. Company Financials
- 12.1.9.4. SWOT Analysis
- 12.1.1 Siemens Healthcare GmbH
- 12.2. Market Entropy
- 12.2.1 Company's Key Areas Served
- 12.2.2 Recent Developments
- 12.3. Company Market Share Analysis 2025
- 12.3.1 Top 5 Companies Market Share Analysis
- 12.3.2 Top 3 Companies Market Share Analysis
- 12.4. List of Potential Customers
- 13. Research Methodology
List of Figures
- Figure 1: Global Advanced Visualization Tools Industry Revenue Breakdown (billion, %) by Region 2025 & 2033
- Figure 2: Global Advanced Visualization Tools Industry Volume Breakdown (K Unit, %) by Region 2025 & 2033
- Figure 3: North America Advanced Visualization Tools Industry Revenue (billion), by Product and Service 2025 & 2033
- Figure 4: North America Advanced Visualization Tools Industry Volume (K Unit), by Product and Service 2025 & 2033
- Figure 5: North America Advanced Visualization Tools Industry Revenue Share (%), by Product and Service 2025 & 2033
- Figure 6: North America Advanced Visualization Tools Industry Volume Share (%), by Product and Service 2025 & 2033
- Figure 7: North America Advanced Visualization Tools Industry Revenue (billion), by Type of Solution 2025 & 2033
- Figure 8: North America Advanced Visualization Tools Industry Volume (K Unit), by Type of Solution 2025 & 2033
- Figure 9: North America Advanced Visualization Tools Industry Revenue Share (%), by Type of Solution 2025 & 2033
- Figure 10: North America Advanced Visualization Tools Industry Volume Share (%), by Type of Solution 2025 & 2033
- Figure 11: North America Advanced Visualization Tools Industry Revenue (billion), by Imaging Modality 2025 & 2033
- Figure 12: North America Advanced Visualization Tools Industry Volume (K Unit), by Imaging Modality 2025 & 2033
- Figure 13: North America Advanced Visualization Tools Industry Revenue Share (%), by Imaging Modality 2025 & 2033
- Figure 14: North America Advanced Visualization Tools Industry Volume Share (%), by Imaging Modality 2025 & 2033
- Figure 15: North America Advanced Visualization Tools Industry Revenue (billion), by Clinical Application 2025 & 2033
- Figure 16: North America Advanced Visualization Tools Industry Volume (K Unit), by Clinical Application 2025 & 2033
- Figure 17: North America Advanced Visualization Tools Industry Revenue Share (%), by Clinical Application 2025 & 2033
- Figure 18: North America Advanced Visualization Tools Industry Volume Share (%), by Clinical Application 2025 & 2033
- Figure 19: North America Advanced Visualization Tools Industry Revenue (billion), by Country 2025 & 2033
- Figure 20: North America Advanced Visualization Tools Industry Volume (K Unit), by Country 2025 & 2033
- Figure 21: North America Advanced Visualization Tools Industry Revenue Share (%), by Country 2025 & 2033
- Figure 22: North America Advanced Visualization Tools Industry Volume Share (%), by Country 2025 & 2033
- Figure 23: Europe Advanced Visualization Tools Industry Revenue (billion), by Product and Service 2025 & 2033
- Figure 24: Europe Advanced Visualization Tools Industry Volume (K Unit), by Product and Service 2025 & 2033
- Figure 25: Europe Advanced Visualization Tools Industry Revenue Share (%), by Product and Service 2025 & 2033
- Figure 26: Europe Advanced Visualization Tools Industry Volume Share (%), by Product and Service 2025 & 2033
- Figure 27: Europe Advanced Visualization Tools Industry Revenue (billion), by Type of Solution 2025 & 2033
- Figure 28: Europe Advanced Visualization Tools Industry Volume (K Unit), by Type of Solution 2025 & 2033
- Figure 29: Europe Advanced Visualization Tools Industry Revenue Share (%), by Type of Solution 2025 & 2033
- Figure 30: Europe Advanced Visualization Tools Industry Volume Share (%), by Type of Solution 2025 & 2033
- Figure 31: Europe Advanced Visualization Tools Industry Revenue (billion), by Imaging Modality 2025 & 2033
- Figure 32: Europe Advanced Visualization Tools Industry Volume (K Unit), by Imaging Modality 2025 & 2033
- Figure 33: Europe Advanced Visualization Tools Industry Revenue Share (%), by Imaging Modality 2025 & 2033
- Figure 34: Europe Advanced Visualization Tools Industry Volume Share (%), by Imaging Modality 2025 & 2033
- Figure 35: Europe Advanced Visualization Tools Industry Revenue (billion), by Clinical Application 2025 & 2033
- Figure 36: Europe Advanced Visualization Tools Industry Volume (K Unit), by Clinical Application 2025 & 2033
- Figure 37: Europe Advanced Visualization Tools Industry Revenue Share (%), by Clinical Application 2025 & 2033
- Figure 38: Europe Advanced Visualization Tools Industry Volume Share (%), by Clinical Application 2025 & 2033
- Figure 39: Europe Advanced Visualization Tools Industry Revenue (billion), by Country 2025 & 2033
- Figure 40: Europe Advanced Visualization Tools Industry Volume (K Unit), by Country 2025 & 2033
- Figure 41: Europe Advanced Visualization Tools Industry Revenue Share (%), by Country 2025 & 2033
- Figure 42: Europe Advanced Visualization Tools Industry Volume Share (%), by Country 2025 & 2033
- Figure 43: Asia Pacific Advanced Visualization Tools Industry Revenue (billion), by Product and Service 2025 & 2033
- Figure 44: Asia Pacific Advanced Visualization Tools Industry Volume (K Unit), by Product and Service 2025 & 2033
- Figure 45: Asia Pacific Advanced Visualization Tools Industry Revenue Share (%), by Product and Service 2025 & 2033
- Figure 46: Asia Pacific Advanced Visualization Tools Industry Volume Share (%), by Product and Service 2025 & 2033
- Figure 47: Asia Pacific Advanced Visualization Tools Industry Revenue (billion), by Type of Solution 2025 & 2033
- Figure 48: Asia Pacific Advanced Visualization Tools Industry Volume (K Unit), by Type of Solution 2025 & 2033
- Figure 49: Asia Pacific Advanced Visualization Tools Industry Revenue Share (%), by Type of Solution 2025 & 2033
- Figure 50: Asia Pacific Advanced Visualization Tools Industry Volume Share (%), by Type of Solution 2025 & 2033
- Figure 51: Asia Pacific Advanced Visualization Tools Industry Revenue (billion), by Imaging Modality 2025 & 2033
- Figure 52: Asia Pacific Advanced Visualization Tools Industry Volume (K Unit), by Imaging Modality 2025 & 2033
- Figure 53: Asia Pacific Advanced Visualization Tools Industry Revenue Share (%), by Imaging Modality 2025 & 2033
- Figure 54: Asia Pacific Advanced Visualization Tools Industry Volume Share (%), by Imaging Modality 2025 & 2033
- Figure 55: Asia Pacific Advanced Visualization Tools Industry Revenue (billion), by Clinical Application 2025 & 2033
- Figure 56: Asia Pacific Advanced Visualization Tools Industry Volume (K Unit), by Clinical Application 2025 & 2033
- Figure 57: Asia Pacific Advanced Visualization Tools Industry Revenue Share (%), by Clinical Application 2025 & 2033
- Figure 58: Asia Pacific Advanced Visualization Tools Industry Volume Share (%), by Clinical Application 2025 & 2033
- Figure 59: Asia Pacific Advanced Visualization Tools Industry Revenue (billion), by Country 2025 & 2033
- Figure 60: Asia Pacific Advanced Visualization Tools Industry Volume (K Unit), by Country 2025 & 2033
- Figure 61: Asia Pacific Advanced Visualization Tools Industry Revenue Share (%), by Country 2025 & 2033
- Figure 62: Asia Pacific Advanced Visualization Tools Industry Volume Share (%), by Country 2025 & 2033
- Figure 63: Middle East and Africa Advanced Visualization Tools Industry Revenue (billion), by Product and Service 2025 & 2033
- Figure 64: Middle East and Africa Advanced Visualization Tools Industry Volume (K Unit), by Product and Service 2025 & 2033
- Figure 65: Middle East and Africa Advanced Visualization Tools Industry Revenue Share (%), by Product and Service 2025 & 2033
- Figure 66: Middle East and Africa Advanced Visualization Tools Industry Volume Share (%), by Product and Service 2025 & 2033
- Figure 67: Middle East and Africa Advanced Visualization Tools Industry Revenue (billion), by Type of Solution 2025 & 2033
- Figure 68: Middle East and Africa Advanced Visualization Tools Industry Volume (K Unit), by Type of Solution 2025 & 2033
- Figure 69: Middle East and Africa Advanced Visualization Tools Industry Revenue Share (%), by Type of Solution 2025 & 2033
- Figure 70: Middle East and Africa Advanced Visualization Tools Industry Volume Share (%), by Type of Solution 2025 & 2033
- Figure 71: Middle East and Africa Advanced Visualization Tools Industry Revenue (billion), by Imaging Modality 2025 & 2033
- Figure 72: Middle East and Africa Advanced Visualization Tools Industry Volume (K Unit), by Imaging Modality 2025 & 2033
- Figure 73: Middle East and Africa Advanced Visualization Tools Industry Revenue Share (%), by Imaging Modality 2025 & 2033
- Figure 74: Middle East and Africa Advanced Visualization Tools Industry Volume Share (%), by Imaging Modality 2025 & 2033
- Figure 75: Middle East and Africa Advanced Visualization Tools Industry Revenue (billion), by Clinical Application 2025 & 2033
- Figure 76: Middle East and Africa Advanced Visualization Tools Industry Volume (K Unit), by Clinical Application 2025 & 2033
- Figure 77: Middle East and Africa Advanced Visualization Tools Industry Revenue Share (%), by Clinical Application 2025 & 2033
- Figure 78: Middle East and Africa Advanced Visualization Tools Industry Volume Share (%), by Clinical Application 2025 & 2033
- Figure 79: Middle East and Africa Advanced Visualization Tools Industry Revenue (billion), by Country 2025 & 2033
- Figure 80: Middle East and Africa Advanced Visualization Tools Industry Volume (K Unit), by Country 2025 & 2033
- Figure 81: Middle East and Africa Advanced Visualization Tools Industry Revenue Share (%), by Country 2025 & 2033
- Figure 82: Middle East and Africa Advanced Visualization Tools Industry Volume Share (%), by Country 2025 & 2033
- Figure 83: South America Advanced Visualization Tools Industry Revenue (billion), by Product and Service 2025 & 2033
- Figure 84: South America Advanced Visualization Tools Industry Volume (K Unit), by Product and Service 2025 & 2033
- Figure 85: South America Advanced Visualization Tools Industry Revenue Share (%), by Product and Service 2025 & 2033
- Figure 86: South America Advanced Visualization Tools Industry Volume Share (%), by Product and Service 2025 & 2033
- Figure 87: South America Advanced Visualization Tools Industry Revenue (billion), by Type of Solution 2025 & 2033
- Figure 88: South America Advanced Visualization Tools Industry Volume (K Unit), by Type of Solution 2025 & 2033
- Figure 89: South America Advanced Visualization Tools Industry Revenue Share (%), by Type of Solution 2025 & 2033
- Figure 90: South America Advanced Visualization Tools Industry Volume Share (%), by Type of Solution 2025 & 2033
- Figure 91: South America Advanced Visualization Tools Industry Revenue (billion), by Imaging Modality 2025 & 2033
- Figure 92: South America Advanced Visualization Tools Industry Volume (K Unit), by Imaging Modality 2025 & 2033
- Figure 93: South America Advanced Visualization Tools Industry Revenue Share (%), by Imaging Modality 2025 & 2033
- Figure 94: South America Advanced Visualization Tools Industry Volume Share (%), by Imaging Modality 2025 & 2033
- Figure 95: South America Advanced Visualization Tools Industry Revenue (billion), by Clinical Application 2025 & 2033
- Figure 96: South America Advanced Visualization Tools Industry Volume (K Unit), by Clinical Application 2025 & 2033
- Figure 97: South America Advanced Visualization Tools Industry Revenue Share (%), by Clinical Application 2025 & 2033
- Figure 98: South America Advanced Visualization Tools Industry Volume Share (%), by Clinical Application 2025 & 2033
- Figure 99: South America Advanced Visualization Tools Industry Revenue (billion), by Country 2025 & 2033
- Figure 100: South America Advanced Visualization Tools Industry Volume (K Unit), by Country 2025 & 2033
- Figure 101: South America Advanced Visualization Tools Industry Revenue Share (%), by Country 2025 & 2033
- Figure 102: South America Advanced Visualization Tools Industry Volume Share (%), by Country 2025 & 2033
List of Tables
- Table 1: Global Advanced Visualization Tools Industry Revenue billion Forecast, by Product and Service 2020 & 2033
- Table 2: Global Advanced Visualization Tools Industry Volume K Unit Forecast, by Product and Service 2020 & 2033
- Table 3: Global Advanced Visualization Tools Industry Revenue billion Forecast, by Type of Solution 2020 & 2033
- Table 4: Global Advanced Visualization Tools Industry Volume K Unit Forecast, by Type of Solution 2020 & 2033
- Table 5: Global Advanced Visualization Tools Industry Revenue billion Forecast, by Imaging Modality 2020 & 2033
- Table 6: Global Advanced Visualization Tools Industry Volume K Unit Forecast, by Imaging Modality 2020 & 2033
- Table 7: Global Advanced Visualization Tools Industry Revenue billion Forecast, by Clinical Application 2020 & 2033
- Table 8: Global Advanced Visualization Tools Industry Volume K Unit Forecast, by Clinical Application 2020 & 2033
- Table 9: Global Advanced Visualization Tools Industry Revenue billion Forecast, by Region 2020 & 2033
- Table 10: Global Advanced Visualization Tools Industry Volume K Unit Forecast, by Region 2020 & 2033
- Table 11: Global Advanced Visualization Tools Industry Revenue billion Forecast, by Product and Service 2020 & 2033
- Table 12: Global Advanced Visualization Tools Industry Volume K Unit Forecast, by Product and Service 2020 & 2033
- Table 13: Global Advanced Visualization Tools Industry Revenue billion Forecast, by Type of Solution 2020 & 2033
- Table 14: Global Advanced Visualization Tools Industry Volume K Unit Forecast, by Type of Solution 2020 & 2033
- Table 15: Global Advanced Visualization Tools Industry Revenue billion Forecast, by Imaging Modality 2020 & 2033
- Table 16: Global Advanced Visualization Tools Industry Volume K Unit Forecast, by Imaging Modality 2020 & 2033
- Table 17: Global Advanced Visualization Tools Industry Revenue billion Forecast, by Clinical Application 2020 & 2033
- Table 18: Global Advanced Visualization Tools Industry Volume K Unit Forecast, by Clinical Application 2020 & 2033
- Table 19: Global Advanced Visualization Tools Industry Revenue billion Forecast, by Country 2020 & 2033
- Table 20: Global Advanced Visualization Tools Industry Volume K Unit Forecast, by Country 2020 & 2033
- Table 21: United States Advanced Visualization Tools Industry Revenue (billion) Forecast, by Application 2020 & 2033
- Table 22: United States Advanced Visualization Tools Industry Volume (K Unit) Forecast, by Application 2020 & 2033
- Table 23: Canada Advanced Visualization Tools Industry Revenue (billion) Forecast, by Application 2020 & 2033
- Table 24: Canada Advanced Visualization Tools Industry Volume (K Unit) Forecast, by Application 2020 & 2033
- Table 25: Mexico Advanced Visualization Tools Industry Revenue (billion) Forecast, by Application 2020 & 2033
- Table 26: Mexico Advanced Visualization Tools Industry Volume (K Unit) Forecast, by Application 2020 & 2033
- Table 27: Global Advanced Visualization Tools Industry Revenue billion Forecast, by Product and Service 2020 & 2033
- Table 28: Global Advanced Visualization Tools Industry Volume K Unit Forecast, by Product and Service 2020 & 2033
- Table 29: Global Advanced Visualization Tools Industry Revenue billion Forecast, by Type of Solution 2020 & 2033
- Table 30: Global Advanced Visualization Tools Industry Volume K Unit Forecast, by Type of Solution 2020 & 2033
- Table 31: Global Advanced Visualization Tools Industry Revenue billion Forecast, by Imaging Modality 2020 & 2033
- Table 32: Global Advanced Visualization Tools Industry Volume K Unit Forecast, by Imaging Modality 2020 & 2033
- Table 33: Global Advanced Visualization Tools Industry Revenue billion Forecast, by Clinical Application 2020 & 2033
- Table 34: Global Advanced Visualization Tools Industry Volume K Unit Forecast, by Clinical Application 2020 & 2033
- Table 35: Global Advanced Visualization Tools Industry Revenue billion Forecast, by Country 2020 & 2033
- Table 36: Global Advanced Visualization Tools Industry Volume K Unit Forecast, by Country 2020 & 2033
- Table 37: Germany Advanced Visualization Tools Industry Revenue (billion) Forecast, by Application 2020 & 2033
- Table 38: Germany Advanced Visualization Tools Industry Volume (K Unit) Forecast, by Application 2020 & 2033
- Table 39: United Kingdom Advanced Visualization Tools Industry Revenue (billion) Forecast, by Application 2020 & 2033
- Table 40: United Kingdom Advanced Visualization Tools Industry Volume (K Unit) Forecast, by Application 2020 & 2033
- Table 41: France Advanced Visualization Tools Industry Revenue (billion) Forecast, by Application 2020 & 2033
- Table 42: France Advanced Visualization Tools Industry Volume (K Unit) Forecast, by Application 2020 & 2033
- Table 43: Italy Advanced Visualization Tools Industry Revenue (billion) Forecast, by Application 2020 & 2033
- Table 44: Italy Advanced Visualization Tools Industry Volume (K Unit) Forecast, by Application 2020 & 2033
- Table 45: Spain Advanced Visualization Tools Industry Revenue (billion) Forecast, by Application 2020 & 2033
- Table 46: Spain Advanced Visualization Tools Industry Volume (K Unit) Forecast, by Application 2020 & 2033
- Table 47: Rest of Europe Advanced Visualization Tools Industry Revenue (billion) Forecast, by Application 2020 & 2033
- Table 48: Rest of Europe Advanced Visualization Tools Industry Volume (K Unit) Forecast, by Application 2020 & 2033
- Table 49: Global Advanced Visualization Tools Industry Revenue billion Forecast, by Product and Service 2020 & 2033
- Table 50: Global Advanced Visualization Tools Industry Volume K Unit Forecast, by Product and Service 2020 & 2033
- Table 51: Global Advanced Visualization Tools Industry Revenue billion Forecast, by Type of Solution 2020 & 2033
- Table 52: Global Advanced Visualization Tools Industry Volume K Unit Forecast, by Type of Solution 2020 & 2033
- Table 53: Global Advanced Visualization Tools Industry Revenue billion Forecast, by Imaging Modality 2020 & 2033
- Table 54: Global Advanced Visualization Tools Industry Volume K Unit Forecast, by Imaging Modality 2020 & 2033
- Table 55: Global Advanced Visualization Tools Industry Revenue billion Forecast, by Clinical Application 2020 & 2033
- Table 56: Global Advanced Visualization Tools Industry Volume K Unit Forecast, by Clinical Application 2020 & 2033
- Table 57: Global Advanced Visualization Tools Industry Revenue billion Forecast, by Country 2020 & 2033
- Table 58: Global Advanced Visualization Tools Industry Volume K Unit Forecast, by Country 2020 & 2033
- Table 59: China Advanced Visualization Tools Industry Revenue (billion) Forecast, by Application 2020 & 2033
- Table 60: China Advanced Visualization Tools Industry Volume (K Unit) Forecast, by Application 2020 & 2033
- Table 61: Japan Advanced Visualization Tools Industry Revenue (billion) Forecast, by Application 2020 & 2033
- Table 62: Japan Advanced Visualization Tools Industry Volume (K Unit) Forecast, by Application 2020 & 2033
- Table 63: India Advanced Visualization Tools Industry Revenue (billion) Forecast, by Application 2020 & 2033
- Table 64: India Advanced Visualization Tools Industry Volume (K Unit) Forecast, by Application 2020 & 2033
- Table 65: Australia Advanced Visualization Tools Industry Revenue (billion) Forecast, by Application 2020 & 2033
- Table 66: Australia Advanced Visualization Tools Industry Volume (K Unit) Forecast, by Application 2020 & 2033
- Table 67: South Korea Advanced Visualization Tools Industry Revenue (billion) Forecast, by Application 2020 & 2033
- Table 68: South Korea Advanced Visualization Tools Industry Volume (K Unit) Forecast, by Application 2020 & 2033
- Table 69: Rest of Asia Pacific Advanced Visualization Tools Industry Revenue (billion) Forecast, by Application 2020 & 2033
- Table 70: Rest of Asia Pacific Advanced Visualization Tools Industry Volume (K Unit) Forecast, by Application 2020 & 2033
- Table 71: Global Advanced Visualization Tools Industry Revenue billion Forecast, by Product and Service 2020 & 2033
- Table 72: Global Advanced Visualization Tools Industry Volume K Unit Forecast, by Product and Service 2020 & 2033
- Table 73: Global Advanced Visualization Tools Industry Revenue billion Forecast, by Type of Solution 2020 & 2033
- Table 74: Global Advanced Visualization Tools Industry Volume K Unit Forecast, by Type of Solution 2020 & 2033
- Table 75: Global Advanced Visualization Tools Industry Revenue billion Forecast, by Imaging Modality 2020 & 2033
- Table 76: Global Advanced Visualization Tools Industry Volume K Unit Forecast, by Imaging Modality 2020 & 2033
- Table 77: Global Advanced Visualization Tools Industry Revenue billion Forecast, by Clinical Application 2020 & 2033
- Table 78: Global Advanced Visualization Tools Industry Volume K Unit Forecast, by Clinical Application 2020 & 2033
- Table 79: Global Advanced Visualization Tools Industry Revenue billion Forecast, by Country 2020 & 2033
- Table 80: Global Advanced Visualization Tools Industry Volume K Unit Forecast, by Country 2020 & 2033
- Table 81: GCC Advanced Visualization Tools Industry Revenue (billion) Forecast, by Application 2020 & 2033
- Table 82: GCC Advanced Visualization Tools Industry Volume (K Unit) Forecast, by Application 2020 & 2033
- Table 83: South Africa Advanced Visualization Tools Industry Revenue (billion) Forecast, by Application 2020 & 2033
- Table 84: South Africa Advanced Visualization Tools Industry Volume (K Unit) Forecast, by Application 2020 & 2033
- Table 85: Rest of Middle East and Africa Advanced Visualization Tools Industry Revenue (billion) Forecast, by Application 2020 & 2033
- Table 86: Rest of Middle East and Africa Advanced Visualization Tools Industry Volume (K Unit) Forecast, by Application 2020 & 2033
- Table 87: Global Advanced Visualization Tools Industry Revenue billion Forecast, by Product and Service 2020 & 2033
- Table 88: Global Advanced Visualization Tools Industry Volume K Unit Forecast, by Product and Service 2020 & 2033
- Table 89: Global Advanced Visualization Tools Industry Revenue billion Forecast, by Type of Solution 2020 & 2033
- Table 90: Global Advanced Visualization Tools Industry Volume K Unit Forecast, by Type of Solution 2020 & 2033
- Table 91: Global Advanced Visualization Tools Industry Revenue billion Forecast, by Imaging Modality 2020 & 2033
- Table 92: Global Advanced Visualization Tools Industry Volume K Unit Forecast, by Imaging Modality 2020 & 2033
- Table 93: Global Advanced Visualization Tools Industry Revenue billion Forecast, by Clinical Application 2020 & 2033
- Table 94: Global Advanced Visualization Tools Industry Volume K Unit Forecast, by Clinical Application 2020 & 2033
- Table 95: Global Advanced Visualization Tools Industry Revenue billion Forecast, by Country 2020 & 2033
- Table 96: Global Advanced Visualization Tools Industry Volume K Unit Forecast, by Country 2020 & 2033
- Table 97: Brazil Advanced Visualization Tools Industry Revenue (billion) Forecast, by Application 2020 & 2033
- Table 98: Brazil Advanced Visualization Tools Industry Volume (K Unit) Forecast, by Application 2020 & 2033
- Table 99: Argentina Advanced Visualization Tools Industry Revenue (billion) Forecast, by Application 2020 & 2033
- Table 100: Argentina Advanced Visualization Tools Industry Volume (K Unit) Forecast, by Application 2020 & 2033
- Table 101: Rest of South America Advanced Visualization Tools Industry Revenue (billion) Forecast, by Application 2020 & 2033
- Table 102: Rest of South America Advanced Visualization Tools Industry Volume (K Unit) Forecast, by Application 2020 & 2033
Frequently Asked Questions
1. What is the projected Compound Annual Growth Rate (CAGR) of the Advanced Visualization Tools Industry?
The projected CAGR is approximately 13.8%.
2. Which companies are prominent players in the Advanced Visualization Tools Industry?
Key companies in the market include Siemens Healthcare GmbH, Canon Inc (Canon Medical Systems Corporation), Terarecon Inc , Carestream Health, General Electric Company (GE Healthcare), Koninklijke Philips NV, Pro Medicus Ltd, Agfa-Gevaert Group, Fujifilm Holdings Corporation.
3. What are the main segments of the Advanced Visualization Tools Industry?
The market segments include Product and Service, Type of Solution, Imaging Modality, Clinical Application.
4. Can you provide details about the market size?
The market size is estimated to be USD 4.14 billion as of 2022.
5. What are some drivers contributing to market growth?
Increasing Prevalence of Chronic Diseases Coupled With Growing Geriatric Population; Rising Awareness of Benefits associated with Advanced Visualization Tools in Disease Diagnosis.
6. What are the notable trends driving market growth?
Oncology Under Clinical Application Expected to Grow Over the Forecast Period.
7. Are there any restraints impacting market growth?
Limited Availability of Reimbursements for Radiology-Based Diagnostic Procedures.
8. Can you provide examples of recent developments in the market?
August 2022: Kitware launched MIQA, a cloud-based application for medical image quality assurance. It facilitates collaboration and longitudinal studies by geographically diverse teams.
9. What pricing options are available for accessing the report?
Pricing options include single-user, multi-user, and enterprise licenses priced at USD 4750, USD 5250, and USD 8750 respectively.
10. Is the market size provided in terms of value or volume?
The market size is provided in terms of value, measured in billion and volume, measured in K Unit.
11. Are there any specific market keywords associated with the report?
Yes, the market keyword associated with the report is "Advanced Visualization Tools Industry," which aids in identifying and referencing the specific market segment covered.
12. How do I determine which pricing option suits my needs best?
The pricing options vary based on user requirements and access needs. Individual users may opt for single-user licenses, while businesses requiring broader access may choose multi-user or enterprise licenses for cost-effective access to the report.
13. Are there any additional resources or data provided in the Advanced Visualization Tools Industry report?
While the report offers comprehensive insights, it's advisable to review the specific contents or supplementary materials provided to ascertain if additional resources or data are available.
14. How can I stay updated on further developments or reports in the Advanced Visualization Tools Industry?
To stay informed about further developments, trends, and reports in the Advanced Visualization Tools Industry, consider subscribing to industry newsletters, following relevant companies and organizations, or regularly checking reputable industry news sources and publications.
Methodology
Step 1 - Identification of Relevant Samples Size from Population Database


Step 2 - Approaches for Defining Global Market Size (Value, Volume* & Price*)

Note*: In applicable scenarios
Step 3 - Data Sources
Primary Research
- Web Analytics
- Survey Reports
- Research Institute
- Latest Research Reports
- Opinion Leaders
Secondary Research
- Annual Reports
- White Paper
- Latest Press Release
- Industry Association
- Paid Database
- Investor Presentations

Step 4 - Data Triangulation
Involves using different sources of information in order to increase the validity of a study
These sources are likely to be stakeholders in a program - participants, other researchers, program staff, other community members, and so on.
Then we put all data in single framework & apply various statistical tools to find out the dynamic on the market.
During the analysis stage, feedback from the stakeholder groups would be compared to determine areas of agreement as well as areas of divergence