

Key Insights
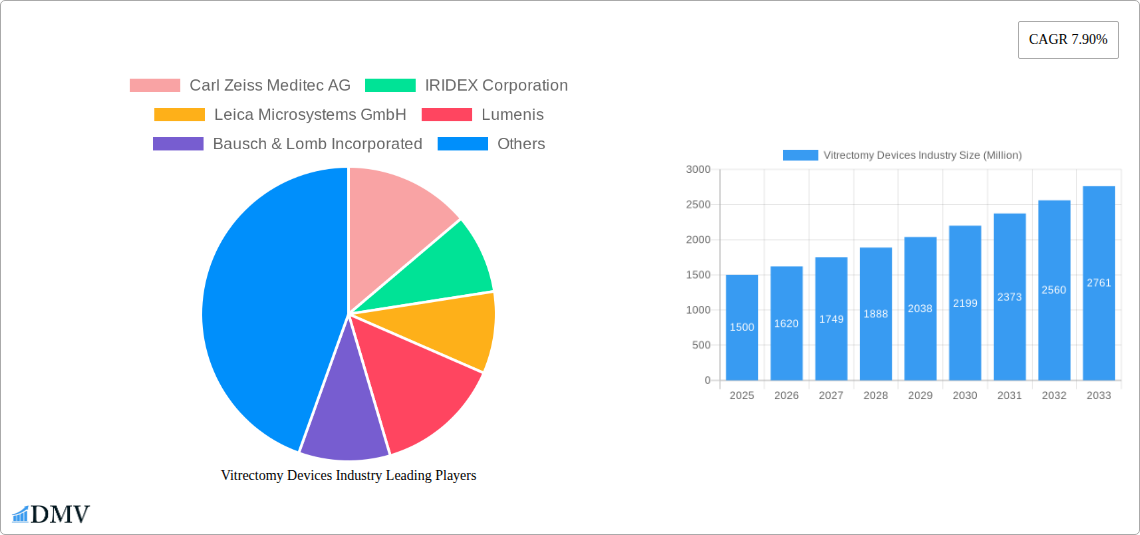
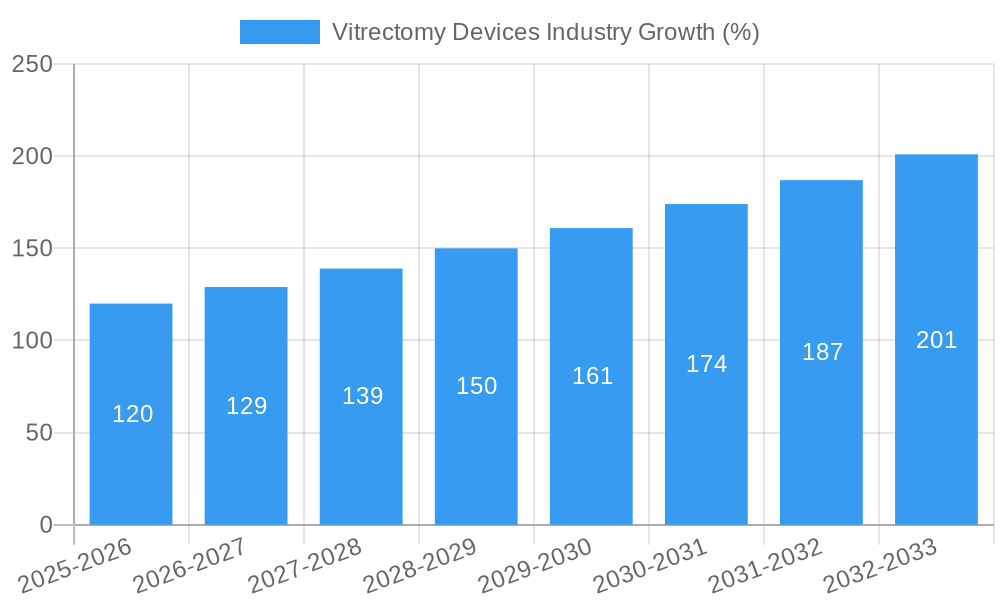
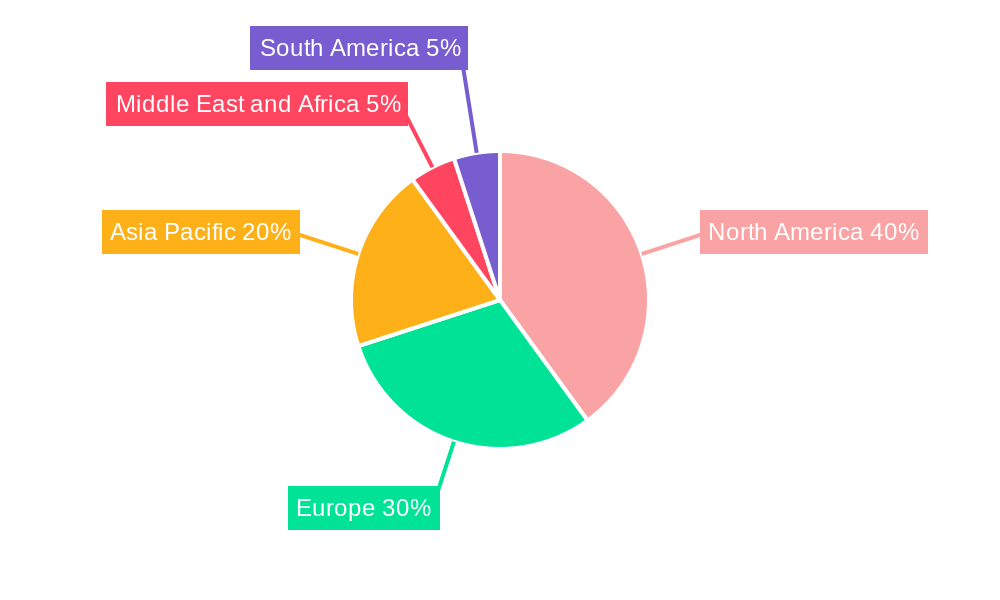
The global vitrectomy devices market is experiencing robust growth, driven by rising prevalence of retinal diseases like diabetic retinopathy and macular degeneration, an aging global population, and technological advancements leading to minimally invasive and improved surgical procedures. The market, valued at approximately $1.5 billion in 2025, is projected to maintain a Compound Annual Growth Rate (CAGR) of 7.90% from 2025 to 2033, reaching an estimated value exceeding $3 billion by 2033. This expansion is fueled by increased demand for sophisticated vitrectomy machines offering enhanced precision and visualization, as well as the development of advanced laser technologies and improved surgical instruments. North America currently holds a significant market share due to high healthcare expenditure and technological advancements within the region. However, Asia-Pacific is anticipated to witness the fastest growth during the forecast period, driven by expanding healthcare infrastructure, rising disposable incomes, and increasing awareness of retinal diseases in developing economies such as India and China.
The market segmentation reveals significant opportunities across various product types. Vitrectomy machines and packs constitute a large segment, reflecting the core nature of vitrectomy procedures. Retinal laser equipment and surgical instruments are also important segments, representing supporting technologies and tools vital for successful procedures. Applications like diabetic retinopathy and retinal detachment are major drivers, indicating the significant role vitrectomy plays in managing these prevalent conditions. While the market faces restraints including high procedure costs and the need for skilled surgeons, the ongoing technological innovations and expanding access to healthcare are expected to mitigate these challenges, ensuring continued growth in the coming years. Key players like Carl Zeiss Meditec AG, Alcon Inc., and Bausch & Lomb Incorporated are at the forefront of innovation and competition, constantly striving to enhance product offerings and expand their market reach.
Vitrectomy Devices Industry Market Report: 2019-2033
This comprehensive report provides an in-depth analysis of the global Vitrectomy Devices market, offering valuable insights for stakeholders, investors, and industry professionals. The study covers the period from 2019 to 2033, with a focus on the 2025-2033 forecast period. The base year for this analysis is 2025. The report meticulously examines market dynamics, technological advancements, competitive landscapes, and future growth prospects, providing a robust foundation for informed decision-making. The global market size is projected to reach xx Million by 2033.
Vitrectomy Devices Industry Market Composition & Trends
The global vitrectomy devices market is characterized by a moderately consolidated structure, with key players holding significant market share. The market share distribution in 2025 is estimated as follows: Alcon Inc (xx%), Carl Zeiss Meditec AG (xx%), Bausch & Lomb Incorporated (xx%), and others (xx%). Innovation is a key driver, fueled by advancements in minimally invasive surgical techniques and the development of sophisticated instruments. The regulatory landscape, particularly FDA approvals in major markets, significantly influences market growth. Substitute products are limited, primarily due to the specialized nature of vitrectomy procedures. End-users are primarily ophthalmologists and eye surgeons in hospitals and specialized clinics. M&A activity has been moderate, with several smaller acquisitions in recent years totaling an estimated xx Million in deal value.
- Market Concentration: Moderately Consolidated
- Innovation Catalysts: Minimally invasive techniques, advanced instrumentation.
- Regulatory Landscape: FDA approvals, CE markings.
- Substitute Products: Limited alternatives.
- End-Users: Ophthalmologists, eye surgeons.
- M&A Activity: Moderate, xx Million in deal value (2019-2024).
Vitrectomy Devices Industry Evolution
The vitrectomy devices market has experienced significant growth throughout the historical period (2019-2024), driven by increasing prevalence of retinal diseases like diabetic retinopathy and retinal detachment, coupled with technological advancements leading to improved surgical outcomes and patient recovery. The market witnessed a Compound Annual Growth Rate (CAGR) of xx% between 2019 and 2024. Technological advancements such as 25-gauge vitrectomy systems, improved imaging technologies, and the integration of advanced laser systems have significantly enhanced surgical precision and efficiency. Growing demand for minimally invasive procedures, driven by shorter recovery times and reduced risks, also contributes to market expansion. Technological advancements like the incorporation of artificial intelligence in image analysis and robotic assistance are expected to further propel the market growth in the forecast period (2025-2033). The adoption rate of advanced vitrectomy systems is projected to increase by xx% annually during the forecast period. Consumer demands are increasingly focusing on improved precision, smaller incisions, and faster recovery times.
Leading Regions, Countries, or Segments in Vitrectomy Devices Industry
North America currently holds the largest market share, driven by high healthcare expenditure, advanced healthcare infrastructure, and a high prevalence of age-related retinal diseases. Within the application segments, Diabetic Retinopathy and Retinal Detachment constitute the largest market share, while within product types, Vitrectomy Machines and Packs lead the market.
- Key Drivers (North America): High healthcare spending, advanced infrastructure, high prevalence of age-related diseases.
- Key Drivers (Diabetic Retinopathy): Increasing prevalence of diabetes, improved diagnostic capabilities.
- Key Drivers (Vitrectomy Machines & Packs): Technological advancements, preference for minimally invasive procedures.
The growth of other segments like other applications (e.g., macular hole repair) and other product types (e.g., disposables) is also expected to significantly contribute to the market's overall expansion, driven by increasing research and development efforts and the introduction of technologically advanced devices. Strong regulatory support in various regions, particularly in North America and Europe, further bolsters growth.
Vitrectomy Devices Industry Product Innovations
Recent innovations focus on improving surgical precision, reducing invasiveness, and enhancing patient outcomes. This includes the development of smaller-gauge vitrectomy systems, improved illumination systems for better visualization, and the integration of advanced imaging technologies such as OCT (Optical Coherence Tomography) for real-time intraoperative guidance. Unique selling propositions include faster surgery times, reduced trauma, and improved visual acuity post-surgery.
Propelling Factors for Vitrectomy Devices Industry Growth
The vitrectomy devices market is fueled by several key factors. Technological advancements, such as the development of 25-gauge and smaller vitrectomy systems, offer minimally invasive solutions leading to faster recovery times and reduced complications. Increasing prevalence of retinal diseases, particularly age-related macular degeneration and diabetic retinopathy, significantly expands the target patient population. Favorable reimbursement policies and regulatory approvals in various countries facilitate market penetration.
Obstacles in the Vitrectomy Devices Industry Market
The market faces challenges, including high device costs, stringent regulatory requirements that can delay product launches, and the potential for supply chain disruptions affecting the availability of critical components. Intense competition among established players and the emergence of new entrants put pressure on pricing and margins. The estimated impact of these challenges on market growth is projected to be approximately xx% by 2033.
Future Opportunities in Vitrectomy Devices Industry
Future opportunities lie in the development of innovative technologies, such as robotic-assisted vitrectomy systems and AI-powered image analysis tools. Expansion into emerging markets with growing awareness of retinal diseases and increasing access to healthcare services presents significant growth potential. The development of personalized treatment strategies and minimally invasive techniques will further drive market growth.
Major Players in the Vitrectomy Devices Industry Ecosystem
- Carl Zeiss Meditec AG
- IRIDEX Corporation
- Leica Microsystems GmbH
- Lumenis
- Bausch & Lomb Incorporated
- Topcon Corporation
- NIDEK CO LTD
- Alcon Inc
- Ellex Medical Lasers
Key Developments in Vitrectomy Devices Industry Industry
- April 2022: Parkhurst NuVision launched EVO Visian ICL, a new vision device in the US after receiving FDA approval.
- April 2022: Nova Eye Medical announced the launch of its next-generation canaloplasty device, iTrack Advance, in select markets in Europe and the Asia Pacific.
Strategic Vitrectomy Devices Industry Market Forecast
The vitrectomy devices market is poised for significant growth during the forecast period (2025-2033), driven by technological advancements, increasing prevalence of retinal diseases, and expansion into emerging markets. The market is expected to witness a robust CAGR of xx%, reaching an estimated xx Million by 2033. The focus on minimally invasive procedures, improved surgical outcomes, and the adoption of advanced technologies will continue to shape the market's trajectory. This growth will be further fueled by rising healthcare expenditure and increasing awareness of eye health issues globally.
Vitrectomy Devices Industry Segmentation
-
1. Product Type
- 1.1. Vitrectomy Machines and Packs
- 1.2. Retinal Laser Equipment
- 1.3. Surgical Instruments
- 1.4. Other Products
-
2. Application
- 2.1. Diabetic Retinopathy
- 2.2. Retinal Detachment
- 2.3. Other Applications
Vitrectomy Devices Industry Segmentation By Geography
-
1. North America
- 1.1. United States
- 1.2. Canada
- 1.3. Mexico
-
2. Europe
- 2.1. Germany
- 2.2. United Kingdom
- 2.3. France
- 2.4. Italy
- 2.5. Spain
- 2.6. Rest of Europe
-
3. Asia Pacific
- 3.1. China
- 3.2. Japan
- 3.3. India
- 3.4. Australia
- 3.5. South Korea
- 3.6. Rest of Asia Pacific
-
4. Middle East and Africa
- 4.1. GCC
- 4.2. South Africa
- 4.3. Rest of Middle East and Africa
-
5. South America
- 5.1. Brazil
- 5.2. Argentina
- 5.3. Rest of South America
Vitrectomy Devices Industry REPORT HIGHLIGHTS
| Aspects | Details |
|---|---|
| Study Period | 2019-2033 |
| Base Year | 2024 |
| Estimated Year | 2025 |
| Forecast Period | 2025-2033 |
| Historical Period | 2019-2024 |
| Growth Rate | CAGR of 7.90% from 2019-2033 |
| Segmentation |
|
Table of Contents
- 1. Introduction
- 1.1. Research Scope
- 1.2. Market Segmentation
- 1.3. Research Methodology
- 1.4. Definitions and Assumptions
- 2. Executive Summary
- 2.1. Introduction
- 3. Market Dynamics
- 3.1. Introduction
- 3.2. Market Drivers
- 3.2.1. Rising Geriatric Population and Increasing Prevalence of Eye Diseases; Increasing Demand for Minimally Invasive Surgeries
- 3.3. Market Restrains
- 3.3.1. High Cost of Retinal Surgery Devices; Complications Associated with the Retinal Surgeries
- 3.4. Market Trends
- 3.4.1. Diabetic Retinopathy Segment is Expected to Witness Healthy Growth in the Coming Years
- 4. Market Factor Analysis
- 4.1. Porters Five Forces
- 4.2. Supply/Value Chain
- 4.3. PESTEL analysis
- 4.4. Market Entropy
- 4.5. Patent/Trademark Analysis
- 5. Global Vitrectomy Devices Industry Analysis, Insights and Forecast, 2019-2031
- 5.1. Market Analysis, Insights and Forecast - by Product Type
- 5.1.1. Vitrectomy Machines and Packs
- 5.1.2. Retinal Laser Equipment
- 5.1.3. Surgical Instruments
- 5.1.4. Other Products
- 5.2. Market Analysis, Insights and Forecast - by Application
- 5.2.1. Diabetic Retinopathy
- 5.2.2. Retinal Detachment
- 5.2.3. Other Applications
- 5.3. Market Analysis, Insights and Forecast - by Region
- 5.3.1. North America
- 5.3.2. Europe
- 5.3.3. Asia Pacific
- 5.3.4. Middle East and Africa
- 5.3.5. South America
- 5.1. Market Analysis, Insights and Forecast - by Product Type
- 6. North America Vitrectomy Devices Industry Analysis, Insights and Forecast, 2019-2031
- 6.1. Market Analysis, Insights and Forecast - by Product Type
- 6.1.1. Vitrectomy Machines and Packs
- 6.1.2. Retinal Laser Equipment
- 6.1.3. Surgical Instruments
- 6.1.4. Other Products
- 6.2. Market Analysis, Insights and Forecast - by Application
- 6.2.1. Diabetic Retinopathy
- 6.2.2. Retinal Detachment
- 6.2.3. Other Applications
- 6.1. Market Analysis, Insights and Forecast - by Product Type
- 7. Europe Vitrectomy Devices Industry Analysis, Insights and Forecast, 2019-2031
- 7.1. Market Analysis, Insights and Forecast - by Product Type
- 7.1.1. Vitrectomy Machines and Packs
- 7.1.2. Retinal Laser Equipment
- 7.1.3. Surgical Instruments
- 7.1.4. Other Products
- 7.2. Market Analysis, Insights and Forecast - by Application
- 7.2.1. Diabetic Retinopathy
- 7.2.2. Retinal Detachment
- 7.2.3. Other Applications
- 7.1. Market Analysis, Insights and Forecast - by Product Type
- 8. Asia Pacific Vitrectomy Devices Industry Analysis, Insights and Forecast, 2019-2031
- 8.1. Market Analysis, Insights and Forecast - by Product Type
- 8.1.1. Vitrectomy Machines and Packs
- 8.1.2. Retinal Laser Equipment
- 8.1.3. Surgical Instruments
- 8.1.4. Other Products
- 8.2. Market Analysis, Insights and Forecast - by Application
- 8.2.1. Diabetic Retinopathy
- 8.2.2. Retinal Detachment
- 8.2.3. Other Applications
- 8.1. Market Analysis, Insights and Forecast - by Product Type
- 9. Middle East and Africa Vitrectomy Devices Industry Analysis, Insights and Forecast, 2019-2031
- 9.1. Market Analysis, Insights and Forecast - by Product Type
- 9.1.1. Vitrectomy Machines and Packs
- 9.1.2. Retinal Laser Equipment
- 9.1.3. Surgical Instruments
- 9.1.4. Other Products
- 9.2. Market Analysis, Insights and Forecast - by Application
- 9.2.1. Diabetic Retinopathy
- 9.2.2. Retinal Detachment
- 9.2.3. Other Applications
- 9.1. Market Analysis, Insights and Forecast - by Product Type
- 10. South America Vitrectomy Devices Industry Analysis, Insights and Forecast, 2019-2031
- 10.1. Market Analysis, Insights and Forecast - by Product Type
- 10.1.1. Vitrectomy Machines and Packs
- 10.1.2. Retinal Laser Equipment
- 10.1.3. Surgical Instruments
- 10.1.4. Other Products
- 10.2. Market Analysis, Insights and Forecast - by Application
- 10.2.1. Diabetic Retinopathy
- 10.2.2. Retinal Detachment
- 10.2.3. Other Applications
- 10.1. Market Analysis, Insights and Forecast - by Product Type
- 11. North America Vitrectomy Devices Industry Analysis, Insights and Forecast, 2019-2031
- 11.1. Market Analysis, Insights and Forecast - By Country/Sub-region
- 11.1.1 United States
- 11.1.2 Canada
- 11.1.3 Mexico
- 12. Europe Vitrectomy Devices Industry Analysis, Insights and Forecast, 2019-2031
- 12.1. Market Analysis, Insights and Forecast - By Country/Sub-region
- 12.1.1 Germany
- 12.1.2 United Kingdom
- 12.1.3 France
- 12.1.4 Italy
- 12.1.5 Spain
- 12.1.6 Rest of Europe
- 13. Asia Pacific Vitrectomy Devices Industry Analysis, Insights and Forecast, 2019-2031
- 13.1. Market Analysis, Insights and Forecast - By Country/Sub-region
- 13.1.1 China
- 13.1.2 Japan
- 13.1.3 India
- 13.1.4 Australia
- 13.1.5 South Korea
- 13.1.6 Rest of Asia Pacific
- 14. Middle East and Africa Vitrectomy Devices Industry Analysis, Insights and Forecast, 2019-2031
- 14.1. Market Analysis, Insights and Forecast - By Country/Sub-region
- 14.1.1 GCC
- 14.1.2 South Africa
- 14.1.3 Rest of Middle East and Africa
- 15. South America Vitrectomy Devices Industry Analysis, Insights and Forecast, 2019-2031
- 15.1. Market Analysis, Insights and Forecast - By Country/Sub-region
- 15.1.1 Brazil
- 15.1.2 Argentina
- 15.1.3 Rest of South America
- 16. Competitive Analysis
- 16.1. Global Market Share Analysis 2024
- 16.2. Company Profiles
- 16.2.1 Carl Zeiss Meditec AG
- 16.2.1.1. Overview
- 16.2.1.2. Products
- 16.2.1.3. SWOT Analysis
- 16.2.1.4. Recent Developments
- 16.2.1.5. Financials (Based on Availability)
- 16.2.2 IRIDEX Corporation
- 16.2.2.1. Overview
- 16.2.2.2. Products
- 16.2.2.3. SWOT Analysis
- 16.2.2.4. Recent Developments
- 16.2.2.5. Financials (Based on Availability)
- 16.2.3 Leica Microsystems GmbH
- 16.2.3.1. Overview
- 16.2.3.2. Products
- 16.2.3.3. SWOT Analysis
- 16.2.3.4. Recent Developments
- 16.2.3.5. Financials (Based on Availability)
- 16.2.4 Lumenis
- 16.2.4.1. Overview
- 16.2.4.2. Products
- 16.2.4.3. SWOT Analysis
- 16.2.4.4. Recent Developments
- 16.2.4.5. Financials (Based on Availability)
- 16.2.5 Bausch & Lomb Incorporated
- 16.2.5.1. Overview
- 16.2.5.2. Products
- 16.2.5.3. SWOT Analysis
- 16.2.5.4. Recent Developments
- 16.2.5.5. Financials (Based on Availability)
- 16.2.6 Topcon Corporation
- 16.2.6.1. Overview
- 16.2.6.2. Products
- 16.2.6.3. SWOT Analysis
- 16.2.6.4. Recent Developments
- 16.2.6.5. Financials (Based on Availability)
- 16.2.7 NIDEK CO LTD
- 16.2.7.1. Overview
- 16.2.7.2. Products
- 16.2.7.3. SWOT Analysis
- 16.2.7.4. Recent Developments
- 16.2.7.5. Financials (Based on Availability)
- 16.2.8 Alcon Inc
- 16.2.8.1. Overview
- 16.2.8.2. Products
- 16.2.8.3. SWOT Analysis
- 16.2.8.4. Recent Developments
- 16.2.8.5. Financials (Based on Availability)
- 16.2.9 Ellex Medical Lasers
- 16.2.9.1. Overview
- 16.2.9.2. Products
- 16.2.9.3. SWOT Analysis
- 16.2.9.4. Recent Developments
- 16.2.9.5. Financials (Based on Availability)
- 16.2.1 Carl Zeiss Meditec AG
List of Figures
- Figure 1: Global Vitrectomy Devices Industry Revenue Breakdown (Million, %) by Region 2024 & 2032
- Figure 2: Global Vitrectomy Devices Industry Volume Breakdown (K Unit, %) by Region 2024 & 2032
- Figure 3: North America Vitrectomy Devices Industry Revenue (Million), by Country 2024 & 2032
- Figure 4: North America Vitrectomy Devices Industry Volume (K Unit), by Country 2024 & 2032
- Figure 5: North America Vitrectomy Devices Industry Revenue Share (%), by Country 2024 & 2032
- Figure 6: North America Vitrectomy Devices Industry Volume Share (%), by Country 2024 & 2032
- Figure 7: Europe Vitrectomy Devices Industry Revenue (Million), by Country 2024 & 2032
- Figure 8: Europe Vitrectomy Devices Industry Volume (K Unit), by Country 2024 & 2032
- Figure 9: Europe Vitrectomy Devices Industry Revenue Share (%), by Country 2024 & 2032
- Figure 10: Europe Vitrectomy Devices Industry Volume Share (%), by Country 2024 & 2032
- Figure 11: Asia Pacific Vitrectomy Devices Industry Revenue (Million), by Country 2024 & 2032
- Figure 12: Asia Pacific Vitrectomy Devices Industry Volume (K Unit), by Country 2024 & 2032
- Figure 13: Asia Pacific Vitrectomy Devices Industry Revenue Share (%), by Country 2024 & 2032
- Figure 14: Asia Pacific Vitrectomy Devices Industry Volume Share (%), by Country 2024 & 2032
- Figure 15: Middle East and Africa Vitrectomy Devices Industry Revenue (Million), by Country 2024 & 2032
- Figure 16: Middle East and Africa Vitrectomy Devices Industry Volume (K Unit), by Country 2024 & 2032
- Figure 17: Middle East and Africa Vitrectomy Devices Industry Revenue Share (%), by Country 2024 & 2032
- Figure 18: Middle East and Africa Vitrectomy Devices Industry Volume Share (%), by Country 2024 & 2032
- Figure 19: South America Vitrectomy Devices Industry Revenue (Million), by Country 2024 & 2032
- Figure 20: South America Vitrectomy Devices Industry Volume (K Unit), by Country 2024 & 2032
- Figure 21: South America Vitrectomy Devices Industry Revenue Share (%), by Country 2024 & 2032
- Figure 22: South America Vitrectomy Devices Industry Volume Share (%), by Country 2024 & 2032
- Figure 23: North America Vitrectomy Devices Industry Revenue (Million), by Product Type 2024 & 2032
- Figure 24: North America Vitrectomy Devices Industry Volume (K Unit), by Product Type 2024 & 2032
- Figure 25: North America Vitrectomy Devices Industry Revenue Share (%), by Product Type 2024 & 2032
- Figure 26: North America Vitrectomy Devices Industry Volume Share (%), by Product Type 2024 & 2032
- Figure 27: North America Vitrectomy Devices Industry Revenue (Million), by Application 2024 & 2032
- Figure 28: North America Vitrectomy Devices Industry Volume (K Unit), by Application 2024 & 2032
- Figure 29: North America Vitrectomy Devices Industry Revenue Share (%), by Application 2024 & 2032
- Figure 30: North America Vitrectomy Devices Industry Volume Share (%), by Application 2024 & 2032
- Figure 31: North America Vitrectomy Devices Industry Revenue (Million), by Country 2024 & 2032
- Figure 32: North America Vitrectomy Devices Industry Volume (K Unit), by Country 2024 & 2032
- Figure 33: North America Vitrectomy Devices Industry Revenue Share (%), by Country 2024 & 2032
- Figure 34: North America Vitrectomy Devices Industry Volume Share (%), by Country 2024 & 2032
- Figure 35: Europe Vitrectomy Devices Industry Revenue (Million), by Product Type 2024 & 2032
- Figure 36: Europe Vitrectomy Devices Industry Volume (K Unit), by Product Type 2024 & 2032
- Figure 37: Europe Vitrectomy Devices Industry Revenue Share (%), by Product Type 2024 & 2032
- Figure 38: Europe Vitrectomy Devices Industry Volume Share (%), by Product Type 2024 & 2032
- Figure 39: Europe Vitrectomy Devices Industry Revenue (Million), by Application 2024 & 2032
- Figure 40: Europe Vitrectomy Devices Industry Volume (K Unit), by Application 2024 & 2032
- Figure 41: Europe Vitrectomy Devices Industry Revenue Share (%), by Application 2024 & 2032
- Figure 42: Europe Vitrectomy Devices Industry Volume Share (%), by Application 2024 & 2032
- Figure 43: Europe Vitrectomy Devices Industry Revenue (Million), by Country 2024 & 2032
- Figure 44: Europe Vitrectomy Devices Industry Volume (K Unit), by Country 2024 & 2032
- Figure 45: Europe Vitrectomy Devices Industry Revenue Share (%), by Country 2024 & 2032
- Figure 46: Europe Vitrectomy Devices Industry Volume Share (%), by Country 2024 & 2032
- Figure 47: Asia Pacific Vitrectomy Devices Industry Revenue (Million), by Product Type 2024 & 2032
- Figure 48: Asia Pacific Vitrectomy Devices Industry Volume (K Unit), by Product Type 2024 & 2032
- Figure 49: Asia Pacific Vitrectomy Devices Industry Revenue Share (%), by Product Type 2024 & 2032
- Figure 50: Asia Pacific Vitrectomy Devices Industry Volume Share (%), by Product Type 2024 & 2032
- Figure 51: Asia Pacific Vitrectomy Devices Industry Revenue (Million), by Application 2024 & 2032
- Figure 52: Asia Pacific Vitrectomy Devices Industry Volume (K Unit), by Application 2024 & 2032
- Figure 53: Asia Pacific Vitrectomy Devices Industry Revenue Share (%), by Application 2024 & 2032
- Figure 54: Asia Pacific Vitrectomy Devices Industry Volume Share (%), by Application 2024 & 2032
- Figure 55: Asia Pacific Vitrectomy Devices Industry Revenue (Million), by Country 2024 & 2032
- Figure 56: Asia Pacific Vitrectomy Devices Industry Volume (K Unit), by Country 2024 & 2032
- Figure 57: Asia Pacific Vitrectomy Devices Industry Revenue Share (%), by Country 2024 & 2032
- Figure 58: Asia Pacific Vitrectomy Devices Industry Volume Share (%), by Country 2024 & 2032
- Figure 59: Middle East and Africa Vitrectomy Devices Industry Revenue (Million), by Product Type 2024 & 2032
- Figure 60: Middle East and Africa Vitrectomy Devices Industry Volume (K Unit), by Product Type 2024 & 2032
- Figure 61: Middle East and Africa Vitrectomy Devices Industry Revenue Share (%), by Product Type 2024 & 2032
- Figure 62: Middle East and Africa Vitrectomy Devices Industry Volume Share (%), by Product Type 2024 & 2032
- Figure 63: Middle East and Africa Vitrectomy Devices Industry Revenue (Million), by Application 2024 & 2032
- Figure 64: Middle East and Africa Vitrectomy Devices Industry Volume (K Unit), by Application 2024 & 2032
- Figure 65: Middle East and Africa Vitrectomy Devices Industry Revenue Share (%), by Application 2024 & 2032
- Figure 66: Middle East and Africa Vitrectomy Devices Industry Volume Share (%), by Application 2024 & 2032
- Figure 67: Middle East and Africa Vitrectomy Devices Industry Revenue (Million), by Country 2024 & 2032
- Figure 68: Middle East and Africa Vitrectomy Devices Industry Volume (K Unit), by Country 2024 & 2032
- Figure 69: Middle East and Africa Vitrectomy Devices Industry Revenue Share (%), by Country 2024 & 2032
- Figure 70: Middle East and Africa Vitrectomy Devices Industry Volume Share (%), by Country 2024 & 2032
- Figure 71: South America Vitrectomy Devices Industry Revenue (Million), by Product Type 2024 & 2032
- Figure 72: South America Vitrectomy Devices Industry Volume (K Unit), by Product Type 2024 & 2032
- Figure 73: South America Vitrectomy Devices Industry Revenue Share (%), by Product Type 2024 & 2032
- Figure 74: South America Vitrectomy Devices Industry Volume Share (%), by Product Type 2024 & 2032
- Figure 75: South America Vitrectomy Devices Industry Revenue (Million), by Application 2024 & 2032
- Figure 76: South America Vitrectomy Devices Industry Volume (K Unit), by Application 2024 & 2032
- Figure 77: South America Vitrectomy Devices Industry Revenue Share (%), by Application 2024 & 2032
- Figure 78: South America Vitrectomy Devices Industry Volume Share (%), by Application 2024 & 2032
- Figure 79: South America Vitrectomy Devices Industry Revenue (Million), by Country 2024 & 2032
- Figure 80: South America Vitrectomy Devices Industry Volume (K Unit), by Country 2024 & 2032
- Figure 81: South America Vitrectomy Devices Industry Revenue Share (%), by Country 2024 & 2032
- Figure 82: South America Vitrectomy Devices Industry Volume Share (%), by Country 2024 & 2032
List of Tables
- Table 1: Global Vitrectomy Devices Industry Revenue Million Forecast, by Region 2019 & 2032
- Table 2: Global Vitrectomy Devices Industry Volume K Unit Forecast, by Region 2019 & 2032
- Table 3: Global Vitrectomy Devices Industry Revenue Million Forecast, by Product Type 2019 & 2032
- Table 4: Global Vitrectomy Devices Industry Volume K Unit Forecast, by Product Type 2019 & 2032
- Table 5: Global Vitrectomy Devices Industry Revenue Million Forecast, by Application 2019 & 2032
- Table 6: Global Vitrectomy Devices Industry Volume K Unit Forecast, by Application 2019 & 2032
- Table 7: Global Vitrectomy Devices Industry Revenue Million Forecast, by Region 2019 & 2032
- Table 8: Global Vitrectomy Devices Industry Volume K Unit Forecast, by Region 2019 & 2032
- Table 9: Global Vitrectomy Devices Industry Revenue Million Forecast, by Country 2019 & 2032
- Table 10: Global Vitrectomy Devices Industry Volume K Unit Forecast, by Country 2019 & 2032
- Table 11: United States Vitrectomy Devices Industry Revenue (Million) Forecast, by Application 2019 & 2032
- Table 12: United States Vitrectomy Devices Industry Volume (K Unit) Forecast, by Application 2019 & 2032
- Table 13: Canada Vitrectomy Devices Industry Revenue (Million) Forecast, by Application 2019 & 2032
- Table 14: Canada Vitrectomy Devices Industry Volume (K Unit) Forecast, by Application 2019 & 2032
- Table 15: Mexico Vitrectomy Devices Industry Revenue (Million) Forecast, by Application 2019 & 2032
- Table 16: Mexico Vitrectomy Devices Industry Volume (K Unit) Forecast, by Application 2019 & 2032
- Table 17: Global Vitrectomy Devices Industry Revenue Million Forecast, by Country 2019 & 2032
- Table 18: Global Vitrectomy Devices Industry Volume K Unit Forecast, by Country 2019 & 2032
- Table 19: Germany Vitrectomy Devices Industry Revenue (Million) Forecast, by Application 2019 & 2032
- Table 20: Germany Vitrectomy Devices Industry Volume (K Unit) Forecast, by Application 2019 & 2032
- Table 21: United Kingdom Vitrectomy Devices Industry Revenue (Million) Forecast, by Application 2019 & 2032
- Table 22: United Kingdom Vitrectomy Devices Industry Volume (K Unit) Forecast, by Application 2019 & 2032
- Table 23: France Vitrectomy Devices Industry Revenue (Million) Forecast, by Application 2019 & 2032
- Table 24: France Vitrectomy Devices Industry Volume (K Unit) Forecast, by Application 2019 & 2032
- Table 25: Italy Vitrectomy Devices Industry Revenue (Million) Forecast, by Application 2019 & 2032
- Table 26: Italy Vitrectomy Devices Industry Volume (K Unit) Forecast, by Application 2019 & 2032
- Table 27: Spain Vitrectomy Devices Industry Revenue (Million) Forecast, by Application 2019 & 2032
- Table 28: Spain Vitrectomy Devices Industry Volume (K Unit) Forecast, by Application 2019 & 2032
- Table 29: Rest of Europe Vitrectomy Devices Industry Revenue (Million) Forecast, by Application 2019 & 2032
- Table 30: Rest of Europe Vitrectomy Devices Industry Volume (K Unit) Forecast, by Application 2019 & 2032
- Table 31: Global Vitrectomy Devices Industry Revenue Million Forecast, by Country 2019 & 2032
- Table 32: Global Vitrectomy Devices Industry Volume K Unit Forecast, by Country 2019 & 2032
- Table 33: China Vitrectomy Devices Industry Revenue (Million) Forecast, by Application 2019 & 2032
- Table 34: China Vitrectomy Devices Industry Volume (K Unit) Forecast, by Application 2019 & 2032
- Table 35: Japan Vitrectomy Devices Industry Revenue (Million) Forecast, by Application 2019 & 2032
- Table 36: Japan Vitrectomy Devices Industry Volume (K Unit) Forecast, by Application 2019 & 2032
- Table 37: India Vitrectomy Devices Industry Revenue (Million) Forecast, by Application 2019 & 2032
- Table 38: India Vitrectomy Devices Industry Volume (K Unit) Forecast, by Application 2019 & 2032
- Table 39: Australia Vitrectomy Devices Industry Revenue (Million) Forecast, by Application 2019 & 2032
- Table 40: Australia Vitrectomy Devices Industry Volume (K Unit) Forecast, by Application 2019 & 2032
- Table 41: South Korea Vitrectomy Devices Industry Revenue (Million) Forecast, by Application 2019 & 2032
- Table 42: South Korea Vitrectomy Devices Industry Volume (K Unit) Forecast, by Application 2019 & 2032
- Table 43: Rest of Asia Pacific Vitrectomy Devices Industry Revenue (Million) Forecast, by Application 2019 & 2032
- Table 44: Rest of Asia Pacific Vitrectomy Devices Industry Volume (K Unit) Forecast, by Application 2019 & 2032
- Table 45: Global Vitrectomy Devices Industry Revenue Million Forecast, by Country 2019 & 2032
- Table 46: Global Vitrectomy Devices Industry Volume K Unit Forecast, by Country 2019 & 2032
- Table 47: GCC Vitrectomy Devices Industry Revenue (Million) Forecast, by Application 2019 & 2032
- Table 48: GCC Vitrectomy Devices Industry Volume (K Unit) Forecast, by Application 2019 & 2032
- Table 49: South Africa Vitrectomy Devices Industry Revenue (Million) Forecast, by Application 2019 & 2032
- Table 50: South Africa Vitrectomy Devices Industry Volume (K Unit) Forecast, by Application 2019 & 2032
- Table 51: Rest of Middle East and Africa Vitrectomy Devices Industry Revenue (Million) Forecast, by Application 2019 & 2032
- Table 52: Rest of Middle East and Africa Vitrectomy Devices Industry Volume (K Unit) Forecast, by Application 2019 & 2032
- Table 53: Global Vitrectomy Devices Industry Revenue Million Forecast, by Country 2019 & 2032
- Table 54: Global Vitrectomy Devices Industry Volume K Unit Forecast, by Country 2019 & 2032
- Table 55: Brazil Vitrectomy Devices Industry Revenue (Million) Forecast, by Application 2019 & 2032
- Table 56: Brazil Vitrectomy Devices Industry Volume (K Unit) Forecast, by Application 2019 & 2032
- Table 57: Argentina Vitrectomy Devices Industry Revenue (Million) Forecast, by Application 2019 & 2032
- Table 58: Argentina Vitrectomy Devices Industry Volume (K Unit) Forecast, by Application 2019 & 2032
- Table 59: Rest of South America Vitrectomy Devices Industry Revenue (Million) Forecast, by Application 2019 & 2032
- Table 60: Rest of South America Vitrectomy Devices Industry Volume (K Unit) Forecast, by Application 2019 & 2032
- Table 61: Global Vitrectomy Devices Industry Revenue Million Forecast, by Product Type 2019 & 2032
- Table 62: Global Vitrectomy Devices Industry Volume K Unit Forecast, by Product Type 2019 & 2032
- Table 63: Global Vitrectomy Devices Industry Revenue Million Forecast, by Application 2019 & 2032
- Table 64: Global Vitrectomy Devices Industry Volume K Unit Forecast, by Application 2019 & 2032
- Table 65: Global Vitrectomy Devices Industry Revenue Million Forecast, by Country 2019 & 2032
- Table 66: Global Vitrectomy Devices Industry Volume K Unit Forecast, by Country 2019 & 2032
- Table 67: United States Vitrectomy Devices Industry Revenue (Million) Forecast, by Application 2019 & 2032
- Table 68: United States Vitrectomy Devices Industry Volume (K Unit) Forecast, by Application 2019 & 2032
- Table 69: Canada Vitrectomy Devices Industry Revenue (Million) Forecast, by Application 2019 & 2032
- Table 70: Canada Vitrectomy Devices Industry Volume (K Unit) Forecast, by Application 2019 & 2032
- Table 71: Mexico Vitrectomy Devices Industry Revenue (Million) Forecast, by Application 2019 & 2032
- Table 72: Mexico Vitrectomy Devices Industry Volume (K Unit) Forecast, by Application 2019 & 2032
- Table 73: Global Vitrectomy Devices Industry Revenue Million Forecast, by Product Type 2019 & 2032
- Table 74: Global Vitrectomy Devices Industry Volume K Unit Forecast, by Product Type 2019 & 2032
- Table 75: Global Vitrectomy Devices Industry Revenue Million Forecast, by Application 2019 & 2032
- Table 76: Global Vitrectomy Devices Industry Volume K Unit Forecast, by Application 2019 & 2032
- Table 77: Global Vitrectomy Devices Industry Revenue Million Forecast, by Country 2019 & 2032
- Table 78: Global Vitrectomy Devices Industry Volume K Unit Forecast, by Country 2019 & 2032
- Table 79: Germany Vitrectomy Devices Industry Revenue (Million) Forecast, by Application 2019 & 2032
- Table 80: Germany Vitrectomy Devices Industry Volume (K Unit) Forecast, by Application 2019 & 2032
- Table 81: United Kingdom Vitrectomy Devices Industry Revenue (Million) Forecast, by Application 2019 & 2032
- Table 82: United Kingdom Vitrectomy Devices Industry Volume (K Unit) Forecast, by Application 2019 & 2032
- Table 83: France Vitrectomy Devices Industry Revenue (Million) Forecast, by Application 2019 & 2032
- Table 84: France Vitrectomy Devices Industry Volume (K Unit) Forecast, by Application 2019 & 2032
- Table 85: Italy Vitrectomy Devices Industry Revenue (Million) Forecast, by Application 2019 & 2032
- Table 86: Italy Vitrectomy Devices Industry Volume (K Unit) Forecast, by Application 2019 & 2032
- Table 87: Spain Vitrectomy Devices Industry Revenue (Million) Forecast, by Application 2019 & 2032
- Table 88: Spain Vitrectomy Devices Industry Volume (K Unit) Forecast, by Application 2019 & 2032
- Table 89: Rest of Europe Vitrectomy Devices Industry Revenue (Million) Forecast, by Application 2019 & 2032
- Table 90: Rest of Europe Vitrectomy Devices Industry Volume (K Unit) Forecast, by Application 2019 & 2032
- Table 91: Global Vitrectomy Devices Industry Revenue Million Forecast, by Product Type 2019 & 2032
- Table 92: Global Vitrectomy Devices Industry Volume K Unit Forecast, by Product Type 2019 & 2032
- Table 93: Global Vitrectomy Devices Industry Revenue Million Forecast, by Application 2019 & 2032
- Table 94: Global Vitrectomy Devices Industry Volume K Unit Forecast, by Application 2019 & 2032
- Table 95: Global Vitrectomy Devices Industry Revenue Million Forecast, by Country 2019 & 2032
- Table 96: Global Vitrectomy Devices Industry Volume K Unit Forecast, by Country 2019 & 2032
- Table 97: China Vitrectomy Devices Industry Revenue (Million) Forecast, by Application 2019 & 2032
- Table 98: China Vitrectomy Devices Industry Volume (K Unit) Forecast, by Application 2019 & 2032
- Table 99: Japan Vitrectomy Devices Industry Revenue (Million) Forecast, by Application 2019 & 2032
- Table 100: Japan Vitrectomy Devices Industry Volume (K Unit) Forecast, by Application 2019 & 2032
- Table 101: India Vitrectomy Devices Industry Revenue (Million) Forecast, by Application 2019 & 2032
- Table 102: India Vitrectomy Devices Industry Volume (K Unit) Forecast, by Application 2019 & 2032
- Table 103: Australia Vitrectomy Devices Industry Revenue (Million) Forecast, by Application 2019 & 2032
- Table 104: Australia Vitrectomy Devices Industry Volume (K Unit) Forecast, by Application 2019 & 2032
- Table 105: South Korea Vitrectomy Devices Industry Revenue (Million) Forecast, by Application 2019 & 2032
- Table 106: South Korea Vitrectomy Devices Industry Volume (K Unit) Forecast, by Application 2019 & 2032
- Table 107: Rest of Asia Pacific Vitrectomy Devices Industry Revenue (Million) Forecast, by Application 2019 & 2032
- Table 108: Rest of Asia Pacific Vitrectomy Devices Industry Volume (K Unit) Forecast, by Application 2019 & 2032
- Table 109: Global Vitrectomy Devices Industry Revenue Million Forecast, by Product Type 2019 & 2032
- Table 110: Global Vitrectomy Devices Industry Volume K Unit Forecast, by Product Type 2019 & 2032
- Table 111: Global Vitrectomy Devices Industry Revenue Million Forecast, by Application 2019 & 2032
- Table 112: Global Vitrectomy Devices Industry Volume K Unit Forecast, by Application 2019 & 2032
- Table 113: Global Vitrectomy Devices Industry Revenue Million Forecast, by Country 2019 & 2032
- Table 114: Global Vitrectomy Devices Industry Volume K Unit Forecast, by Country 2019 & 2032
- Table 115: GCC Vitrectomy Devices Industry Revenue (Million) Forecast, by Application 2019 & 2032
- Table 116: GCC Vitrectomy Devices Industry Volume (K Unit) Forecast, by Application 2019 & 2032
- Table 117: South Africa Vitrectomy Devices Industry Revenue (Million) Forecast, by Application 2019 & 2032
- Table 118: South Africa Vitrectomy Devices Industry Volume (K Unit) Forecast, by Application 2019 & 2032
- Table 119: Rest of Middle East and Africa Vitrectomy Devices Industry Revenue (Million) Forecast, by Application 2019 & 2032
- Table 120: Rest of Middle East and Africa Vitrectomy Devices Industry Volume (K Unit) Forecast, by Application 2019 & 2032
- Table 121: Global Vitrectomy Devices Industry Revenue Million Forecast, by Product Type 2019 & 2032
- Table 122: Global Vitrectomy Devices Industry Volume K Unit Forecast, by Product Type 2019 & 2032
- Table 123: Global Vitrectomy Devices Industry Revenue Million Forecast, by Application 2019 & 2032
- Table 124: Global Vitrectomy Devices Industry Volume K Unit Forecast, by Application 2019 & 2032
- Table 125: Global Vitrectomy Devices Industry Revenue Million Forecast, by Country 2019 & 2032
- Table 126: Global Vitrectomy Devices Industry Volume K Unit Forecast, by Country 2019 & 2032
- Table 127: Brazil Vitrectomy Devices Industry Revenue (Million) Forecast, by Application 2019 & 2032
- Table 128: Brazil Vitrectomy Devices Industry Volume (K Unit) Forecast, by Application 2019 & 2032
- Table 129: Argentina Vitrectomy Devices Industry Revenue (Million) Forecast, by Application 2019 & 2032
- Table 130: Argentina Vitrectomy Devices Industry Volume (K Unit) Forecast, by Application 2019 & 2032
- Table 131: Rest of South America Vitrectomy Devices Industry Revenue (Million) Forecast, by Application 2019 & 2032
- Table 132: Rest of South America Vitrectomy Devices Industry Volume (K Unit) Forecast, by Application 2019 & 2032
Frequently Asked Questions
1. What is the projected Compound Annual Growth Rate (CAGR) of the Vitrectomy Devices Industry?
The projected CAGR is approximately 7.90%.
2. Which companies are prominent players in the Vitrectomy Devices Industry?
Key companies in the market include Carl Zeiss Meditec AG, IRIDEX Corporation, Leica Microsystems GmbH, Lumenis, Bausch & Lomb Incorporated, Topcon Corporation, NIDEK CO LTD, Alcon Inc, Ellex Medical Lasers.
3. What are the main segments of the Vitrectomy Devices Industry?
The market segments include Product Type, Application.
4. Can you provide details about the market size?
The market size is estimated to be USD XX Million as of 2022.
5. What are some drivers contributing to market growth?
Rising Geriatric Population and Increasing Prevalence of Eye Diseases; Increasing Demand for Minimally Invasive Surgeries.
6. What are the notable trends driving market growth?
Diabetic Retinopathy Segment is Expected to Witness Healthy Growth in the Coming Years.
7. Are there any restraints impacting market growth?
High Cost of Retinal Surgery Devices; Complications Associated with the Retinal Surgeries.
8. Can you provide examples of recent developments in the market?
April 2022- After receiving FDA approval, Parkhurst NuVision launched EVO Visian ICL, a new vision device in the US.
9. What pricing options are available for accessing the report?
Pricing options include single-user, multi-user, and enterprise licenses priced at USD 4750, USD 5250, and USD 8750 respectively.
10. Is the market size provided in terms of value or volume?
The market size is provided in terms of value, measured in Million and volume, measured in K Unit.
11. Are there any specific market keywords associated with the report?
Yes, the market keyword associated with the report is "Vitrectomy Devices Industry," which aids in identifying and referencing the specific market segment covered.
12. How do I determine which pricing option suits my needs best?
The pricing options vary based on user requirements and access needs. Individual users may opt for single-user licenses, while businesses requiring broader access may choose multi-user or enterprise licenses for cost-effective access to the report.
13. Are there any additional resources or data provided in the Vitrectomy Devices Industry report?
While the report offers comprehensive insights, it's advisable to review the specific contents or supplementary materials provided to ascertain if additional resources or data are available.
14. How can I stay updated on further developments or reports in the Vitrectomy Devices Industry?
To stay informed about further developments, trends, and reports in the Vitrectomy Devices Industry, consider subscribing to industry newsletters, following relevant companies and organizations, or regularly checking reputable industry news sources and publications.
Methodology
Step 1 - Identification of Relevant Samples Size from Population Database


Step 2 - Approaches for Defining Global Market Size (Value, Volume* & Price*)

Note*: In applicable scenarios
Step 3 - Data Sources
Primary Research
- Web Analytics
- Survey Reports
- Research Institute
- Latest Research Reports
- Opinion Leaders
Secondary Research
- Annual Reports
- White Paper
- Latest Press Release
- Industry Association
- Paid Database
- Investor Presentations

Step 4 - Data Triangulation
Involves using different sources of information in order to increase the validity of a study
These sources are likely to be stakeholders in a program - participants, other researchers, program staff, other community members, and so on.
Then we put all data in single framework & apply various statistical tools to find out the dynamic on the market.
During the analysis stage, feedback from the stakeholder groups would be compared to determine areas of agreement as well as areas of divergence
