

Key Insights
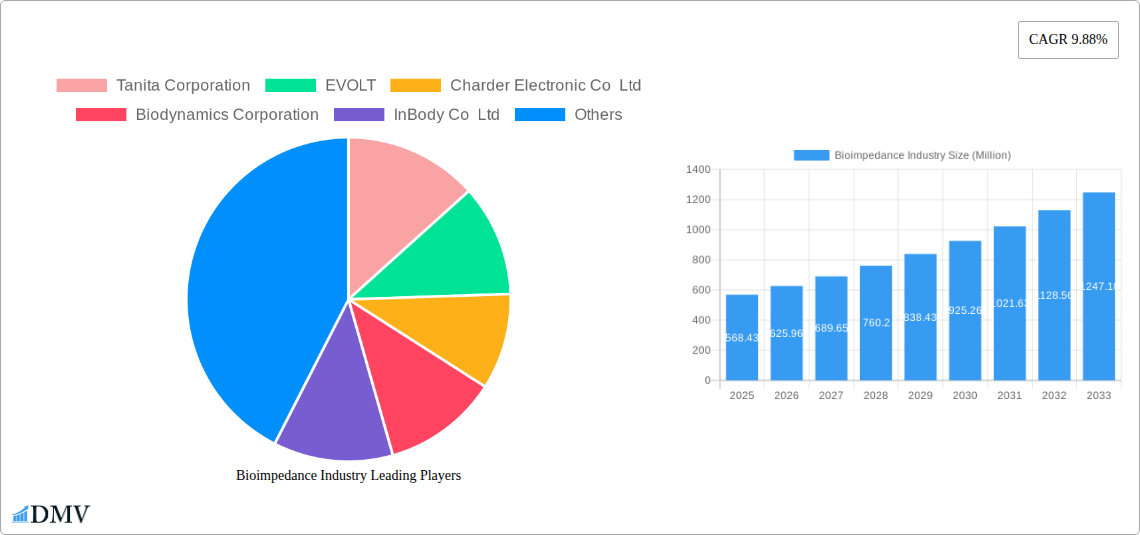
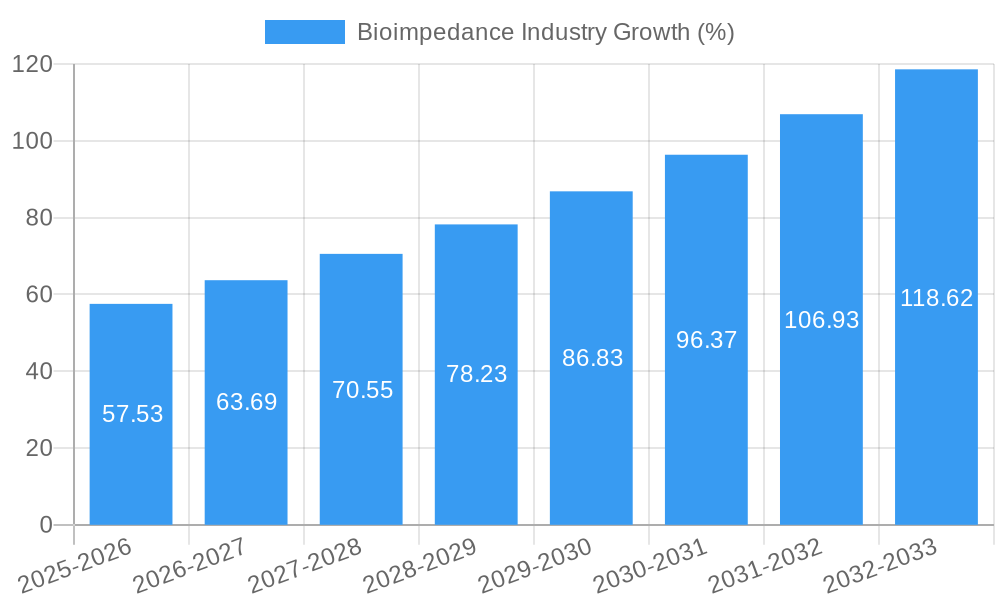
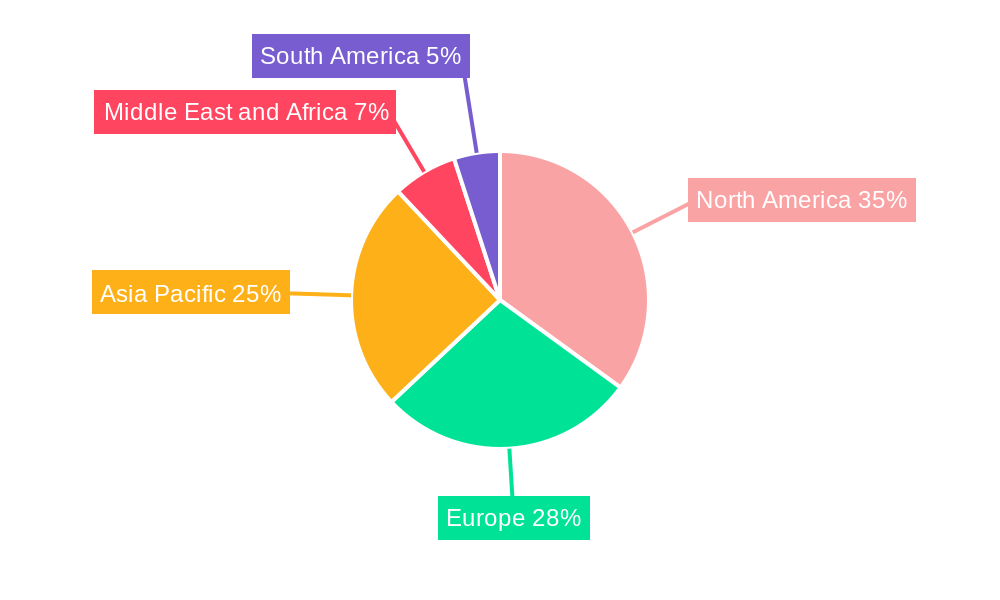
The global bioimpedance market, valued at $568.43 million in 2025, is projected to experience robust growth, driven by increasing prevalence of obesity and related metabolic disorders, rising demand for convenient and non-invasive health monitoring solutions, and technological advancements leading to more accurate and portable devices. The market's Compound Annual Growth Rate (CAGR) of 9.88% from 2019-2024 suggests a strong upward trajectory, expected to continue through 2033. Key growth drivers include the integration of bioimpedance technology into wearable fitness trackers and smart home devices, expanding its accessibility and appeal to a wider consumer base. Furthermore, the increasing adoption of bioimpedance analysis in clinical settings for diagnosing malnutrition and monitoring fluid balance contributes significantly to market expansion. Segmental body measurement applications are currently dominant, but whole-body measurement is gaining traction due to its comprehensive health assessment capabilities. Within product types, multi-frequency devices offer superior accuracy and are witnessing higher adoption rates compared to single-frequency counterparts. Competition is intense, with established players like Tanita Corporation and Omron Corporation alongside emerging companies continuously innovating to improve device performance, user experience, and data analytics capabilities. Geographical analysis shows strong market presence in North America and Europe, driven by high healthcare spending and technological advancements. However, the Asia-Pacific region is poised for significant growth due to its expanding healthcare infrastructure and rising health consciousness among the population.
Market restraints include the relatively high cost of advanced multi-frequency devices and potential inaccuracies associated with certain measurement techniques, particularly in individuals with high body fat percentage or certain medical conditions. However, ongoing research and development efforts are addressing these limitations, focusing on enhancing accuracy and affordability to make bioimpedance analysis more accessible globally. The market is segmented by modality (wireless and wired), application (segmental and whole-body measurement), and product type (single, dual, and multi-frequency). The continued integration of bioimpedance technology into various healthcare and wellness applications, coupled with improvements in device accuracy and affordability, positions the market for sustained and significant growth over the forecast period. The competitive landscape is dynamic, marked by continuous innovation and strategic partnerships to expand market reach and product offerings.
Bioimpedance Industry: A Comprehensive Market Report (2019-2033)
This insightful report provides a detailed analysis of the global bioimpedance industry, encompassing market trends, technological advancements, key players, and future growth prospects. Covering the period from 2019 to 2033, with a focus on 2025, this comprehensive study is essential for stakeholders seeking to understand and capitalize on opportunities within this rapidly evolving sector. The global bioimpedance market is projected to reach xx Million by 2033, demonstrating substantial growth potential.
Bioimpedance Industry Market Composition & Trends
This section delves into the intricate composition of the bioimpedance market, offering a granular understanding of its current state and future trajectory. We analyze market concentration, highlighting the leading players like Tanita Corporation, Omron Corporation, and InBody Co Ltd, and their respective market share distribution. The report also explores innovation catalysts, regulatory landscapes impacting product development and market access, and the presence of substitute products influencing market competition. Furthermore, we examine end-user profiles (consumer, clinical, and research segments) and M&A activities, including deal values (estimated at xx Million in the last five years) and their impact on market consolidation.
- Market Concentration: Highly fragmented, with a few dominant players holding significant shares.
- Innovation Catalysts: Miniaturization, improved accuracy, integration with wearable technology.
- Regulatory Landscape: Varying regulations across regions impact market access and product approvals.
- Substitute Products: Other body composition analysis methods, potentially limiting market growth.
- End-User Profiles: Consumers seeking fitness tracking, healthcare professionals for diagnostics, and researchers for clinical studies.
- M&A Activities: Significant consolidation expected in the coming years, driven by the need for technological advancement and market expansion.
Bioimpedance Industry Evolution
This section traces the evolutionary path of the bioimpedance industry, analyzing market growth trajectories, technological leaps, and evolving consumer demands. From the historical period (2019-2024) to the estimated year (2025), we unveil the industry's growth rate (estimated at xx% CAGR during the historical period and projected at xx% during the forecast period (2025-2033)). Key technological advancements, such as the shift towards wireless modalities and multi-frequency devices, are examined alongside their impact on market adoption. We explore shifting consumer preferences towards personalized health monitoring and the growing integration of bioimpedance technology into wearable devices and smart home ecosystems. The influence of these factors on the market's dynamic transformation is comprehensively analyzed.
Leading Regions, Countries, or Segments in Bioimpedance Industry
This section identifies the dominant regions, countries, and market segments within the bioimpedance industry. We analyze the leading segments by modality (Wireless and Wired), application (Segmental Body Measurement and Whole Body Measurement), and product type (Single-frequency, Dual-frequency, and Multiple-frequency). The report highlights the key drivers behind the dominance of specific segments, including investment trends, regulatory support, and consumer demand patterns.
- Modality: Wireless segment is experiencing rapid growth due to increasing demand for portable and user-friendly devices.
- Application: Whole body measurement dominates due to its comprehensive assessment capabilities, while segmental measurement is gaining traction in specialized applications.
- Product Type: Multiple-frequency devices offer higher accuracy and are expected to witness strong growth, though dual-frequency remains widely adopted.
- Key Drivers: Technological advancements, increasing health consciousness, and government initiatives promoting health and wellness are significantly impacting the market's growth trajectory across different segments. North America and Europe currently hold substantial market shares due to high adoption rates and robust healthcare infrastructure.
Bioimpedance Industry Product Innovations
Recent innovations in bioimpedance technology have enhanced accuracy, reduced measurement time, and broadened applications. The launch of multi-frequency devices allows for more precise body composition analysis, catering to both consumer and clinical needs. The integration of bioimpedance sensors into wearable technology simplifies data collection and increases accessibility for users. Key performance metrics, such as measurement accuracy, ease of use, and data connectivity, are constantly improving. These advancements, coupled with user-friendly interfaces and enhanced data analytics capabilities, are driving market growth and adoption.
Propelling Factors for Bioimpedance Industry Growth
Several key factors contribute to the bioimpedance industry's growth. Technological advancements resulting in smaller, more accurate, and user-friendly devices are significantly driving market expansion. The increasing prevalence of chronic diseases globally fuels demand for accurate body composition monitoring for health management. Supportive regulatory frameworks and government initiatives promoting health and wellness further accelerate market growth. Finally, rising health consciousness among consumers is encouraging wider adoption of bioimpedance technology for personal health tracking and fitness management.
Obstacles in the Bioimpedance Industry Market
Despite significant potential, the bioimpedance market faces challenges. Regulatory hurdles in obtaining approvals for medical devices can delay product launches and limit market penetration in certain regions. Supply chain disruptions can impact production and availability of components, affecting overall market supply. Intense competition among existing and emerging players puts pressure on pricing and profitability. The cost associated with advanced technologies and the need for skilled professionals for device operation and data interpretation pose additional obstacles.
Future Opportunities in Bioimpedance Industry
The bioimpedance industry presents exciting opportunities for future growth. Expanding into emerging markets with growing health awareness offers substantial untapped potential. Integration with other health monitoring technologies, such as wearables and telehealth platforms, creates opportunities for broader data integration and personalized healthcare solutions. Advancements in data analytics and artificial intelligence can lead to more insightful and actionable health information, further strengthening the adoption of bioimpedance technology.
Major Players in the Bioimpedance Industry Ecosystem
- Tanita Corporation
- EVOLT
- Charder Electronic Co Ltd
- Biodynamics Corporation
- InBody Co Ltd
- Fook Tin Group Holding Ltd
- Omron Corporation
- Bioparhom
- Lumsail Industrial Inc
- Biotekna
- Akern
- Bodystat Ltd
Key Developments in Bioimpedance Industry Industry
- September 2022: Xiaomi launched an eight-electrode body composition scale utilizing dual-frequency bioimpedance technology, providing up to 35 body composition analysis reports. This launch significantly increased consumer accessibility to accurate body composition data.
- March 2022: Analog Devices introduced the MAX30009, a low-power, high-performance analog front end for wearable bioimpedance monitoring, enabling clinical-grade vital sign measurement in wearable devices, thus expanding the application of bioimpedance technology in health monitoring.
Strategic Bioimpedance Industry Market Forecast
The bioimpedance market is poised for robust growth driven by continuous technological advancements, rising health consciousness, and increasing demand for personalized healthcare solutions. The market's expansion will be fuelled by the integration of bioimpedance technology into wearable devices and the development of more accurate and user-friendly devices. Emerging markets present significant growth potential, alongside opportunities in specialized applications within healthcare settings. The forecast period (2025-2033) promises substantial growth, contributing to the overall expansion of the global bioimpedance market.
Bioimpedance Industry Segmentation
-
1. Product Type
- 1.1. Single-frequency
- 1.2. Dual-frequency
- 1.3. Multiple-frequency
-
2. Modality
- 2.1. Wireless
- 2.2. Wired
-
3. Application
- 3.1. Segmental Body Measurement
- 3.2. Whole Body Measurement
Bioimpedance Industry Segmentation By Geography
-
1. North America
- 1.1. United States
- 1.2. Canada
- 1.3. Mexico
-
2. Europe
- 2.1. Germany
- 2.2. United Kingdom
- 2.3. France
- 2.4. Italy
- 2.5. Spain
- 2.6. Rest of Europe
-
3. Asia Pacific
- 3.1. China
- 3.2. Japan
- 3.3. India
- 3.4. Australia
- 3.5. South Korea
- 3.6. Rest of Asia Pacific
-
4. Middle East and Africa
- 4.1. GCC
- 4.2. South Africa
- 4.3. Rest of Middle East and Africa
-
5. South America
- 5.1. Brazil
- 5.2. Argentina
- 5.3. Rest of South America
Bioimpedance Industry REPORT HIGHLIGHTS
| Aspects | Details |
|---|---|
| Study Period | 2019-2033 |
| Base Year | 2024 |
| Estimated Year | 2025 |
| Forecast Period | 2025-2033 |
| Historical Period | 2019-2024 |
| Growth Rate | CAGR of 9.88% from 2019-2033 |
| Segmentation |
|
Table of Contents
- 1. Introduction
- 1.1. Research Scope
- 1.2. Market Segmentation
- 1.3. Research Methodology
- 1.4. Definitions and Assumptions
- 2. Executive Summary
- 2.1. Introduction
- 3. Market Dynamics
- 3.1. Introduction
- 3.2. Market Drivers
- 3.2.1. Increasing Prevalence of Metabolic Disorders; Initiatives by Governments to Promote Healthy Lifestyles; Technological Advancements
- 3.3. Market Restrains
- 3.3.1. Inconsistency and Inaccuracy in Different Analyzers
- 3.4. Market Trends
- 3.4.1. Multi-frequency Bioimpedance Analysis Segment Expected to Witness the Highest Growth During the Forecast Period
- 4. Market Factor Analysis
- 4.1. Porters Five Forces
- 4.2. Supply/Value Chain
- 4.3. PESTEL analysis
- 4.4. Market Entropy
- 4.5. Patent/Trademark Analysis
- 5. Global Bioimpedance Industry Analysis, Insights and Forecast, 2019-2031
- 5.1. Market Analysis, Insights and Forecast - by Product Type
- 5.1.1. Single-frequency
- 5.1.2. Dual-frequency
- 5.1.3. Multiple-frequency
- 5.2. Market Analysis, Insights and Forecast - by Modality
- 5.2.1. Wireless
- 5.2.2. Wired
- 5.3. Market Analysis, Insights and Forecast - by Application
- 5.3.1. Segmental Body Measurement
- 5.3.2. Whole Body Measurement
- 5.4. Market Analysis, Insights and Forecast - by Region
- 5.4.1. North America
- 5.4.2. Europe
- 5.4.3. Asia Pacific
- 5.4.4. Middle East and Africa
- 5.4.5. South America
- 5.1. Market Analysis, Insights and Forecast - by Product Type
- 6. North America Bioimpedance Industry Analysis, Insights and Forecast, 2019-2031
- 6.1. Market Analysis, Insights and Forecast - by Product Type
- 6.1.1. Single-frequency
- 6.1.2. Dual-frequency
- 6.1.3. Multiple-frequency
- 6.2. Market Analysis, Insights and Forecast - by Modality
- 6.2.1. Wireless
- 6.2.2. Wired
- 6.3. Market Analysis, Insights and Forecast - by Application
- 6.3.1. Segmental Body Measurement
- 6.3.2. Whole Body Measurement
- 6.1. Market Analysis, Insights and Forecast - by Product Type
- 7. Europe Bioimpedance Industry Analysis, Insights and Forecast, 2019-2031
- 7.1. Market Analysis, Insights and Forecast - by Product Type
- 7.1.1. Single-frequency
- 7.1.2. Dual-frequency
- 7.1.3. Multiple-frequency
- 7.2. Market Analysis, Insights and Forecast - by Modality
- 7.2.1. Wireless
- 7.2.2. Wired
- 7.3. Market Analysis, Insights and Forecast - by Application
- 7.3.1. Segmental Body Measurement
- 7.3.2. Whole Body Measurement
- 7.1. Market Analysis, Insights and Forecast - by Product Type
- 8. Asia Pacific Bioimpedance Industry Analysis, Insights and Forecast, 2019-2031
- 8.1. Market Analysis, Insights and Forecast - by Product Type
- 8.1.1. Single-frequency
- 8.1.2. Dual-frequency
- 8.1.3. Multiple-frequency
- 8.2. Market Analysis, Insights and Forecast - by Modality
- 8.2.1. Wireless
- 8.2.2. Wired
- 8.3. Market Analysis, Insights and Forecast - by Application
- 8.3.1. Segmental Body Measurement
- 8.3.2. Whole Body Measurement
- 8.1. Market Analysis, Insights and Forecast - by Product Type
- 9. Middle East and Africa Bioimpedance Industry Analysis, Insights and Forecast, 2019-2031
- 9.1. Market Analysis, Insights and Forecast - by Product Type
- 9.1.1. Single-frequency
- 9.1.2. Dual-frequency
- 9.1.3. Multiple-frequency
- 9.2. Market Analysis, Insights and Forecast - by Modality
- 9.2.1. Wireless
- 9.2.2. Wired
- 9.3. Market Analysis, Insights and Forecast - by Application
- 9.3.1. Segmental Body Measurement
- 9.3.2. Whole Body Measurement
- 9.1. Market Analysis, Insights and Forecast - by Product Type
- 10. South America Bioimpedance Industry Analysis, Insights and Forecast, 2019-2031
- 10.1. Market Analysis, Insights and Forecast - by Product Type
- 10.1.1. Single-frequency
- 10.1.2. Dual-frequency
- 10.1.3. Multiple-frequency
- 10.2. Market Analysis, Insights and Forecast - by Modality
- 10.2.1. Wireless
- 10.2.2. Wired
- 10.3. Market Analysis, Insights and Forecast - by Application
- 10.3.1. Segmental Body Measurement
- 10.3.2. Whole Body Measurement
- 10.1. Market Analysis, Insights and Forecast - by Product Type
- 11. North America Bioimpedance Industry Analysis, Insights and Forecast, 2019-2031
- 11.1. Market Analysis, Insights and Forecast - By Country/Sub-region
- 11.1.1. undefined
- 12. Europe Bioimpedance Industry Analysis, Insights and Forecast, 2019-2031
- 12.1. Market Analysis, Insights and Forecast - By Country/Sub-region
- 12.1.1. undefined
- 13. Asia Pacific Bioimpedance Industry Analysis, Insights and Forecast, 2019-2031
- 13.1. Market Analysis, Insights and Forecast - By Country/Sub-region
- 13.1.1. undefined
- 14. Middle East and Africa Bioimpedance Industry Analysis, Insights and Forecast, 2019-2031
- 14.1. Market Analysis, Insights and Forecast - By Country/Sub-region
- 14.1.1. undefined
- 15. South America Bioimpedance Industry Analysis, Insights and Forecast, 2019-2031
- 15.1. Market Analysis, Insights and Forecast - By Country/Sub-region
- 15.1.1. undefined
- 16. Competitive Analysis
- 16.1. Global Market Share Analysis 2024
- 16.2. Company Profiles
- 16.2.1 Tanita Corporation
- 16.2.1.1. Overview
- 16.2.1.2. Products
- 16.2.1.3. SWOT Analysis
- 16.2.1.4. Recent Developments
- 16.2.1.5. Financials (Based on Availability)
- 16.2.2 EVOLT
- 16.2.2.1. Overview
- 16.2.2.2. Products
- 16.2.2.3. SWOT Analysis
- 16.2.2.4. Recent Developments
- 16.2.2.5. Financials (Based on Availability)
- 16.2.3 Charder Electronic Co Ltd
- 16.2.3.1. Overview
- 16.2.3.2. Products
- 16.2.3.3. SWOT Analysis
- 16.2.3.4. Recent Developments
- 16.2.3.5. Financials (Based on Availability)
- 16.2.4 Biodynamics Corporation
- 16.2.4.1. Overview
- 16.2.4.2. Products
- 16.2.4.3. SWOT Analysis
- 16.2.4.4. Recent Developments
- 16.2.4.5. Financials (Based on Availability)
- 16.2.5 InBody Co Ltd
- 16.2.5.1. Overview
- 16.2.5.2. Products
- 16.2.5.3. SWOT Analysis
- 16.2.5.4. Recent Developments
- 16.2.5.5. Financials (Based on Availability)
- 16.2.6 Fook Tin Group Holding Ltd
- 16.2.6.1. Overview
- 16.2.6.2. Products
- 16.2.6.3. SWOT Analysis
- 16.2.6.4. Recent Developments
- 16.2.6.5. Financials (Based on Availability)
- 16.2.7 Omron Corporation
- 16.2.7.1. Overview
- 16.2.7.2. Products
- 16.2.7.3. SWOT Analysis
- 16.2.7.4. Recent Developments
- 16.2.7.5. Financials (Based on Availability)
- 16.2.8 Bioparhom
- 16.2.8.1. Overview
- 16.2.8.2. Products
- 16.2.8.3. SWOT Analysis
- 16.2.8.4. Recent Developments
- 16.2.8.5. Financials (Based on Availability)
- 16.2.9 Lumsail Industrial Inc
- 16.2.9.1. Overview
- 16.2.9.2. Products
- 16.2.9.3. SWOT Analysis
- 16.2.9.4. Recent Developments
- 16.2.9.5. Financials (Based on Availability)
- 16.2.10 Biotekna
- 16.2.10.1. Overview
- 16.2.10.2. Products
- 16.2.10.3. SWOT Analysis
- 16.2.10.4. Recent Developments
- 16.2.10.5. Financials (Based on Availability)
- 16.2.11 Akern
- 16.2.11.1. Overview
- 16.2.11.2. Products
- 16.2.11.3. SWOT Analysis
- 16.2.11.4. Recent Developments
- 16.2.11.5. Financials (Based on Availability)
- 16.2.12 Bodystat Ltd
- 16.2.12.1. Overview
- 16.2.12.2. Products
- 16.2.12.3. SWOT Analysis
- 16.2.12.4. Recent Developments
- 16.2.12.5. Financials (Based on Availability)
- 16.2.1 Tanita Corporation
List of Figures
- Figure 1: Global Bioimpedance Industry Revenue Breakdown (Million, %) by Region 2024 & 2032
- Figure 2: Global Bioimpedance Industry Volume Breakdown (K Unit, %) by Region 2024 & 2032
- Figure 3: North America Bioimpedance Industry Revenue (Million), by Country 2024 & 2032
- Figure 4: North America Bioimpedance Industry Volume (K Unit), by Country 2024 & 2032
- Figure 5: North America Bioimpedance Industry Revenue Share (%), by Country 2024 & 2032
- Figure 6: North America Bioimpedance Industry Volume Share (%), by Country 2024 & 2032
- Figure 7: Europe Bioimpedance Industry Revenue (Million), by Country 2024 & 2032
- Figure 8: Europe Bioimpedance Industry Volume (K Unit), by Country 2024 & 2032
- Figure 9: Europe Bioimpedance Industry Revenue Share (%), by Country 2024 & 2032
- Figure 10: Europe Bioimpedance Industry Volume Share (%), by Country 2024 & 2032
- Figure 11: Asia Pacific Bioimpedance Industry Revenue (Million), by Country 2024 & 2032
- Figure 12: Asia Pacific Bioimpedance Industry Volume (K Unit), by Country 2024 & 2032
- Figure 13: Asia Pacific Bioimpedance Industry Revenue Share (%), by Country 2024 & 2032
- Figure 14: Asia Pacific Bioimpedance Industry Volume Share (%), by Country 2024 & 2032
- Figure 15: Middle East and Africa Bioimpedance Industry Revenue (Million), by Country 2024 & 2032
- Figure 16: Middle East and Africa Bioimpedance Industry Volume (K Unit), by Country 2024 & 2032
- Figure 17: Middle East and Africa Bioimpedance Industry Revenue Share (%), by Country 2024 & 2032
- Figure 18: Middle East and Africa Bioimpedance Industry Volume Share (%), by Country 2024 & 2032
- Figure 19: South America Bioimpedance Industry Revenue (Million), by Country 2024 & 2032
- Figure 20: South America Bioimpedance Industry Volume (K Unit), by Country 2024 & 2032
- Figure 21: South America Bioimpedance Industry Revenue Share (%), by Country 2024 & 2032
- Figure 22: South America Bioimpedance Industry Volume Share (%), by Country 2024 & 2032
- Figure 23: North America Bioimpedance Industry Revenue (Million), by Product Type 2024 & 2032
- Figure 24: North America Bioimpedance Industry Volume (K Unit), by Product Type 2024 & 2032
- Figure 25: North America Bioimpedance Industry Revenue Share (%), by Product Type 2024 & 2032
- Figure 26: North America Bioimpedance Industry Volume Share (%), by Product Type 2024 & 2032
- Figure 27: North America Bioimpedance Industry Revenue (Million), by Modality 2024 & 2032
- Figure 28: North America Bioimpedance Industry Volume (K Unit), by Modality 2024 & 2032
- Figure 29: North America Bioimpedance Industry Revenue Share (%), by Modality 2024 & 2032
- Figure 30: North America Bioimpedance Industry Volume Share (%), by Modality 2024 & 2032
- Figure 31: North America Bioimpedance Industry Revenue (Million), by Application 2024 & 2032
- Figure 32: North America Bioimpedance Industry Volume (K Unit), by Application 2024 & 2032
- Figure 33: North America Bioimpedance Industry Revenue Share (%), by Application 2024 & 2032
- Figure 34: North America Bioimpedance Industry Volume Share (%), by Application 2024 & 2032
- Figure 35: North America Bioimpedance Industry Revenue (Million), by Country 2024 & 2032
- Figure 36: North America Bioimpedance Industry Volume (K Unit), by Country 2024 & 2032
- Figure 37: North America Bioimpedance Industry Revenue Share (%), by Country 2024 & 2032
- Figure 38: North America Bioimpedance Industry Volume Share (%), by Country 2024 & 2032
- Figure 39: Europe Bioimpedance Industry Revenue (Million), by Product Type 2024 & 2032
- Figure 40: Europe Bioimpedance Industry Volume (K Unit), by Product Type 2024 & 2032
- Figure 41: Europe Bioimpedance Industry Revenue Share (%), by Product Type 2024 & 2032
- Figure 42: Europe Bioimpedance Industry Volume Share (%), by Product Type 2024 & 2032
- Figure 43: Europe Bioimpedance Industry Revenue (Million), by Modality 2024 & 2032
- Figure 44: Europe Bioimpedance Industry Volume (K Unit), by Modality 2024 & 2032
- Figure 45: Europe Bioimpedance Industry Revenue Share (%), by Modality 2024 & 2032
- Figure 46: Europe Bioimpedance Industry Volume Share (%), by Modality 2024 & 2032
- Figure 47: Europe Bioimpedance Industry Revenue (Million), by Application 2024 & 2032
- Figure 48: Europe Bioimpedance Industry Volume (K Unit), by Application 2024 & 2032
- Figure 49: Europe Bioimpedance Industry Revenue Share (%), by Application 2024 & 2032
- Figure 50: Europe Bioimpedance Industry Volume Share (%), by Application 2024 & 2032
- Figure 51: Europe Bioimpedance Industry Revenue (Million), by Country 2024 & 2032
- Figure 52: Europe Bioimpedance Industry Volume (K Unit), by Country 2024 & 2032
- Figure 53: Europe Bioimpedance Industry Revenue Share (%), by Country 2024 & 2032
- Figure 54: Europe Bioimpedance Industry Volume Share (%), by Country 2024 & 2032
- Figure 55: Asia Pacific Bioimpedance Industry Revenue (Million), by Product Type 2024 & 2032
- Figure 56: Asia Pacific Bioimpedance Industry Volume (K Unit), by Product Type 2024 & 2032
- Figure 57: Asia Pacific Bioimpedance Industry Revenue Share (%), by Product Type 2024 & 2032
- Figure 58: Asia Pacific Bioimpedance Industry Volume Share (%), by Product Type 2024 & 2032
- Figure 59: Asia Pacific Bioimpedance Industry Revenue (Million), by Modality 2024 & 2032
- Figure 60: Asia Pacific Bioimpedance Industry Volume (K Unit), by Modality 2024 & 2032
- Figure 61: Asia Pacific Bioimpedance Industry Revenue Share (%), by Modality 2024 & 2032
- Figure 62: Asia Pacific Bioimpedance Industry Volume Share (%), by Modality 2024 & 2032
- Figure 63: Asia Pacific Bioimpedance Industry Revenue (Million), by Application 2024 & 2032
- Figure 64: Asia Pacific Bioimpedance Industry Volume (K Unit), by Application 2024 & 2032
- Figure 65: Asia Pacific Bioimpedance Industry Revenue Share (%), by Application 2024 & 2032
- Figure 66: Asia Pacific Bioimpedance Industry Volume Share (%), by Application 2024 & 2032
- Figure 67: Asia Pacific Bioimpedance Industry Revenue (Million), by Country 2024 & 2032
- Figure 68: Asia Pacific Bioimpedance Industry Volume (K Unit), by Country 2024 & 2032
- Figure 69: Asia Pacific Bioimpedance Industry Revenue Share (%), by Country 2024 & 2032
- Figure 70: Asia Pacific Bioimpedance Industry Volume Share (%), by Country 2024 & 2032
- Figure 71: Middle East and Africa Bioimpedance Industry Revenue (Million), by Product Type 2024 & 2032
- Figure 72: Middle East and Africa Bioimpedance Industry Volume (K Unit), by Product Type 2024 & 2032
- Figure 73: Middle East and Africa Bioimpedance Industry Revenue Share (%), by Product Type 2024 & 2032
- Figure 74: Middle East and Africa Bioimpedance Industry Volume Share (%), by Product Type 2024 & 2032
- Figure 75: Middle East and Africa Bioimpedance Industry Revenue (Million), by Modality 2024 & 2032
- Figure 76: Middle East and Africa Bioimpedance Industry Volume (K Unit), by Modality 2024 & 2032
- Figure 77: Middle East and Africa Bioimpedance Industry Revenue Share (%), by Modality 2024 & 2032
- Figure 78: Middle East and Africa Bioimpedance Industry Volume Share (%), by Modality 2024 & 2032
- Figure 79: Middle East and Africa Bioimpedance Industry Revenue (Million), by Application 2024 & 2032
- Figure 80: Middle East and Africa Bioimpedance Industry Volume (K Unit), by Application 2024 & 2032
- Figure 81: Middle East and Africa Bioimpedance Industry Revenue Share (%), by Application 2024 & 2032
- Figure 82: Middle East and Africa Bioimpedance Industry Volume Share (%), by Application 2024 & 2032
- Figure 83: Middle East and Africa Bioimpedance Industry Revenue (Million), by Country 2024 & 2032
- Figure 84: Middle East and Africa Bioimpedance Industry Volume (K Unit), by Country 2024 & 2032
- Figure 85: Middle East and Africa Bioimpedance Industry Revenue Share (%), by Country 2024 & 2032
- Figure 86: Middle East and Africa Bioimpedance Industry Volume Share (%), by Country 2024 & 2032
- Figure 87: South America Bioimpedance Industry Revenue (Million), by Product Type 2024 & 2032
- Figure 88: South America Bioimpedance Industry Volume (K Unit), by Product Type 2024 & 2032
- Figure 89: South America Bioimpedance Industry Revenue Share (%), by Product Type 2024 & 2032
- Figure 90: South America Bioimpedance Industry Volume Share (%), by Product Type 2024 & 2032
- Figure 91: South America Bioimpedance Industry Revenue (Million), by Modality 2024 & 2032
- Figure 92: South America Bioimpedance Industry Volume (K Unit), by Modality 2024 & 2032
- Figure 93: South America Bioimpedance Industry Revenue Share (%), by Modality 2024 & 2032
- Figure 94: South America Bioimpedance Industry Volume Share (%), by Modality 2024 & 2032
- Figure 95: South America Bioimpedance Industry Revenue (Million), by Application 2024 & 2032
- Figure 96: South America Bioimpedance Industry Volume (K Unit), by Application 2024 & 2032
- Figure 97: South America Bioimpedance Industry Revenue Share (%), by Application 2024 & 2032
- Figure 98: South America Bioimpedance Industry Volume Share (%), by Application 2024 & 2032
- Figure 99: South America Bioimpedance Industry Revenue (Million), by Country 2024 & 2032
- Figure 100: South America Bioimpedance Industry Volume (K Unit), by Country 2024 & 2032
- Figure 101: South America Bioimpedance Industry Revenue Share (%), by Country 2024 & 2032
- Figure 102: South America Bioimpedance Industry Volume Share (%), by Country 2024 & 2032
List of Tables
- Table 1: Global Bioimpedance Industry Revenue Million Forecast, by Region 2019 & 2032
- Table 2: Global Bioimpedance Industry Volume K Unit Forecast, by Region 2019 & 2032
- Table 3: Global Bioimpedance Industry Revenue Million Forecast, by Product Type 2019 & 2032
- Table 4: Global Bioimpedance Industry Volume K Unit Forecast, by Product Type 2019 & 2032
- Table 5: Global Bioimpedance Industry Revenue Million Forecast, by Modality 2019 & 2032
- Table 6: Global Bioimpedance Industry Volume K Unit Forecast, by Modality 2019 & 2032
- Table 7: Global Bioimpedance Industry Revenue Million Forecast, by Application 2019 & 2032
- Table 8: Global Bioimpedance Industry Volume K Unit Forecast, by Application 2019 & 2032
- Table 9: Global Bioimpedance Industry Revenue Million Forecast, by Region 2019 & 2032
- Table 10: Global Bioimpedance Industry Volume K Unit Forecast, by Region 2019 & 2032
- Table 11: Global Bioimpedance Industry Revenue Million Forecast, by Country 2019 & 2032
- Table 12: Global Bioimpedance Industry Volume K Unit Forecast, by Country 2019 & 2032
- Table 13: Global Bioimpedance Industry Revenue Million Forecast, by Country 2019 & 2032
- Table 14: Global Bioimpedance Industry Volume K Unit Forecast, by Country 2019 & 2032
- Table 15: Global Bioimpedance Industry Revenue Million Forecast, by Country 2019 & 2032
- Table 16: Global Bioimpedance Industry Volume K Unit Forecast, by Country 2019 & 2032
- Table 17: Global Bioimpedance Industry Revenue Million Forecast, by Country 2019 & 2032
- Table 18: Global Bioimpedance Industry Volume K Unit Forecast, by Country 2019 & 2032
- Table 19: Global Bioimpedance Industry Revenue Million Forecast, by Country 2019 & 2032
- Table 20: Global Bioimpedance Industry Volume K Unit Forecast, by Country 2019 & 2032
- Table 21: Global Bioimpedance Industry Revenue Million Forecast, by Product Type 2019 & 2032
- Table 22: Global Bioimpedance Industry Volume K Unit Forecast, by Product Type 2019 & 2032
- Table 23: Global Bioimpedance Industry Revenue Million Forecast, by Modality 2019 & 2032
- Table 24: Global Bioimpedance Industry Volume K Unit Forecast, by Modality 2019 & 2032
- Table 25: Global Bioimpedance Industry Revenue Million Forecast, by Application 2019 & 2032
- Table 26: Global Bioimpedance Industry Volume K Unit Forecast, by Application 2019 & 2032
- Table 27: Global Bioimpedance Industry Revenue Million Forecast, by Country 2019 & 2032
- Table 28: Global Bioimpedance Industry Volume K Unit Forecast, by Country 2019 & 2032
- Table 29: United States Bioimpedance Industry Revenue (Million) Forecast, by Application 2019 & 2032
- Table 30: United States Bioimpedance Industry Volume (K Unit) Forecast, by Application 2019 & 2032
- Table 31: Canada Bioimpedance Industry Revenue (Million) Forecast, by Application 2019 & 2032
- Table 32: Canada Bioimpedance Industry Volume (K Unit) Forecast, by Application 2019 & 2032
- Table 33: Mexico Bioimpedance Industry Revenue (Million) Forecast, by Application 2019 & 2032
- Table 34: Mexico Bioimpedance Industry Volume (K Unit) Forecast, by Application 2019 & 2032
- Table 35: Global Bioimpedance Industry Revenue Million Forecast, by Product Type 2019 & 2032
- Table 36: Global Bioimpedance Industry Volume K Unit Forecast, by Product Type 2019 & 2032
- Table 37: Global Bioimpedance Industry Revenue Million Forecast, by Modality 2019 & 2032
- Table 38: Global Bioimpedance Industry Volume K Unit Forecast, by Modality 2019 & 2032
- Table 39: Global Bioimpedance Industry Revenue Million Forecast, by Application 2019 & 2032
- Table 40: Global Bioimpedance Industry Volume K Unit Forecast, by Application 2019 & 2032
- Table 41: Global Bioimpedance Industry Revenue Million Forecast, by Country 2019 & 2032
- Table 42: Global Bioimpedance Industry Volume K Unit Forecast, by Country 2019 & 2032
- Table 43: Germany Bioimpedance Industry Revenue (Million) Forecast, by Application 2019 & 2032
- Table 44: Germany Bioimpedance Industry Volume (K Unit) Forecast, by Application 2019 & 2032
- Table 45: United Kingdom Bioimpedance Industry Revenue (Million) Forecast, by Application 2019 & 2032
- Table 46: United Kingdom Bioimpedance Industry Volume (K Unit) Forecast, by Application 2019 & 2032
- Table 47: France Bioimpedance Industry Revenue (Million) Forecast, by Application 2019 & 2032
- Table 48: France Bioimpedance Industry Volume (K Unit) Forecast, by Application 2019 & 2032
- Table 49: Italy Bioimpedance Industry Revenue (Million) Forecast, by Application 2019 & 2032
- Table 50: Italy Bioimpedance Industry Volume (K Unit) Forecast, by Application 2019 & 2032
- Table 51: Spain Bioimpedance Industry Revenue (Million) Forecast, by Application 2019 & 2032
- Table 52: Spain Bioimpedance Industry Volume (K Unit) Forecast, by Application 2019 & 2032
- Table 53: Rest of Europe Bioimpedance Industry Revenue (Million) Forecast, by Application 2019 & 2032
- Table 54: Rest of Europe Bioimpedance Industry Volume (K Unit) Forecast, by Application 2019 & 2032
- Table 55: Global Bioimpedance Industry Revenue Million Forecast, by Product Type 2019 & 2032
- Table 56: Global Bioimpedance Industry Volume K Unit Forecast, by Product Type 2019 & 2032
- Table 57: Global Bioimpedance Industry Revenue Million Forecast, by Modality 2019 & 2032
- Table 58: Global Bioimpedance Industry Volume K Unit Forecast, by Modality 2019 & 2032
- Table 59: Global Bioimpedance Industry Revenue Million Forecast, by Application 2019 & 2032
- Table 60: Global Bioimpedance Industry Volume K Unit Forecast, by Application 2019 & 2032
- Table 61: Global Bioimpedance Industry Revenue Million Forecast, by Country 2019 & 2032
- Table 62: Global Bioimpedance Industry Volume K Unit Forecast, by Country 2019 & 2032
- Table 63: China Bioimpedance Industry Revenue (Million) Forecast, by Application 2019 & 2032
- Table 64: China Bioimpedance Industry Volume (K Unit) Forecast, by Application 2019 & 2032
- Table 65: Japan Bioimpedance Industry Revenue (Million) Forecast, by Application 2019 & 2032
- Table 66: Japan Bioimpedance Industry Volume (K Unit) Forecast, by Application 2019 & 2032
- Table 67: India Bioimpedance Industry Revenue (Million) Forecast, by Application 2019 & 2032
- Table 68: India Bioimpedance Industry Volume (K Unit) Forecast, by Application 2019 & 2032
- Table 69: Australia Bioimpedance Industry Revenue (Million) Forecast, by Application 2019 & 2032
- Table 70: Australia Bioimpedance Industry Volume (K Unit) Forecast, by Application 2019 & 2032
- Table 71: South Korea Bioimpedance Industry Revenue (Million) Forecast, by Application 2019 & 2032
- Table 72: South Korea Bioimpedance Industry Volume (K Unit) Forecast, by Application 2019 & 2032
- Table 73: Rest of Asia Pacific Bioimpedance Industry Revenue (Million) Forecast, by Application 2019 & 2032
- Table 74: Rest of Asia Pacific Bioimpedance Industry Volume (K Unit) Forecast, by Application 2019 & 2032
- Table 75: Global Bioimpedance Industry Revenue Million Forecast, by Product Type 2019 & 2032
- Table 76: Global Bioimpedance Industry Volume K Unit Forecast, by Product Type 2019 & 2032
- Table 77: Global Bioimpedance Industry Revenue Million Forecast, by Modality 2019 & 2032
- Table 78: Global Bioimpedance Industry Volume K Unit Forecast, by Modality 2019 & 2032
- Table 79: Global Bioimpedance Industry Revenue Million Forecast, by Application 2019 & 2032
- Table 80: Global Bioimpedance Industry Volume K Unit Forecast, by Application 2019 & 2032
- Table 81: Global Bioimpedance Industry Revenue Million Forecast, by Country 2019 & 2032
- Table 82: Global Bioimpedance Industry Volume K Unit Forecast, by Country 2019 & 2032
- Table 83: GCC Bioimpedance Industry Revenue (Million) Forecast, by Application 2019 & 2032
- Table 84: GCC Bioimpedance Industry Volume (K Unit) Forecast, by Application 2019 & 2032
- Table 85: South Africa Bioimpedance Industry Revenue (Million) Forecast, by Application 2019 & 2032
- Table 86: South Africa Bioimpedance Industry Volume (K Unit) Forecast, by Application 2019 & 2032
- Table 87: Rest of Middle East and Africa Bioimpedance Industry Revenue (Million) Forecast, by Application 2019 & 2032
- Table 88: Rest of Middle East and Africa Bioimpedance Industry Volume (K Unit) Forecast, by Application 2019 & 2032
- Table 89: Global Bioimpedance Industry Revenue Million Forecast, by Product Type 2019 & 2032
- Table 90: Global Bioimpedance Industry Volume K Unit Forecast, by Product Type 2019 & 2032
- Table 91: Global Bioimpedance Industry Revenue Million Forecast, by Modality 2019 & 2032
- Table 92: Global Bioimpedance Industry Volume K Unit Forecast, by Modality 2019 & 2032
- Table 93: Global Bioimpedance Industry Revenue Million Forecast, by Application 2019 & 2032
- Table 94: Global Bioimpedance Industry Volume K Unit Forecast, by Application 2019 & 2032
- Table 95: Global Bioimpedance Industry Revenue Million Forecast, by Country 2019 & 2032
- Table 96: Global Bioimpedance Industry Volume K Unit Forecast, by Country 2019 & 2032
- Table 97: Brazil Bioimpedance Industry Revenue (Million) Forecast, by Application 2019 & 2032
- Table 98: Brazil Bioimpedance Industry Volume (K Unit) Forecast, by Application 2019 & 2032
- Table 99: Argentina Bioimpedance Industry Revenue (Million) Forecast, by Application 2019 & 2032
- Table 100: Argentina Bioimpedance Industry Volume (K Unit) Forecast, by Application 2019 & 2032
- Table 101: Rest of South America Bioimpedance Industry Revenue (Million) Forecast, by Application 2019 & 2032
- Table 102: Rest of South America Bioimpedance Industry Volume (K Unit) Forecast, by Application 2019 & 2032
Frequently Asked Questions
1. What is the projected Compound Annual Growth Rate (CAGR) of the Bioimpedance Industry?
The projected CAGR is approximately 9.88%.
2. Which companies are prominent players in the Bioimpedance Industry?
Key companies in the market include Tanita Corporation, EVOLT, Charder Electronic Co Ltd, Biodynamics Corporation, InBody Co Ltd, Fook Tin Group Holding Ltd, Omron Corporation, Bioparhom, Lumsail Industrial Inc , Biotekna, Akern, Bodystat Ltd.
3. What are the main segments of the Bioimpedance Industry?
The market segments include Product Type, Modality, Application.
4. Can you provide details about the market size?
The market size is estimated to be USD 568.43 Million as of 2022.
5. What are some drivers contributing to market growth?
Increasing Prevalence of Metabolic Disorders; Initiatives by Governments to Promote Healthy Lifestyles; Technological Advancements.
6. What are the notable trends driving market growth?
Multi-frequency Bioimpedance Analysis Segment Expected to Witness the Highest Growth During the Forecast Period.
7. Are there any restraints impacting market growth?
Inconsistency and Inaccuracy in Different Analyzers.
8. Can you provide examples of recent developments in the market?
September 2022: Xiaomi launched an eight-electrode body composition scale that provides up to 35 body composition analysis reports. This body fat scale adopts a dual-frequency bioimpedance measurement technology to provide accurate measurements.
9. What pricing options are available for accessing the report?
Pricing options include single-user, multi-user, and enterprise licenses priced at USD 4750, USD 5250, and USD 8750 respectively.
10. Is the market size provided in terms of value or volume?
The market size is provided in terms of value, measured in Million and volume, measured in K Unit.
11. Are there any specific market keywords associated with the report?
Yes, the market keyword associated with the report is "Bioimpedance Industry," which aids in identifying and referencing the specific market segment covered.
12. How do I determine which pricing option suits my needs best?
The pricing options vary based on user requirements and access needs. Individual users may opt for single-user licenses, while businesses requiring broader access may choose multi-user or enterprise licenses for cost-effective access to the report.
13. Are there any additional resources or data provided in the Bioimpedance Industry report?
While the report offers comprehensive insights, it's advisable to review the specific contents or supplementary materials provided to ascertain if additional resources or data are available.
14. How can I stay updated on further developments or reports in the Bioimpedance Industry?
To stay informed about further developments, trends, and reports in the Bioimpedance Industry, consider subscribing to industry newsletters, following relevant companies and organizations, or regularly checking reputable industry news sources and publications.
Methodology
Step 1 - Identification of Relevant Samples Size from Population Database


Step 2 - Approaches for Defining Global Market Size (Value, Volume* & Price*)

Note*: In applicable scenarios
Step 3 - Data Sources
Primary Research
- Web Analytics
- Survey Reports
- Research Institute
- Latest Research Reports
- Opinion Leaders
Secondary Research
- Annual Reports
- White Paper
- Latest Press Release
- Industry Association
- Paid Database
- Investor Presentations

Step 4 - Data Triangulation
Involves using different sources of information in order to increase the validity of a study
These sources are likely to be stakeholders in a program - participants, other researchers, program staff, other community members, and so on.
Then we put all data in single framework & apply various statistical tools to find out the dynamic on the market.
During the analysis stage, feedback from the stakeholder groups would be compared to determine areas of agreement as well as areas of divergence
