

Key Insights
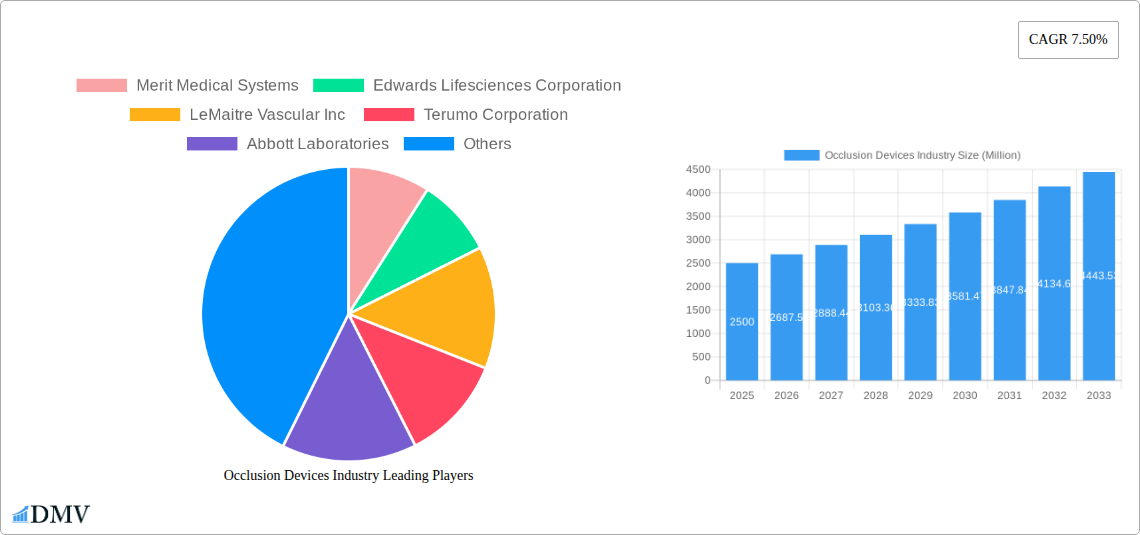
The global occlusion removal devices market is experiencing robust growth, projected to reach a significant size within the forecast period (2025-2033). A 7.50% CAGR indicates a consistently expanding market driven by several key factors. The increasing prevalence of peripheral vascular disease (PVD), neurological disorders requiring intervention, and the rising incidence of cancer necessitate advanced occlusion removal techniques, fueling market expansion. Technological advancements in embolization devices, support devices, and minimally invasive procedures contribute significantly to this growth. Furthermore, the expanding geriatric population, susceptible to vascular complications, presents a substantial patient pool for these devices. The market is segmented across various product types (Occlusion Removal Devices, Embolization Devices, Support Devices), applications (Peripheral Vascular Disease, Neurology, Oncology, Urology), and end-users (Hospitals, Ambulatory Surgical Centers). Competition among key players like Merit Medical Systems, Edwards Lifesciences Corporation, and Medtronic PLC, drives innovation and the development of more sophisticated and effective occlusion removal solutions. While potential restraints such as high costs associated with advanced devices and procedural complexities exist, the overall market trajectory remains strongly positive, supported by the compelling clinical benefits and expanding treatment options.
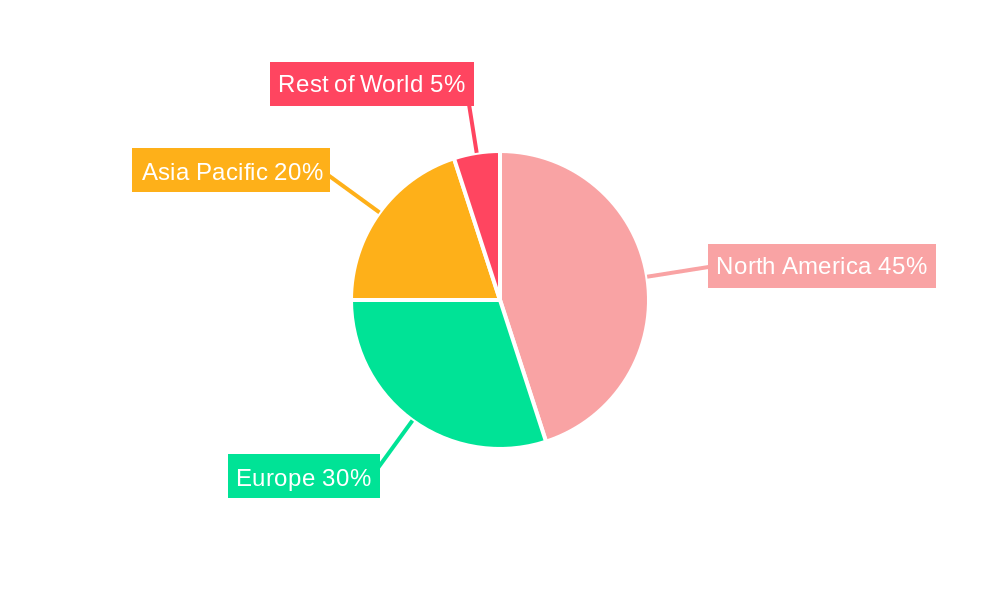
The North American market currently holds a significant share, primarily driven by high healthcare expenditure and technological adoption. However, Asia-Pacific, particularly China and India, is anticipated to witness considerable growth due to rising disposable incomes, improving healthcare infrastructure, and increasing awareness of minimally invasive procedures. Europe's established healthcare systems also contribute substantially to the market's overall value. The competitive landscape is characterized by both established players and emerging companies investing in R&D, resulting in continuous improvements in device efficacy and safety. This competitive pressure ensures innovation and price optimization, further influencing market growth. Future growth will be fueled by the development of novel materials, improved imaging techniques, and the expansion of minimally invasive techniques, increasing the accessibility and affordability of these life-saving interventions.
Occlusion Devices Industry: A Comprehensive Market Report (2019-2033)
This insightful report provides a comprehensive analysis of the Occlusion Devices industry, encompassing market trends, leading players, technological advancements, and future growth projections. With a focus on the period from 2019 to 2033, this report is an essential resource for stakeholders seeking to understand and capitalize on opportunities within this dynamic sector. The global market size is estimated at xx Million in 2025 and is projected to reach xx Million by 2033.
Occlusion Devices Industry Market Composition & Trends
This section delves into the competitive landscape of the Occlusion Devices market, examining market concentration, innovation drivers, regulatory influences, and strategic activities such as mergers and acquisitions (M&A). The report analyzes the market share distribution among key players, including Merit Medical Systems, Edwards Lifesciences Corporation, LeMaitre Vascular Inc, Terumo Corporation, Abbott Laboratories, BTG International Ltd, Medtronic PLC, Lepu Medical Technology, Johnson & Johnson, Stryker Corporation, Boston Scientific Corporation, and Penumbra Inc. We explore the impact of regulatory changes on market dynamics and identify key substitute products influencing competition. The analysis includes a review of significant M&A activities, quantifying deal values where possible (e.g., xx Million for a significant acquisition in 2022) and assessing their impact on market consolidation. Further, this report profiles end-users such as hospitals and ambulatory surgical centers, analyzing their purchasing patterns and preferences.
- Market Concentration: High, with a few major players holding significant market share.
- Innovation Catalysts: Technological advancements in minimally invasive procedures and improved device designs.
- Regulatory Landscape: Stringent regulatory approvals impact market entry and product adoption.
- Substitute Products: Competition from alternative treatment modalities influences market growth.
- M&A Activities: Consolidation through acquisitions and strategic partnerships reshapes the market landscape. Total M&A deal value from 2019-2024 estimated at xx Million.
Occlusion Devices Industry Evolution
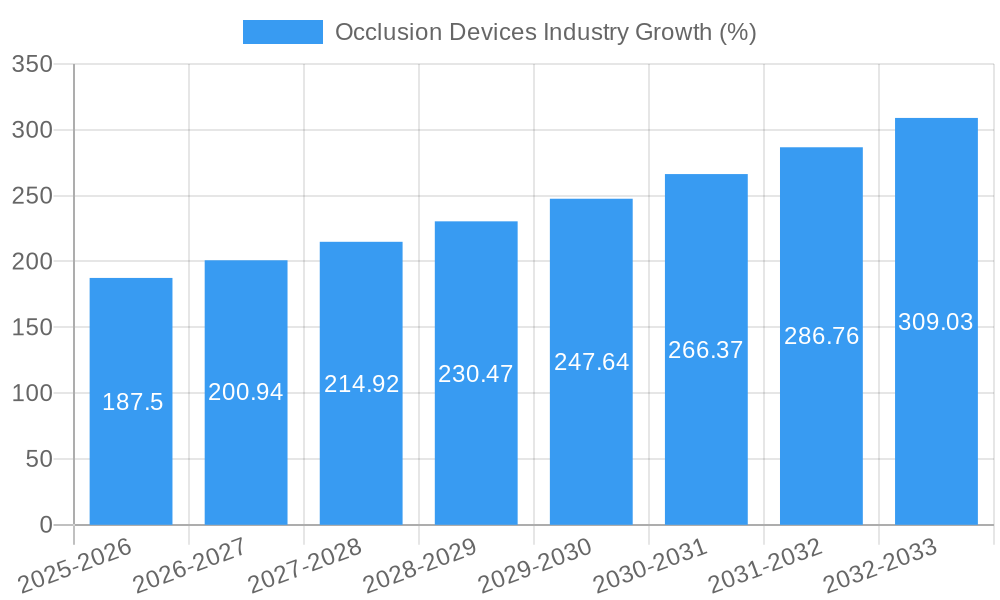
This section provides a detailed analysis of the Occlusion Devices industry's historical and projected growth trajectory. It explores the factors driving market expansion, encompassing technological innovations, evolving consumer demands, and changing treatment paradigms. Specific data points including annual growth rates (e.g., a CAGR of xx% from 2019 to 2024 for peripheral vascular occlusion devices) and adoption metrics for various technologies are included. The analysis considers shifts in end-user preferences and the impact of reimbursement policies on market access. The evolution of device design, from simpler occlusion devices to sophisticated systems integrating advanced materials and imaging technologies, is meticulously detailed. The impact of emerging markets on overall growth is also explored.
Leading Regions, Countries, or Segments in Occlusion Devices Industry
This section identifies the dominant regions, countries, and segments within the Occlusion Devices market, providing a comprehensive analysis of their contributions to overall market growth.
Product Segments:
- Occlusion Removal Devices: This segment is projected to dominate due to growing prevalence of vascular diseases and neurological conditions requiring such interventions.
- Embolization Devices: The market is fueled by increasing demand for minimally invasive procedures and advancements in embolic materials.
- Support Devices: This segment is witnessing moderate growth driven by the need for adjunct technologies to improve the effectiveness of occlusion removal procedures.
Application Segments:
- Peripheral Vascular Disease: This segment is currently the largest and projected to maintain its lead due to the high prevalence of PVD and the effectiveness of occlusion devices.
- Neurology: Technological advancements and rising prevalence of stroke and brain aneurysms are driving growth in this segment.
- Oncology: Growth is spurred by increased usage in cancer treatment procedures.
- Urology: This is a niche application area demonstrating steady growth.
- Other Applications: This category includes diverse applications with varied growth prospects.
End-User Segments:
- Hospitals: This segment dominates due to the complex procedures and specialized infrastructure required for occlusion device implantation.
- Ambulatory Surgical Centers: Growing preference for outpatient procedures is driving this segment's expansion.
- Other End Users: Includes specialized clinics and research facilities with niche applications.
Key Drivers:
- Significant investments in R&D leading to the development of innovative devices.
- Favorable regulatory environment encouraging the adoption of advanced technologies.
- Increasing prevalence of target diseases such as peripheral artery disease, stroke, and various cancers.
Occlusion Devices Industry Product Innovations
Recent innovations in occlusion devices include the development of minimally invasive devices, improved biocompatibility, and enhanced imaging capabilities. The Pipeline Vantage with Shield Technology, launched in June 2022, exemplifies these advancements, offering improved design features for both the delivery system and the implant, thereby enhancing treatment efficacy and reducing complications. Similarly, the FDA approval of Artio Medical Inc.'s Solus Gold Embolization Device in March 2022 signifies progress in the treatment of peripheral vascular occlusion. The unique selling propositions of these innovations include reduced procedural time, improved patient outcomes, and enhanced safety profiles.
Propelling Factors for Occlusion Devices Industry Growth
Several factors contribute to the growth of the Occlusion Devices market. Technological advancements, such as the development of more precise and minimally invasive devices, are a primary driver. The increasing prevalence of cardiovascular and neurological diseases fuels demand for these devices. Favorable reimbursement policies in several regions further incentivize adoption. Government initiatives promoting healthcare infrastructure development also play a crucial role in market growth. For example, initiatives to improve stroke care and expand access to minimally invasive procedures directly increase market opportunities.
Obstacles in the Occlusion Devices Industry Market
The Occlusion Devices market faces several challenges. Stringent regulatory approvals and lengthy clinical trials can delay product launches, impacting market entry. Supply chain disruptions, particularly those related to specialized materials, can cause production delays and increase costs. Intense competition among established players and the emergence of new entrants create pricing pressures. Furthermore, the high cost of devices can limit accessibility in certain regions, particularly in low- and middle-income countries.
Future Opportunities in Occlusion Devices Industry
Future opportunities lie in the development of personalized medicine approaches, incorporating advanced imaging techniques and targeted drug delivery. Expansion into emerging markets with high prevalence of target diseases presents significant growth potential. The integration of AI and machine learning for improved device design and patient selection holds promise. The focus on minimally invasive procedures and home healthcare creates new opportunities for device manufacturers.
Major Players in the Occlusion Devices Industry Ecosystem
- Merit Medical Systems
- Edwards Lifesciences Corporation
- LeMaitre Vascular Inc
- Terumo Corporation
- Abbott Laboratories
- BTG International Ltd
- Medtronic PLC
- Lepu Medical Technology
- Johnson & Johnson
- Stryker Corporation
- Boston Scientific Corporation
- Penumbra Inc
Key Developments in Occlusion Devices Industry Industry
- June 2022: Launch of Pipeline™ Vantage flow diverter with Shield Technology by Medtronic PLC, improving brain aneurysm treatment.
- March 2022: US FDA approval of Artio Medical Inc.'s Solus Gold Embolization Device for peripheral vascular occlusion.
Strategic Occlusion Devices Industry Market Forecast
The Occlusion Devices market is poised for continued growth, driven by technological advancements, increasing prevalence of target diseases, and favorable regulatory landscapes. Emerging markets and personalized medicine approaches represent significant opportunities. Continued innovation in device design and materials will drive market expansion, enhancing treatment outcomes and improving patient lives. The market is projected to witness substantial growth in the forecast period (2025-2033), reaching xx Million by 2033.
Occlusion Devices Industry Segmentation
-
1. Product
-
1.1. Occlusion Removal Devices
- 1.1.1. Coil Retrievers
- 1.1.2. Stent Retrievers
- 1.1.3. Other Occlusion Removal Devices
- 1.2. Embolization Devices
- 1.3. Support Devices
-
1.1. Occlusion Removal Devices
-
2. Application
- 2.1. Peripheral Vascular Disease
- 2.2. Neurology
- 2.3. Oncology
- 2.4. Urology
- 2.5. Other Applications
-
3. End User
- 3.1. Hospitals
- 3.2. Ambulatory Surgical Centers
- 3.3. Other End Users
Occlusion Devices Industry Segmentation By Geography
-
1. North America
- 1.1. United States
- 1.2. Canada
- 1.3. Mexico
-
2. Europe
- 2.1. Germany
- 2.2. United Kingdom
- 2.3. France
- 2.4. Italy
- 2.5. Spain
- 2.6. Rest of Europe
-
3. Asia Pacific
- 3.1. China
- 3.2. Japan
- 3.3. India
- 3.4. Australia
- 3.5. South Korea
- 3.6. Rest of Asia Pacific
-
4. Middle East and Africa
- 4.1. GCC
- 4.2. South Africa
- 4.3. Rest of Middle East and Africa
-
5. South America
- 5.1. Brazil
- 5.2. Argentina
- 5.3. Rest of South America
Occlusion Devices Industry REPORT HIGHLIGHTS
| Aspects | Details |
|---|---|
| Study Period | 2019-2033 |
| Base Year | 2024 |
| Estimated Year | 2025 |
| Forecast Period | 2025-2033 |
| Historical Period | 2019-2024 |
| Growth Rate | CAGR of 7.50% from 2019-2033 |
| Segmentation |
|
Table of Contents
- 1. Introduction
- 1.1. Research Scope
- 1.2. Market Segmentation
- 1.3. Research Methodology
- 1.4. Definitions and Assumptions
- 2. Executive Summary
- 2.1. Introduction
- 3. Market Dynamics
- 3.1. Introduction
- 3.2. Market Drivers
- 3.2.1. Rising Adoption of Minimally Invasive Surgeries; Increasing Geriatric Population and Rising Burden of Chronic Diseases; Technological Advancements
- 3.3. Market Restrains
- 3.3.1. High Cost of the Products; Requirement of Skilled Professionals
- 3.4. Market Trends
- 3.4.1. Neurology Segment is Expected to Witness a Lucrative Growth
- 4. Market Factor Analysis
- 4.1. Porters Five Forces
- 4.2. Supply/Value Chain
- 4.3. PESTEL analysis
- 4.4. Market Entropy
- 4.5. Patent/Trademark Analysis
- 5. Global Occlusion Devices Industry Analysis, Insights and Forecast, 2019-2031
- 5.1. Market Analysis, Insights and Forecast - by Product
- 5.1.1. Occlusion Removal Devices
- 5.1.1.1. Coil Retrievers
- 5.1.1.2. Stent Retrievers
- 5.1.1.3. Other Occlusion Removal Devices
- 5.1.2. Embolization Devices
- 5.1.3. Support Devices
- 5.1.1. Occlusion Removal Devices
- 5.2. Market Analysis, Insights and Forecast - by Application
- 5.2.1. Peripheral Vascular Disease
- 5.2.2. Neurology
- 5.2.3. Oncology
- 5.2.4. Urology
- 5.2.5. Other Applications
- 5.3. Market Analysis, Insights and Forecast - by End User
- 5.3.1. Hospitals
- 5.3.2. Ambulatory Surgical Centers
- 5.3.3. Other End Users
- 5.4. Market Analysis, Insights and Forecast - by Region
- 5.4.1. North America
- 5.4.2. Europe
- 5.4.3. Asia Pacific
- 5.4.4. Middle East and Africa
- 5.4.5. South America
- 5.1. Market Analysis, Insights and Forecast - by Product
- 6. North America Occlusion Devices Industry Analysis, Insights and Forecast, 2019-2031
- 6.1. Market Analysis, Insights and Forecast - by Product
- 6.1.1. Occlusion Removal Devices
- 6.1.1.1. Coil Retrievers
- 6.1.1.2. Stent Retrievers
- 6.1.1.3. Other Occlusion Removal Devices
- 6.1.2. Embolization Devices
- 6.1.3. Support Devices
- 6.1.1. Occlusion Removal Devices
- 6.2. Market Analysis, Insights and Forecast - by Application
- 6.2.1. Peripheral Vascular Disease
- 6.2.2. Neurology
- 6.2.3. Oncology
- 6.2.4. Urology
- 6.2.5. Other Applications
- 6.3. Market Analysis, Insights and Forecast - by End User
- 6.3.1. Hospitals
- 6.3.2. Ambulatory Surgical Centers
- 6.3.3. Other End Users
- 6.1. Market Analysis, Insights and Forecast - by Product
- 7. Europe Occlusion Devices Industry Analysis, Insights and Forecast, 2019-2031
- 7.1. Market Analysis, Insights and Forecast - by Product
- 7.1.1. Occlusion Removal Devices
- 7.1.1.1. Coil Retrievers
- 7.1.1.2. Stent Retrievers
- 7.1.1.3. Other Occlusion Removal Devices
- 7.1.2. Embolization Devices
- 7.1.3. Support Devices
- 7.1.1. Occlusion Removal Devices
- 7.2. Market Analysis, Insights and Forecast - by Application
- 7.2.1. Peripheral Vascular Disease
- 7.2.2. Neurology
- 7.2.3. Oncology
- 7.2.4. Urology
- 7.2.5. Other Applications
- 7.3. Market Analysis, Insights and Forecast - by End User
- 7.3.1. Hospitals
- 7.3.2. Ambulatory Surgical Centers
- 7.3.3. Other End Users
- 7.1. Market Analysis, Insights and Forecast - by Product
- 8. Asia Pacific Occlusion Devices Industry Analysis, Insights and Forecast, 2019-2031
- 8.1. Market Analysis, Insights and Forecast - by Product
- 8.1.1. Occlusion Removal Devices
- 8.1.1.1. Coil Retrievers
- 8.1.1.2. Stent Retrievers
- 8.1.1.3. Other Occlusion Removal Devices
- 8.1.2. Embolization Devices
- 8.1.3. Support Devices
- 8.1.1. Occlusion Removal Devices
- 8.2. Market Analysis, Insights and Forecast - by Application
- 8.2.1. Peripheral Vascular Disease
- 8.2.2. Neurology
- 8.2.3. Oncology
- 8.2.4. Urology
- 8.2.5. Other Applications
- 8.3. Market Analysis, Insights and Forecast - by End User
- 8.3.1. Hospitals
- 8.3.2. Ambulatory Surgical Centers
- 8.3.3. Other End Users
- 8.1. Market Analysis, Insights and Forecast - by Product
- 9. Middle East and Africa Occlusion Devices Industry Analysis, Insights and Forecast, 2019-2031
- 9.1. Market Analysis, Insights and Forecast - by Product
- 9.1.1. Occlusion Removal Devices
- 9.1.1.1. Coil Retrievers
- 9.1.1.2. Stent Retrievers
- 9.1.1.3. Other Occlusion Removal Devices
- 9.1.2. Embolization Devices
- 9.1.3. Support Devices
- 9.1.1. Occlusion Removal Devices
- 9.2. Market Analysis, Insights and Forecast - by Application
- 9.2.1. Peripheral Vascular Disease
- 9.2.2. Neurology
- 9.2.3. Oncology
- 9.2.4. Urology
- 9.2.5. Other Applications
- 9.3. Market Analysis, Insights and Forecast - by End User
- 9.3.1. Hospitals
- 9.3.2. Ambulatory Surgical Centers
- 9.3.3. Other End Users
- 9.1. Market Analysis, Insights and Forecast - by Product
- 10. South America Occlusion Devices Industry Analysis, Insights and Forecast, 2019-2031
- 10.1. Market Analysis, Insights and Forecast - by Product
- 10.1.1. Occlusion Removal Devices
- 10.1.1.1. Coil Retrievers
- 10.1.1.2. Stent Retrievers
- 10.1.1.3. Other Occlusion Removal Devices
- 10.1.2. Embolization Devices
- 10.1.3. Support Devices
- 10.1.1. Occlusion Removal Devices
- 10.2. Market Analysis, Insights and Forecast - by Application
- 10.2.1. Peripheral Vascular Disease
- 10.2.2. Neurology
- 10.2.3. Oncology
- 10.2.4. Urology
- 10.2.5. Other Applications
- 10.3. Market Analysis, Insights and Forecast - by End User
- 10.3.1. Hospitals
- 10.3.2. Ambulatory Surgical Centers
- 10.3.3. Other End Users
- 10.1. Market Analysis, Insights and Forecast - by Product
- 11. North Americ Occlusion Devices Industry Analysis, Insights and Forecast, 2019-2031
- 11.1. Market Analysis, Insights and Forecast - By Country/Sub-region
- 11.1.1 United States
- 11.1.2 Canada
- 11.1.3 Mexico
- 12. South America Occlusion Devices Industry Analysis, Insights and Forecast, 2019-2031
- 12.1. Market Analysis, Insights and Forecast - By Country/Sub-region
- 12.1.1 Brazil
- 12.1.2 Mexico
- 12.1.3 Rest of South America
- 13. Europe Occlusion Devices Industry Analysis, Insights and Forecast, 2019-2031
- 13.1. Market Analysis, Insights and Forecast - By Country/Sub-region
- 13.1.1 Germany
- 13.1.2 United Kingdom
- 13.1.3 France
- 13.1.4 Italy
- 13.1.5 Spain
- 13.1.6 Rest of Europe
- 14. Asia Pacific Occlusion Devices Industry Analysis, Insights and Forecast, 2019-2031
- 14.1. Market Analysis, Insights and Forecast - By Country/Sub-region
- 14.1.1 China
- 14.1.2 Japan
- 14.1.3 India
- 14.1.4 South Korea
- 14.1.5 Taiwan
- 14.1.6 Australia
- 14.1.7 Rest of Asia-Pacific
- 15. MEA Occlusion Devices Industry Analysis, Insights and Forecast, 2019-2031
- 15.1. Market Analysis, Insights and Forecast - By Country/Sub-region
- 15.1.1 Middle East
- 15.1.2 Africa
- 16. Competitive Analysis
- 16.1. Global Market Share Analysis 2024
- 16.2. Company Profiles
- 16.2.1 Merit Medical Systems
- 16.2.1.1. Overview
- 16.2.1.2. Products
- 16.2.1.3. SWOT Analysis
- 16.2.1.4. Recent Developments
- 16.2.1.5. Financials (Based on Availability)
- 16.2.2 Edwards Lifesciences Corporation
- 16.2.2.1. Overview
- 16.2.2.2. Products
- 16.2.2.3. SWOT Analysis
- 16.2.2.4. Recent Developments
- 16.2.2.5. Financials (Based on Availability)
- 16.2.3 LeMaitre Vascular Inc
- 16.2.3.1. Overview
- 16.2.3.2. Products
- 16.2.3.3. SWOT Analysis
- 16.2.3.4. Recent Developments
- 16.2.3.5. Financials (Based on Availability)
- 16.2.4 Terumo Corporation
- 16.2.4.1. Overview
- 16.2.4.2. Products
- 16.2.4.3. SWOT Analysis
- 16.2.4.4. Recent Developments
- 16.2.4.5. Financials (Based on Availability)
- 16.2.5 Abbott Laboratories
- 16.2.5.1. Overview
- 16.2.5.2. Products
- 16.2.5.3. SWOT Analysis
- 16.2.5.4. Recent Developments
- 16.2.5.5. Financials (Based on Availability)
- 16.2.6 BTG International Ltd
- 16.2.6.1. Overview
- 16.2.6.2. Products
- 16.2.6.3. SWOT Analysis
- 16.2.6.4. Recent Developments
- 16.2.6.5. Financials (Based on Availability)
- 16.2.7 Medtronic PLC
- 16.2.7.1. Overview
- 16.2.7.2. Products
- 16.2.7.3. SWOT Analysis
- 16.2.7.4. Recent Developments
- 16.2.7.5. Financials (Based on Availability)
- 16.2.8 Lepu Medical Technology
- 16.2.8.1. Overview
- 16.2.8.2. Products
- 16.2.8.3. SWOT Analysis
- 16.2.8.4. Recent Developments
- 16.2.8.5. Financials (Based on Availability)
- 16.2.9 Johnson & Johnson
- 16.2.9.1. Overview
- 16.2.9.2. Products
- 16.2.9.3. SWOT Analysis
- 16.2.9.4. Recent Developments
- 16.2.9.5. Financials (Based on Availability)
- 16.2.10 Stryker Corporation
- 16.2.10.1. Overview
- 16.2.10.2. Products
- 16.2.10.3. SWOT Analysis
- 16.2.10.4. Recent Developments
- 16.2.10.5. Financials (Based on Availability)
- 16.2.11 Boston Scientific Corporation
- 16.2.11.1. Overview
- 16.2.11.2. Products
- 16.2.11.3. SWOT Analysis
- 16.2.11.4. Recent Developments
- 16.2.11.5. Financials (Based on Availability)
- 16.2.12 Penumbra Inc
- 16.2.12.1. Overview
- 16.2.12.2. Products
- 16.2.12.3. SWOT Analysis
- 16.2.12.4. Recent Developments
- 16.2.12.5. Financials (Based on Availability)
- 16.2.1 Merit Medical Systems
List of Figures
- Figure 1: Global Occlusion Devices Industry Revenue Breakdown (Million, %) by Region 2024 & 2032
- Figure 2: Global Occlusion Devices Industry Volume Breakdown (K Unit, %) by Region 2024 & 2032
- Figure 3: North Americ Occlusion Devices Industry Revenue (Million), by Country 2024 & 2032
- Figure 4: North Americ Occlusion Devices Industry Volume (K Unit), by Country 2024 & 2032
- Figure 5: North Americ Occlusion Devices Industry Revenue Share (%), by Country 2024 & 2032
- Figure 6: North Americ Occlusion Devices Industry Volume Share (%), by Country 2024 & 2032
- Figure 7: South America Occlusion Devices Industry Revenue (Million), by Country 2024 & 2032
- Figure 8: South America Occlusion Devices Industry Volume (K Unit), by Country 2024 & 2032
- Figure 9: South America Occlusion Devices Industry Revenue Share (%), by Country 2024 & 2032
- Figure 10: South America Occlusion Devices Industry Volume Share (%), by Country 2024 & 2032
- Figure 11: Europe Occlusion Devices Industry Revenue (Million), by Country 2024 & 2032
- Figure 12: Europe Occlusion Devices Industry Volume (K Unit), by Country 2024 & 2032
- Figure 13: Europe Occlusion Devices Industry Revenue Share (%), by Country 2024 & 2032
- Figure 14: Europe Occlusion Devices Industry Volume Share (%), by Country 2024 & 2032
- Figure 15: Asia Pacific Occlusion Devices Industry Revenue (Million), by Country 2024 & 2032
- Figure 16: Asia Pacific Occlusion Devices Industry Volume (K Unit), by Country 2024 & 2032
- Figure 17: Asia Pacific Occlusion Devices Industry Revenue Share (%), by Country 2024 & 2032
- Figure 18: Asia Pacific Occlusion Devices Industry Volume Share (%), by Country 2024 & 2032
- Figure 19: MEA Occlusion Devices Industry Revenue (Million), by Country 2024 & 2032
- Figure 20: MEA Occlusion Devices Industry Volume (K Unit), by Country 2024 & 2032
- Figure 21: MEA Occlusion Devices Industry Revenue Share (%), by Country 2024 & 2032
- Figure 22: MEA Occlusion Devices Industry Volume Share (%), by Country 2024 & 2032
- Figure 23: North America Occlusion Devices Industry Revenue (Million), by Product 2024 & 2032
- Figure 24: North America Occlusion Devices Industry Volume (K Unit), by Product 2024 & 2032
- Figure 25: North America Occlusion Devices Industry Revenue Share (%), by Product 2024 & 2032
- Figure 26: North America Occlusion Devices Industry Volume Share (%), by Product 2024 & 2032
- Figure 27: North America Occlusion Devices Industry Revenue (Million), by Application 2024 & 2032
- Figure 28: North America Occlusion Devices Industry Volume (K Unit), by Application 2024 & 2032
- Figure 29: North America Occlusion Devices Industry Revenue Share (%), by Application 2024 & 2032
- Figure 30: North America Occlusion Devices Industry Volume Share (%), by Application 2024 & 2032
- Figure 31: North America Occlusion Devices Industry Revenue (Million), by End User 2024 & 2032
- Figure 32: North America Occlusion Devices Industry Volume (K Unit), by End User 2024 & 2032
- Figure 33: North America Occlusion Devices Industry Revenue Share (%), by End User 2024 & 2032
- Figure 34: North America Occlusion Devices Industry Volume Share (%), by End User 2024 & 2032
- Figure 35: North America Occlusion Devices Industry Revenue (Million), by Country 2024 & 2032
- Figure 36: North America Occlusion Devices Industry Volume (K Unit), by Country 2024 & 2032
- Figure 37: North America Occlusion Devices Industry Revenue Share (%), by Country 2024 & 2032
- Figure 38: North America Occlusion Devices Industry Volume Share (%), by Country 2024 & 2032
- Figure 39: Europe Occlusion Devices Industry Revenue (Million), by Product 2024 & 2032
- Figure 40: Europe Occlusion Devices Industry Volume (K Unit), by Product 2024 & 2032
- Figure 41: Europe Occlusion Devices Industry Revenue Share (%), by Product 2024 & 2032
- Figure 42: Europe Occlusion Devices Industry Volume Share (%), by Product 2024 & 2032
- Figure 43: Europe Occlusion Devices Industry Revenue (Million), by Application 2024 & 2032
- Figure 44: Europe Occlusion Devices Industry Volume (K Unit), by Application 2024 & 2032
- Figure 45: Europe Occlusion Devices Industry Revenue Share (%), by Application 2024 & 2032
- Figure 46: Europe Occlusion Devices Industry Volume Share (%), by Application 2024 & 2032
- Figure 47: Europe Occlusion Devices Industry Revenue (Million), by End User 2024 & 2032
- Figure 48: Europe Occlusion Devices Industry Volume (K Unit), by End User 2024 & 2032
- Figure 49: Europe Occlusion Devices Industry Revenue Share (%), by End User 2024 & 2032
- Figure 50: Europe Occlusion Devices Industry Volume Share (%), by End User 2024 & 2032
- Figure 51: Europe Occlusion Devices Industry Revenue (Million), by Country 2024 & 2032
- Figure 52: Europe Occlusion Devices Industry Volume (K Unit), by Country 2024 & 2032
- Figure 53: Europe Occlusion Devices Industry Revenue Share (%), by Country 2024 & 2032
- Figure 54: Europe Occlusion Devices Industry Volume Share (%), by Country 2024 & 2032
- Figure 55: Asia Pacific Occlusion Devices Industry Revenue (Million), by Product 2024 & 2032
- Figure 56: Asia Pacific Occlusion Devices Industry Volume (K Unit), by Product 2024 & 2032
- Figure 57: Asia Pacific Occlusion Devices Industry Revenue Share (%), by Product 2024 & 2032
- Figure 58: Asia Pacific Occlusion Devices Industry Volume Share (%), by Product 2024 & 2032
- Figure 59: Asia Pacific Occlusion Devices Industry Revenue (Million), by Application 2024 & 2032
- Figure 60: Asia Pacific Occlusion Devices Industry Volume (K Unit), by Application 2024 & 2032
- Figure 61: Asia Pacific Occlusion Devices Industry Revenue Share (%), by Application 2024 & 2032
- Figure 62: Asia Pacific Occlusion Devices Industry Volume Share (%), by Application 2024 & 2032
- Figure 63: Asia Pacific Occlusion Devices Industry Revenue (Million), by End User 2024 & 2032
- Figure 64: Asia Pacific Occlusion Devices Industry Volume (K Unit), by End User 2024 & 2032
- Figure 65: Asia Pacific Occlusion Devices Industry Revenue Share (%), by End User 2024 & 2032
- Figure 66: Asia Pacific Occlusion Devices Industry Volume Share (%), by End User 2024 & 2032
- Figure 67: Asia Pacific Occlusion Devices Industry Revenue (Million), by Country 2024 & 2032
- Figure 68: Asia Pacific Occlusion Devices Industry Volume (K Unit), by Country 2024 & 2032
- Figure 69: Asia Pacific Occlusion Devices Industry Revenue Share (%), by Country 2024 & 2032
- Figure 70: Asia Pacific Occlusion Devices Industry Volume Share (%), by Country 2024 & 2032
- Figure 71: Middle East and Africa Occlusion Devices Industry Revenue (Million), by Product 2024 & 2032
- Figure 72: Middle East and Africa Occlusion Devices Industry Volume (K Unit), by Product 2024 & 2032
- Figure 73: Middle East and Africa Occlusion Devices Industry Revenue Share (%), by Product 2024 & 2032
- Figure 74: Middle East and Africa Occlusion Devices Industry Volume Share (%), by Product 2024 & 2032
- Figure 75: Middle East and Africa Occlusion Devices Industry Revenue (Million), by Application 2024 & 2032
- Figure 76: Middle East and Africa Occlusion Devices Industry Volume (K Unit), by Application 2024 & 2032
- Figure 77: Middle East and Africa Occlusion Devices Industry Revenue Share (%), by Application 2024 & 2032
- Figure 78: Middle East and Africa Occlusion Devices Industry Volume Share (%), by Application 2024 & 2032
- Figure 79: Middle East and Africa Occlusion Devices Industry Revenue (Million), by End User 2024 & 2032
- Figure 80: Middle East and Africa Occlusion Devices Industry Volume (K Unit), by End User 2024 & 2032
- Figure 81: Middle East and Africa Occlusion Devices Industry Revenue Share (%), by End User 2024 & 2032
- Figure 82: Middle East and Africa Occlusion Devices Industry Volume Share (%), by End User 2024 & 2032
- Figure 83: Middle East and Africa Occlusion Devices Industry Revenue (Million), by Country 2024 & 2032
- Figure 84: Middle East and Africa Occlusion Devices Industry Volume (K Unit), by Country 2024 & 2032
- Figure 85: Middle East and Africa Occlusion Devices Industry Revenue Share (%), by Country 2024 & 2032
- Figure 86: Middle East and Africa Occlusion Devices Industry Volume Share (%), by Country 2024 & 2032
- Figure 87: South America Occlusion Devices Industry Revenue (Million), by Product 2024 & 2032
- Figure 88: South America Occlusion Devices Industry Volume (K Unit), by Product 2024 & 2032
- Figure 89: South America Occlusion Devices Industry Revenue Share (%), by Product 2024 & 2032
- Figure 90: South America Occlusion Devices Industry Volume Share (%), by Product 2024 & 2032
- Figure 91: South America Occlusion Devices Industry Revenue (Million), by Application 2024 & 2032
- Figure 92: South America Occlusion Devices Industry Volume (K Unit), by Application 2024 & 2032
- Figure 93: South America Occlusion Devices Industry Revenue Share (%), by Application 2024 & 2032
- Figure 94: South America Occlusion Devices Industry Volume Share (%), by Application 2024 & 2032
- Figure 95: South America Occlusion Devices Industry Revenue (Million), by End User 2024 & 2032
- Figure 96: South America Occlusion Devices Industry Volume (K Unit), by End User 2024 & 2032
- Figure 97: South America Occlusion Devices Industry Revenue Share (%), by End User 2024 & 2032
- Figure 98: South America Occlusion Devices Industry Volume Share (%), by End User 2024 & 2032
- Figure 99: South America Occlusion Devices Industry Revenue (Million), by Country 2024 & 2032
- Figure 100: South America Occlusion Devices Industry Volume (K Unit), by Country 2024 & 2032
- Figure 101: South America Occlusion Devices Industry Revenue Share (%), by Country 2024 & 2032
- Figure 102: South America Occlusion Devices Industry Volume Share (%), by Country 2024 & 2032
List of Tables
- Table 1: Global Occlusion Devices Industry Revenue Million Forecast, by Region 2019 & 2032
- Table 2: Global Occlusion Devices Industry Volume K Unit Forecast, by Region 2019 & 2032
- Table 3: Global Occlusion Devices Industry Revenue Million Forecast, by Product 2019 & 2032
- Table 4: Global Occlusion Devices Industry Volume K Unit Forecast, by Product 2019 & 2032
- Table 5: Global Occlusion Devices Industry Revenue Million Forecast, by Application 2019 & 2032
- Table 6: Global Occlusion Devices Industry Volume K Unit Forecast, by Application 2019 & 2032
- Table 7: Global Occlusion Devices Industry Revenue Million Forecast, by End User 2019 & 2032
- Table 8: Global Occlusion Devices Industry Volume K Unit Forecast, by End User 2019 & 2032
- Table 9: Global Occlusion Devices Industry Revenue Million Forecast, by Region 2019 & 2032
- Table 10: Global Occlusion Devices Industry Volume K Unit Forecast, by Region 2019 & 2032
- Table 11: Global Occlusion Devices Industry Revenue Million Forecast, by Country 2019 & 2032
- Table 12: Global Occlusion Devices Industry Volume K Unit Forecast, by Country 2019 & 2032
- Table 13: United States Occlusion Devices Industry Revenue (Million) Forecast, by Application 2019 & 2032
- Table 14: United States Occlusion Devices Industry Volume (K Unit) Forecast, by Application 2019 & 2032
- Table 15: Canada Occlusion Devices Industry Revenue (Million) Forecast, by Application 2019 & 2032
- Table 16: Canada Occlusion Devices Industry Volume (K Unit) Forecast, by Application 2019 & 2032
- Table 17: Mexico Occlusion Devices Industry Revenue (Million) Forecast, by Application 2019 & 2032
- Table 18: Mexico Occlusion Devices Industry Volume (K Unit) Forecast, by Application 2019 & 2032
- Table 19: Global Occlusion Devices Industry Revenue Million Forecast, by Country 2019 & 2032
- Table 20: Global Occlusion Devices Industry Volume K Unit Forecast, by Country 2019 & 2032
- Table 21: Brazil Occlusion Devices Industry Revenue (Million) Forecast, by Application 2019 & 2032
- Table 22: Brazil Occlusion Devices Industry Volume (K Unit) Forecast, by Application 2019 & 2032
- Table 23: Mexico Occlusion Devices Industry Revenue (Million) Forecast, by Application 2019 & 2032
- Table 24: Mexico Occlusion Devices Industry Volume (K Unit) Forecast, by Application 2019 & 2032
- Table 25: Rest of South America Occlusion Devices Industry Revenue (Million) Forecast, by Application 2019 & 2032
- Table 26: Rest of South America Occlusion Devices Industry Volume (K Unit) Forecast, by Application 2019 & 2032
- Table 27: Global Occlusion Devices Industry Revenue Million Forecast, by Country 2019 & 2032
- Table 28: Global Occlusion Devices Industry Volume K Unit Forecast, by Country 2019 & 2032
- Table 29: Germany Occlusion Devices Industry Revenue (Million) Forecast, by Application 2019 & 2032
- Table 30: Germany Occlusion Devices Industry Volume (K Unit) Forecast, by Application 2019 & 2032
- Table 31: United Kingdom Occlusion Devices Industry Revenue (Million) Forecast, by Application 2019 & 2032
- Table 32: United Kingdom Occlusion Devices Industry Volume (K Unit) Forecast, by Application 2019 & 2032
- Table 33: France Occlusion Devices Industry Revenue (Million) Forecast, by Application 2019 & 2032
- Table 34: France Occlusion Devices Industry Volume (K Unit) Forecast, by Application 2019 & 2032
- Table 35: Italy Occlusion Devices Industry Revenue (Million) Forecast, by Application 2019 & 2032
- Table 36: Italy Occlusion Devices Industry Volume (K Unit) Forecast, by Application 2019 & 2032
- Table 37: Spain Occlusion Devices Industry Revenue (Million) Forecast, by Application 2019 & 2032
- Table 38: Spain Occlusion Devices Industry Volume (K Unit) Forecast, by Application 2019 & 2032
- Table 39: Rest of Europe Occlusion Devices Industry Revenue (Million) Forecast, by Application 2019 & 2032
- Table 40: Rest of Europe Occlusion Devices Industry Volume (K Unit) Forecast, by Application 2019 & 2032
- Table 41: Global Occlusion Devices Industry Revenue Million Forecast, by Country 2019 & 2032
- Table 42: Global Occlusion Devices Industry Volume K Unit Forecast, by Country 2019 & 2032
- Table 43: China Occlusion Devices Industry Revenue (Million) Forecast, by Application 2019 & 2032
- Table 44: China Occlusion Devices Industry Volume (K Unit) Forecast, by Application 2019 & 2032
- Table 45: Japan Occlusion Devices Industry Revenue (Million) Forecast, by Application 2019 & 2032
- Table 46: Japan Occlusion Devices Industry Volume (K Unit) Forecast, by Application 2019 & 2032
- Table 47: India Occlusion Devices Industry Revenue (Million) Forecast, by Application 2019 & 2032
- Table 48: India Occlusion Devices Industry Volume (K Unit) Forecast, by Application 2019 & 2032
- Table 49: South Korea Occlusion Devices Industry Revenue (Million) Forecast, by Application 2019 & 2032
- Table 50: South Korea Occlusion Devices Industry Volume (K Unit) Forecast, by Application 2019 & 2032
- Table 51: Taiwan Occlusion Devices Industry Revenue (Million) Forecast, by Application 2019 & 2032
- Table 52: Taiwan Occlusion Devices Industry Volume (K Unit) Forecast, by Application 2019 & 2032
- Table 53: Australia Occlusion Devices Industry Revenue (Million) Forecast, by Application 2019 & 2032
- Table 54: Australia Occlusion Devices Industry Volume (K Unit) Forecast, by Application 2019 & 2032
- Table 55: Rest of Asia-Pacific Occlusion Devices Industry Revenue (Million) Forecast, by Application 2019 & 2032
- Table 56: Rest of Asia-Pacific Occlusion Devices Industry Volume (K Unit) Forecast, by Application 2019 & 2032
- Table 57: Global Occlusion Devices Industry Revenue Million Forecast, by Country 2019 & 2032
- Table 58: Global Occlusion Devices Industry Volume K Unit Forecast, by Country 2019 & 2032
- Table 59: Middle East Occlusion Devices Industry Revenue (Million) Forecast, by Application 2019 & 2032
- Table 60: Middle East Occlusion Devices Industry Volume (K Unit) Forecast, by Application 2019 & 2032
- Table 61: Africa Occlusion Devices Industry Revenue (Million) Forecast, by Application 2019 & 2032
- Table 62: Africa Occlusion Devices Industry Volume (K Unit) Forecast, by Application 2019 & 2032
- Table 63: Global Occlusion Devices Industry Revenue Million Forecast, by Product 2019 & 2032
- Table 64: Global Occlusion Devices Industry Volume K Unit Forecast, by Product 2019 & 2032
- Table 65: Global Occlusion Devices Industry Revenue Million Forecast, by Application 2019 & 2032
- Table 66: Global Occlusion Devices Industry Volume K Unit Forecast, by Application 2019 & 2032
- Table 67: Global Occlusion Devices Industry Revenue Million Forecast, by End User 2019 & 2032
- Table 68: Global Occlusion Devices Industry Volume K Unit Forecast, by End User 2019 & 2032
- Table 69: Global Occlusion Devices Industry Revenue Million Forecast, by Country 2019 & 2032
- Table 70: Global Occlusion Devices Industry Volume K Unit Forecast, by Country 2019 & 2032
- Table 71: United States Occlusion Devices Industry Revenue (Million) Forecast, by Application 2019 & 2032
- Table 72: United States Occlusion Devices Industry Volume (K Unit) Forecast, by Application 2019 & 2032
- Table 73: Canada Occlusion Devices Industry Revenue (Million) Forecast, by Application 2019 & 2032
- Table 74: Canada Occlusion Devices Industry Volume (K Unit) Forecast, by Application 2019 & 2032
- Table 75: Mexico Occlusion Devices Industry Revenue (Million) Forecast, by Application 2019 & 2032
- Table 76: Mexico Occlusion Devices Industry Volume (K Unit) Forecast, by Application 2019 & 2032
- Table 77: Global Occlusion Devices Industry Revenue Million Forecast, by Product 2019 & 2032
- Table 78: Global Occlusion Devices Industry Volume K Unit Forecast, by Product 2019 & 2032
- Table 79: Global Occlusion Devices Industry Revenue Million Forecast, by Application 2019 & 2032
- Table 80: Global Occlusion Devices Industry Volume K Unit Forecast, by Application 2019 & 2032
- Table 81: Global Occlusion Devices Industry Revenue Million Forecast, by End User 2019 & 2032
- Table 82: Global Occlusion Devices Industry Volume K Unit Forecast, by End User 2019 & 2032
- Table 83: Global Occlusion Devices Industry Revenue Million Forecast, by Country 2019 & 2032
- Table 84: Global Occlusion Devices Industry Volume K Unit Forecast, by Country 2019 & 2032
- Table 85: Germany Occlusion Devices Industry Revenue (Million) Forecast, by Application 2019 & 2032
- Table 86: Germany Occlusion Devices Industry Volume (K Unit) Forecast, by Application 2019 & 2032
- Table 87: United Kingdom Occlusion Devices Industry Revenue (Million) Forecast, by Application 2019 & 2032
- Table 88: United Kingdom Occlusion Devices Industry Volume (K Unit) Forecast, by Application 2019 & 2032
- Table 89: France Occlusion Devices Industry Revenue (Million) Forecast, by Application 2019 & 2032
- Table 90: France Occlusion Devices Industry Volume (K Unit) Forecast, by Application 2019 & 2032
- Table 91: Italy Occlusion Devices Industry Revenue (Million) Forecast, by Application 2019 & 2032
- Table 92: Italy Occlusion Devices Industry Volume (K Unit) Forecast, by Application 2019 & 2032
- Table 93: Spain Occlusion Devices Industry Revenue (Million) Forecast, by Application 2019 & 2032
- Table 94: Spain Occlusion Devices Industry Volume (K Unit) Forecast, by Application 2019 & 2032
- Table 95: Rest of Europe Occlusion Devices Industry Revenue (Million) Forecast, by Application 2019 & 2032
- Table 96: Rest of Europe Occlusion Devices Industry Volume (K Unit) Forecast, by Application 2019 & 2032
- Table 97: Global Occlusion Devices Industry Revenue Million Forecast, by Product 2019 & 2032
- Table 98: Global Occlusion Devices Industry Volume K Unit Forecast, by Product 2019 & 2032
- Table 99: Global Occlusion Devices Industry Revenue Million Forecast, by Application 2019 & 2032
- Table 100: Global Occlusion Devices Industry Volume K Unit Forecast, by Application 2019 & 2032
- Table 101: Global Occlusion Devices Industry Revenue Million Forecast, by End User 2019 & 2032
- Table 102: Global Occlusion Devices Industry Volume K Unit Forecast, by End User 2019 & 2032
- Table 103: Global Occlusion Devices Industry Revenue Million Forecast, by Country 2019 & 2032
- Table 104: Global Occlusion Devices Industry Volume K Unit Forecast, by Country 2019 & 2032
- Table 105: China Occlusion Devices Industry Revenue (Million) Forecast, by Application 2019 & 2032
- Table 106: China Occlusion Devices Industry Volume (K Unit) Forecast, by Application 2019 & 2032
- Table 107: Japan Occlusion Devices Industry Revenue (Million) Forecast, by Application 2019 & 2032
- Table 108: Japan Occlusion Devices Industry Volume (K Unit) Forecast, by Application 2019 & 2032
- Table 109: India Occlusion Devices Industry Revenue (Million) Forecast, by Application 2019 & 2032
- Table 110: India Occlusion Devices Industry Volume (K Unit) Forecast, by Application 2019 & 2032
- Table 111: Australia Occlusion Devices Industry Revenue (Million) Forecast, by Application 2019 & 2032
- Table 112: Australia Occlusion Devices Industry Volume (K Unit) Forecast, by Application 2019 & 2032
- Table 113: South Korea Occlusion Devices Industry Revenue (Million) Forecast, by Application 2019 & 2032
- Table 114: South Korea Occlusion Devices Industry Volume (K Unit) Forecast, by Application 2019 & 2032
- Table 115: Rest of Asia Pacific Occlusion Devices Industry Revenue (Million) Forecast, by Application 2019 & 2032
- Table 116: Rest of Asia Pacific Occlusion Devices Industry Volume (K Unit) Forecast, by Application 2019 & 2032
- Table 117: Global Occlusion Devices Industry Revenue Million Forecast, by Product 2019 & 2032
- Table 118: Global Occlusion Devices Industry Volume K Unit Forecast, by Product 2019 & 2032
- Table 119: Global Occlusion Devices Industry Revenue Million Forecast, by Application 2019 & 2032
- Table 120: Global Occlusion Devices Industry Volume K Unit Forecast, by Application 2019 & 2032
- Table 121: Global Occlusion Devices Industry Revenue Million Forecast, by End User 2019 & 2032
- Table 122: Global Occlusion Devices Industry Volume K Unit Forecast, by End User 2019 & 2032
- Table 123: Global Occlusion Devices Industry Revenue Million Forecast, by Country 2019 & 2032
- Table 124: Global Occlusion Devices Industry Volume K Unit Forecast, by Country 2019 & 2032
- Table 125: GCC Occlusion Devices Industry Revenue (Million) Forecast, by Application 2019 & 2032
- Table 126: GCC Occlusion Devices Industry Volume (K Unit) Forecast, by Application 2019 & 2032
- Table 127: South Africa Occlusion Devices Industry Revenue (Million) Forecast, by Application 2019 & 2032
- Table 128: South Africa Occlusion Devices Industry Volume (K Unit) Forecast, by Application 2019 & 2032
- Table 129: Rest of Middle East and Africa Occlusion Devices Industry Revenue (Million) Forecast, by Application 2019 & 2032
- Table 130: Rest of Middle East and Africa Occlusion Devices Industry Volume (K Unit) Forecast, by Application 2019 & 2032
- Table 131: Global Occlusion Devices Industry Revenue Million Forecast, by Product 2019 & 2032
- Table 132: Global Occlusion Devices Industry Volume K Unit Forecast, by Product 2019 & 2032
- Table 133: Global Occlusion Devices Industry Revenue Million Forecast, by Application 2019 & 2032
- Table 134: Global Occlusion Devices Industry Volume K Unit Forecast, by Application 2019 & 2032
- Table 135: Global Occlusion Devices Industry Revenue Million Forecast, by End User 2019 & 2032
- Table 136: Global Occlusion Devices Industry Volume K Unit Forecast, by End User 2019 & 2032
- Table 137: Global Occlusion Devices Industry Revenue Million Forecast, by Country 2019 & 2032
- Table 138: Global Occlusion Devices Industry Volume K Unit Forecast, by Country 2019 & 2032
- Table 139: Brazil Occlusion Devices Industry Revenue (Million) Forecast, by Application 2019 & 2032
- Table 140: Brazil Occlusion Devices Industry Volume (K Unit) Forecast, by Application 2019 & 2032
- Table 141: Argentina Occlusion Devices Industry Revenue (Million) Forecast, by Application 2019 & 2032
- Table 142: Argentina Occlusion Devices Industry Volume (K Unit) Forecast, by Application 2019 & 2032
- Table 143: Rest of South America Occlusion Devices Industry Revenue (Million) Forecast, by Application 2019 & 2032
- Table 144: Rest of South America Occlusion Devices Industry Volume (K Unit) Forecast, by Application 2019 & 2032
Frequently Asked Questions
1. What is the projected Compound Annual Growth Rate (CAGR) of the Occlusion Devices Industry?
The projected CAGR is approximately 7.50%.
2. Which companies are prominent players in the Occlusion Devices Industry?
Key companies in the market include Merit Medical Systems, Edwards Lifesciences Corporation, LeMaitre Vascular Inc , Terumo Corporation, Abbott Laboratories, BTG International Ltd, Medtronic PLC, Lepu Medical Technology, Johnson & Johnson, Stryker Corporation, Boston Scientific Corporation, Penumbra Inc.
3. What are the main segments of the Occlusion Devices Industry?
The market segments include Product, Application, End User.
4. Can you provide details about the market size?
The market size is estimated to be USD XX Million as of 2022.
5. What are some drivers contributing to market growth?
Rising Adoption of Minimally Invasive Surgeries; Increasing Geriatric Population and Rising Burden of Chronic Diseases; Technological Advancements.
6. What are the notable trends driving market growth?
Neurology Segment is Expected to Witness a Lucrative Growth.
7. Are there any restraints impacting market growth?
High Cost of the Products; Requirement of Skilled Professionals.
8. Can you provide examples of recent developments in the market?
June 2022: A fourth-generation flow diverter with Shield Technology, PipelineTM Vantage, was launched by India Medtronic Private Limited, a fully owned subsidiary of Medtronic PLC, for the endovascular treatment of brain aneurysms. The novel flow diverter called Pipeline Vantage with Shield Technology has improved design features for both the delivery system and the implant.
9. What pricing options are available for accessing the report?
Pricing options include single-user, multi-user, and enterprise licenses priced at USD 4750, USD 5250, and USD 8750 respectively.
10. Is the market size provided in terms of value or volume?
The market size is provided in terms of value, measured in Million and volume, measured in K Unit.
11. Are there any specific market keywords associated with the report?
Yes, the market keyword associated with the report is "Occlusion Devices Industry," which aids in identifying and referencing the specific market segment covered.
12. How do I determine which pricing option suits my needs best?
The pricing options vary based on user requirements and access needs. Individual users may opt for single-user licenses, while businesses requiring broader access may choose multi-user or enterprise licenses for cost-effective access to the report.
13. Are there any additional resources or data provided in the Occlusion Devices Industry report?
While the report offers comprehensive insights, it's advisable to review the specific contents or supplementary materials provided to ascertain if additional resources or data are available.
14. How can I stay updated on further developments or reports in the Occlusion Devices Industry?
To stay informed about further developments, trends, and reports in the Occlusion Devices Industry, consider subscribing to industry newsletters, following relevant companies and organizations, or regularly checking reputable industry news sources and publications.
Methodology
Step 1 - Identification of Relevant Samples Size from Population Database


Step 2 - Approaches for Defining Global Market Size (Value, Volume* & Price*)

Note*: In applicable scenarios
Step 3 - Data Sources
Primary Research
- Web Analytics
- Survey Reports
- Research Institute
- Latest Research Reports
- Opinion Leaders
Secondary Research
- Annual Reports
- White Paper
- Latest Press Release
- Industry Association
- Paid Database
- Investor Presentations

Step 4 - Data Triangulation
Involves using different sources of information in order to increase the validity of a study
These sources are likely to be stakeholders in a program - participants, other researchers, program staff, other community members, and so on.
Then we put all data in single framework & apply various statistical tools to find out the dynamic on the market.
During the analysis stage, feedback from the stakeholder groups would be compared to determine areas of agreement as well as areas of divergence
