

Key Insights
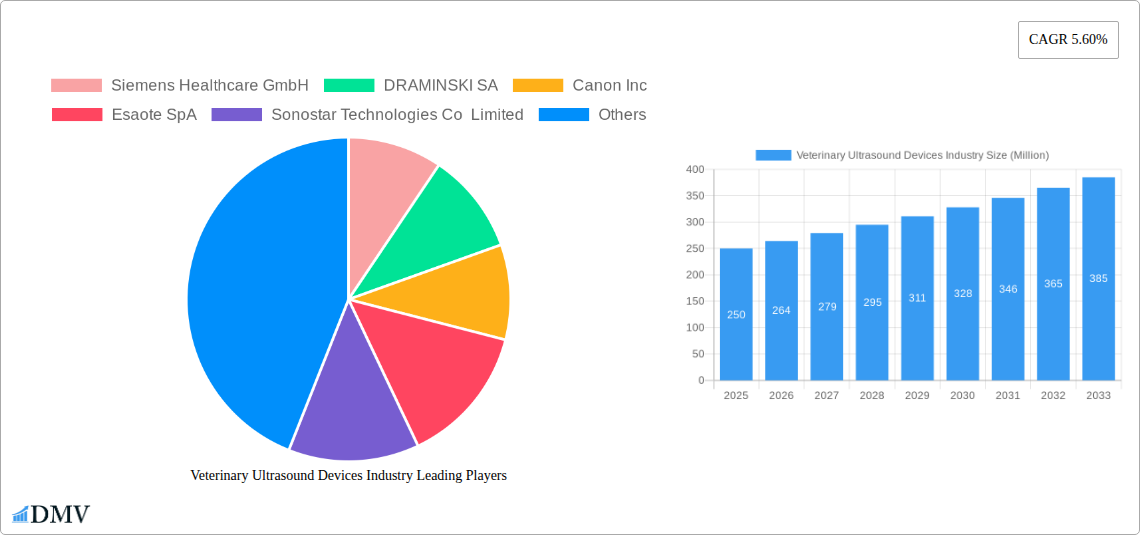
The veterinary ultrasound devices market, valued at approximately $XX million in 2025, is experiencing robust growth, projected to expand at a Compound Annual Growth Rate (CAGR) of 5.60% from 2025 to 2033. This growth is fueled by several key factors. Firstly, the increasing prevalence of companion animals globally and a rising pet owner willingness to invest in advanced diagnostic tools for their animals are driving demand. Secondly, technological advancements, such as the development of more portable, user-friendly, and cost-effective ultrasound scanners, are making this technology more accessible to veterinary clinics of all sizes, particularly in emerging markets. Furthermore, the expanding application of ultrasound in various veterinary specializations, including cardiology, oncology, and reproductive medicine, is significantly contributing to market expansion. The market segmentation reveals a strong preference for handheld/portable ultrasound scanners due to their convenience and affordability. While large animal ultrasound remains a significant segment, the growth of small animal veterinary practices is a primary driver of overall market expansion. Leading companies like Siemens Healthcare, Canon, and Mindray are investing heavily in research and development to improve image quality, enhance portability, and integrate advanced software features into their ultrasound systems, further stimulating market growth.
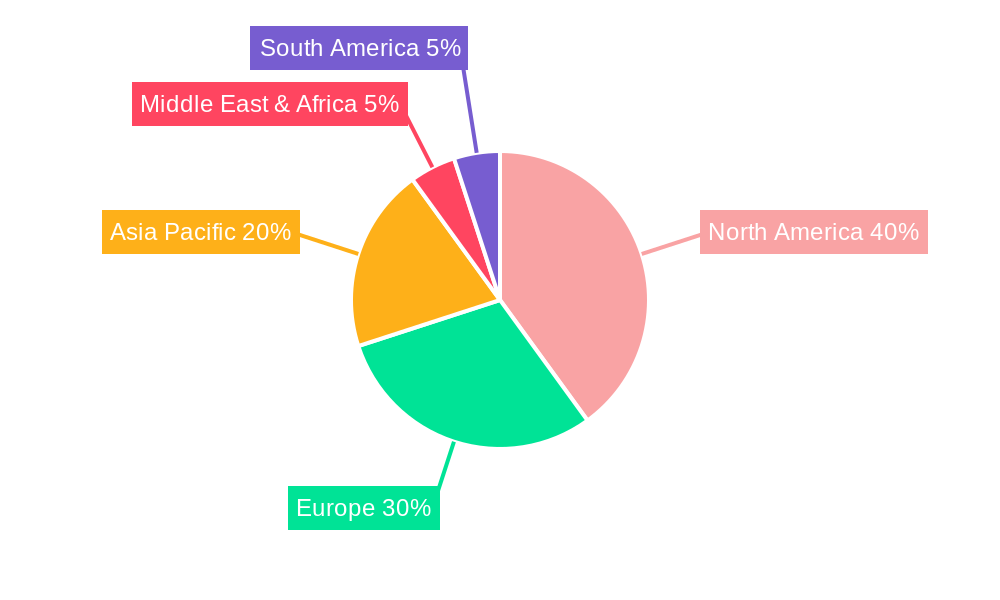
However, despite the positive outlook, certain restraints exist. The high initial investment cost associated with purchasing ultrasound equipment can pose a barrier, particularly for smaller veterinary clinics in developing regions. Furthermore, the need for skilled technicians and ongoing training for proper operation and interpretation of ultrasound images also presents a challenge. Regulatory hurdles and varying reimbursement policies across different geographical locations can also influence market penetration. Nonetheless, the overall market trajectory remains optimistic, driven by the ever-increasing demand for improved veterinary care and the continuous development of innovative and accessible ultrasound technologies. The market's regional distribution reflects the higher adoption rates in developed nations like North America and Europe, while emerging markets in Asia-Pacific and South America are anticipated to exhibit significant growth potential in the coming years.
Veterinary Ultrasound Devices Industry: A Comprehensive Market Report (2019-2033)
This insightful report provides a detailed analysis of the Veterinary Ultrasound Devices industry, offering a comprehensive overview of market trends, competitive landscape, and future growth projections. With a study period spanning 2019-2033, a base year of 2025, and a forecast period of 2025-2033, this report is an essential resource for stakeholders seeking to understand and capitalize on opportunities within this dynamic sector. The global market is projected to reach xx Million by 2033.
Veterinary Ultrasound Devices Industry Market Composition & Trends
The veterinary ultrasound devices market exhibits a moderately concentrated landscape, with key players such as Siemens Healthcare GmbH, DRAMINSKI SA, and Canon Inc. holding significant market share. Innovation is driven by advancements in imaging technology, portability, and user-friendliness, catering to the growing demand for efficient and accurate diagnostic tools. Regulatory landscapes vary across regions, influencing product approvals and market access. Substitute products, such as radiography, are available but often lack the non-invasive and detailed imaging capabilities of ultrasound. The end-user profile is primarily comprised of veterinary clinics, hospitals, and research institutions, with a growing segment of mobile veterinary services. Mergers and acquisitions (M&A) activity has been moderate, with deal values ranging from xx Million to xx Million in recent years, primarily focused on expanding product portfolios and market reach.
- Market Concentration: Moderately concentrated, with top players holding approximately xx% market share.
- Innovation Catalysts: Advancements in image processing, miniaturization, and AI integration.
- Regulatory Landscape: Varies significantly across geographies, impacting product approvals and market entry.
- Substitute Products: Radiography, but with limitations in detail and invasiveness.
- End-User Profile: Veterinary clinics, hospitals, research institutions, and mobile veterinary services.
- M&A Activity: Moderate, with deal values ranging from xx Million to xx Million in recent years.
Veterinary Ultrasound Devices Industry Industry Evolution
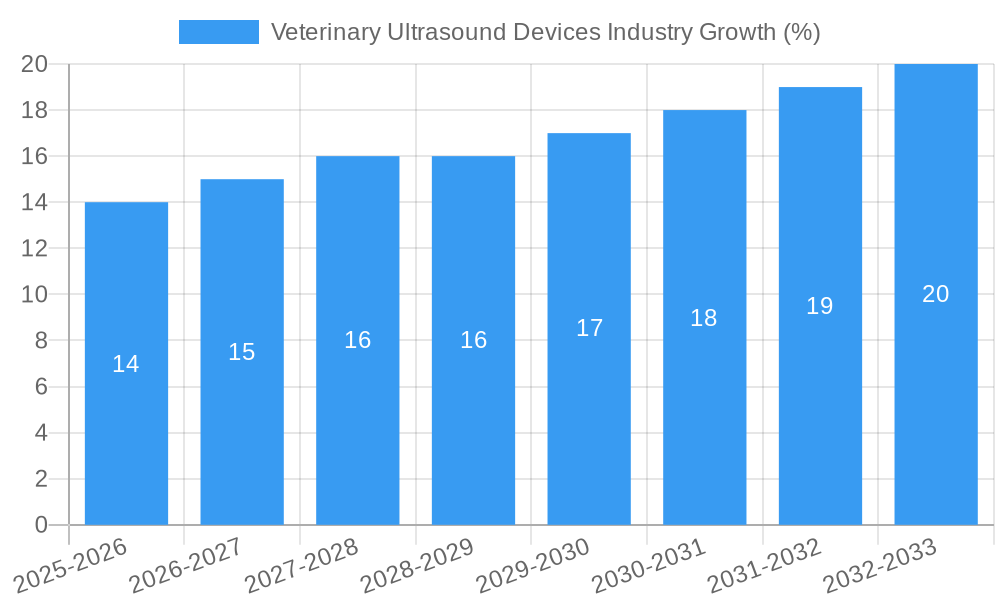
The veterinary ultrasound devices market has witnessed substantial growth over the historical period (2019-2024), driven by factors such as increasing pet ownership, rising awareness of animal health, and technological advancements. The market experienced a Compound Annual Growth Rate (CAGR) of xx% during this period. The forecast period (2025-2033) anticipates continued growth, albeit at a slightly moderated pace, projected at a CAGR of xx%, reaching xx Million by 2033. Technological advancements, such as the introduction of handheld and portable devices, are significantly impacting market dynamics. Consumer demand is shifting towards more user-friendly, cost-effective, and feature-rich systems. The adoption rate of veterinary ultrasound devices is increasing steadily, with a significant proportion of veterinary clinics now incorporating this technology into their standard diagnostic procedures. Improvements in image quality, coupled with the development of specialized software for specific animal types, are further bolstering market growth.
Leading Regions, Countries, or Segments in Veterinary Ultrasound Devices Industry
The North American market currently dominates the veterinary ultrasound devices industry, driven by high pet ownership rates, advanced veterinary infrastructure, and strong regulatory support for technological advancements. Within product segments, handheld (portable) ultrasound scanners are experiencing faster growth compared to cart-based systems, due to their enhanced portability and cost-effectiveness. The small animal segment (cats and dogs) continues to account for the largest share of the market due to higher pet ownership and veterinary care spending.
- Key Drivers in North America: High pet ownership, well-established veterinary infrastructure, significant investment in animal healthcare, and favorable regulatory environment.
- Handheld/Portable Scanner Dominance: Driven by portability, ease of use, and lower initial investment costs.
- Small Animal Segment Dominance: Driven by high pet ownership, increased veterinary visits, and greater affordability of procedures.
- Growth in Large Animal Segment: Driven by increased adoption in livestock farming and equine veterinary practices.
Veterinary Ultrasound Devices Industry Product Innovations
Recent innovations include the development of higher-resolution imaging capabilities, improved portability with smaller, lighter devices, and the integration of advanced software features such as automated measurements and image analysis. These advancements enhance diagnostic accuracy, improve workflow efficiency, and contribute to better patient care. Unique selling propositions include the incorporation of artificial intelligence (AI) for improved image interpretation and the development of specialized probes for specific anatomical applications.
Propelling Factors for Veterinary Ultrasound Devices Growth
Technological advancements in imaging technology, miniaturization, and user-friendliness are key drivers. Rising pet ownership and increasing disposable incomes in many regions contribute significantly. Furthermore, supportive regulatory frameworks that promote innovation and adoption of veterinary ultrasound technology are crucial. The growth of mobile veterinary services is also creating demand for portable ultrasound scanners.
Obstacles in the Veterinary Ultrasound Devices Industry Market
High initial costs associated with purchasing and maintaining the equipment can act as a barrier to adoption, especially for smaller veterinary clinics. Supply chain disruptions, particularly for critical components, can impact availability and pricing. Intense competition among established players and new entrants also poses a challenge.
Future Opportunities in Veterinary Ultrasound Devices Industry
Emerging opportunities include expansion into developing markets with growing pet ownership and veterinary infrastructure. The integration of AI and machine learning offers significant potential for enhancing image analysis and diagnostic accuracy. The development of specialized probes and software for specific animal types, such as exotic animals, will continue to drive market expansion.
Major Players in the Veterinary Ultrasound Devices Industry Ecosystem
- Siemens Healthcare GmbH
- DRAMINSKI SA
- Canon Inc
- Esaote SpA
- Sonostar Technologies Co Limited
- Samsung Medison Co Ltd
- IMV Imaging
- Shenzhen Mindray Bio-Medical Electronics Co Ltd
- Fujifilm Holdings Corporation
Key Developments in Veterinary Ultrasound Devices Industry
- November 2022: Advanced Veterinary Ultrasound (AVU) partners with Draminski SA to distribute portable ultrasound systems.
- August 2022: GM Medical partners with Butterfly Network to distribute iQ+ Vet in Scandinavia.
Strategic Veterinary Ultrasound Devices Industry Market Forecast
The veterinary ultrasound devices market is poised for continued growth driven by technological advancements, rising pet ownership, and increasing demand for advanced diagnostic tools. The focus on portability, affordability, and user-friendly features will shape future market dynamics. Expansion into new markets and the integration of AI and machine learning will unlock significant growth potential.
Veterinary Ultrasound Devices Industry Segmentation
-
1. Product
- 1.1. Handheld (Portable) Ultrasound Scanner
- 1.2. Cart-based Ultrasound Scanner
-
2. Animal Type
- 2.1. Small Animals
- 2.2. Large Animals
Veterinary Ultrasound Devices Industry Segmentation By Geography
-
1. North America
- 1.1. United States
- 1.2. Canada
- 1.3. Mexico
-
2. Europe
- 2.1. Germany
- 2.2. United Kingdom
- 2.3. France
- 2.4. Italy
- 2.5. Spain
- 2.6. Rest of Europe
-
3. Asia Pacific
- 3.1. China
- 3.2. Japan
- 3.3. India
- 3.4. Australia
- 3.5. South Korea
- 3.6. Rest of Asia Pacific
- 4. Middle East
-
5. GCC
- 5.1. South Africa
- 5.2. Rest of Middle East
-
6. South America
- 6.1. Brazil
- 6.2. Argentina
- 6.3. Rest of South America
Veterinary Ultrasound Devices Industry REPORT HIGHLIGHTS
| Aspects | Details |
|---|---|
| Study Period | 2019-2033 |
| Base Year | 2024 |
| Estimated Year | 2025 |
| Forecast Period | 2025-2033 |
| Historical Period | 2019-2024 |
| Growth Rate | CAGR of 5.60% from 2019-2033 |
| Segmentation |
|
Table of Contents
- 1. Introduction
- 1.1. Research Scope
- 1.2. Market Segmentation
- 1.3. Research Methodology
- 1.4. Definitions and Assumptions
- 2. Executive Summary
- 2.1. Introduction
- 3. Market Dynamics
- 3.1. Introduction
- 3.2. Market Drivers
- 3.2.1. Increase in Animal Adoption and Animal Health Expenditure; Rise in Demand for Diagnosis of Animal Health Conditions and Technological Advancements
- 3.3. Market Restrains
- 3.3.1. Lack of Skilled Personnel; High Cost of the Devices
- 3.4. Market Trends
- 3.4.1. Small Animals Segment is Expected to Witness a Healthy CAGR Over the Forecast Period
- 4. Market Factor Analysis
- 4.1. Porters Five Forces
- 4.2. Supply/Value Chain
- 4.3. PESTEL analysis
- 4.4. Market Entropy
- 4.5. Patent/Trademark Analysis
- 5. Global Veterinary Ultrasound Devices Industry Analysis, Insights and Forecast, 2019-2031
- 5.1. Market Analysis, Insights and Forecast - by Product
- 5.1.1. Handheld (Portable) Ultrasound Scanner
- 5.1.2. Cart-based Ultrasound Scanner
- 5.2. Market Analysis, Insights and Forecast - by Animal Type
- 5.2.1. Small Animals
- 5.2.2. Large Animals
- 5.3. Market Analysis, Insights and Forecast - by Region
- 5.3.1. North America
- 5.3.2. Europe
- 5.3.3. Asia Pacific
- 5.3.4. Middle East
- 5.3.5. GCC
- 5.3.6. South America
- 5.1. Market Analysis, Insights and Forecast - by Product
- 6. North America Veterinary Ultrasound Devices Industry Analysis, Insights and Forecast, 2019-2031
- 6.1. Market Analysis, Insights and Forecast - by Product
- 6.1.1. Handheld (Portable) Ultrasound Scanner
- 6.1.2. Cart-based Ultrasound Scanner
- 6.2. Market Analysis, Insights and Forecast - by Animal Type
- 6.2.1. Small Animals
- 6.2.2. Large Animals
- 6.1. Market Analysis, Insights and Forecast - by Product
- 7. Europe Veterinary Ultrasound Devices Industry Analysis, Insights and Forecast, 2019-2031
- 7.1. Market Analysis, Insights and Forecast - by Product
- 7.1.1. Handheld (Portable) Ultrasound Scanner
- 7.1.2. Cart-based Ultrasound Scanner
- 7.2. Market Analysis, Insights and Forecast - by Animal Type
- 7.2.1. Small Animals
- 7.2.2. Large Animals
- 7.1. Market Analysis, Insights and Forecast - by Product
- 8. Asia Pacific Veterinary Ultrasound Devices Industry Analysis, Insights and Forecast, 2019-2031
- 8.1. Market Analysis, Insights and Forecast - by Product
- 8.1.1. Handheld (Portable) Ultrasound Scanner
- 8.1.2. Cart-based Ultrasound Scanner
- 8.2. Market Analysis, Insights and Forecast - by Animal Type
- 8.2.1. Small Animals
- 8.2.2. Large Animals
- 8.1. Market Analysis, Insights and Forecast - by Product
- 9. Middle East Veterinary Ultrasound Devices Industry Analysis, Insights and Forecast, 2019-2031
- 9.1. Market Analysis, Insights and Forecast - by Product
- 9.1.1. Handheld (Portable) Ultrasound Scanner
- 9.1.2. Cart-based Ultrasound Scanner
- 9.2. Market Analysis, Insights and Forecast - by Animal Type
- 9.2.1. Small Animals
- 9.2.2. Large Animals
- 9.1. Market Analysis, Insights and Forecast - by Product
- 10. GCC Veterinary Ultrasound Devices Industry Analysis, Insights and Forecast, 2019-2031
- 10.1. Market Analysis, Insights and Forecast - by Product
- 10.1.1. Handheld (Portable) Ultrasound Scanner
- 10.1.2. Cart-based Ultrasound Scanner
- 10.2. Market Analysis, Insights and Forecast - by Animal Type
- 10.2.1. Small Animals
- 10.2.2. Large Animals
- 10.1. Market Analysis, Insights and Forecast - by Product
- 11. South America Veterinary Ultrasound Devices Industry Analysis, Insights and Forecast, 2019-2031
- 11.1. Market Analysis, Insights and Forecast - by Product
- 11.1.1. Handheld (Portable) Ultrasound Scanner
- 11.1.2. Cart-based Ultrasound Scanner
- 11.2. Market Analysis, Insights and Forecast - by Animal Type
- 11.2.1. Small Animals
- 11.2.2. Large Animals
- 11.1. Market Analysis, Insights and Forecast - by Product
- 12. North America Veterinary Ultrasound Devices Industry Analysis, Insights and Forecast, 2019-2031
- 12.1. Market Analysis, Insights and Forecast - By Country/Sub-region
- 12.1.1 United States
- 12.1.2 Canada
- 12.1.3 Mexico
- 13. Europe Veterinary Ultrasound Devices Industry Analysis, Insights and Forecast, 2019-2031
- 13.1. Market Analysis, Insights and Forecast - By Country/Sub-region
- 13.1.1 Germany
- 13.1.2 United Kingdom
- 13.1.3 France
- 13.1.4 Italy
- 13.1.5 Spain
- 13.1.6 Rest of Europe
- 14. Asia Pacific Veterinary Ultrasound Devices Industry Analysis, Insights and Forecast, 2019-2031
- 14.1. Market Analysis, Insights and Forecast - By Country/Sub-region
- 14.1.1 China
- 14.1.2 Japan
- 14.1.3 India
- 14.1.4 Australia
- 14.1.5 South Korea
- 14.1.6 Rest of Asia Pacific
- 15. Middle East Veterinary Ultrasound Devices Industry Analysis, Insights and Forecast, 2019-2031
- 15.1. Market Analysis, Insights and Forecast - By Country/Sub-region
- 15.1.1 GCC
- 15.1.2 South Africa
- 15.1.3 Rest of Middle East
- 16. South America Veterinary Ultrasound Devices Industry Analysis, Insights and Forecast, 2019-2031
- 16.1. Market Analysis, Insights and Forecast - By Country/Sub-region
- 16.1.1 Brazil
- 16.1.2 Argentina
- 16.1.3 Rest of South America
- 17. Competitive Analysis
- 17.1. Global Market Share Analysis 2024
- 17.2. Company Profiles
- 17.2.1 Siemens Healthcare GmbH
- 17.2.1.1. Overview
- 17.2.1.2. Products
- 17.2.1.3. SWOT Analysis
- 17.2.1.4. Recent Developments
- 17.2.1.5. Financials (Based on Availability)
- 17.2.2 DRAMINSKI SA
- 17.2.2.1. Overview
- 17.2.2.2. Products
- 17.2.2.3. SWOT Analysis
- 17.2.2.4. Recent Developments
- 17.2.2.5. Financials (Based on Availability)
- 17.2.3 Canon Inc
- 17.2.3.1. Overview
- 17.2.3.2. Products
- 17.2.3.3. SWOT Analysis
- 17.2.3.4. Recent Developments
- 17.2.3.5. Financials (Based on Availability)
- 17.2.4 Esaote SpA
- 17.2.4.1. Overview
- 17.2.4.2. Products
- 17.2.4.3. SWOT Analysis
- 17.2.4.4. Recent Developments
- 17.2.4.5. Financials (Based on Availability)
- 17.2.5 Sonostar Technologies Co Limited
- 17.2.5.1. Overview
- 17.2.5.2. Products
- 17.2.5.3. SWOT Analysis
- 17.2.5.4. Recent Developments
- 17.2.5.5. Financials (Based on Availability)
- 17.2.6 Samsung Medison Co Ltd
- 17.2.6.1. Overview
- 17.2.6.2. Products
- 17.2.6.3. SWOT Analysis
- 17.2.6.4. Recent Developments
- 17.2.6.5. Financials (Based on Availability)
- 17.2.7 IMV Imaging
- 17.2.7.1. Overview
- 17.2.7.2. Products
- 17.2.7.3. SWOT Analysis
- 17.2.7.4. Recent Developments
- 17.2.7.5. Financials (Based on Availability)
- 17.2.8 Shenzhen Mindray Bio-Medical Electronics Co Ltd
- 17.2.8.1. Overview
- 17.2.8.2. Products
- 17.2.8.3. SWOT Analysis
- 17.2.8.4. Recent Developments
- 17.2.8.5. Financials (Based on Availability)
- 17.2.9 Fujifilm Holdings Corporation
- 17.2.9.1. Overview
- 17.2.9.2. Products
- 17.2.9.3. SWOT Analysis
- 17.2.9.4. Recent Developments
- 17.2.9.5. Financials (Based on Availability)
- 17.2.1 Siemens Healthcare GmbH
List of Figures
- Figure 1: Global Veterinary Ultrasound Devices Industry Revenue Breakdown (Million, %) by Region 2024 & 2032
- Figure 2: Global Veterinary Ultrasound Devices Industry Volume Breakdown (K Units, %) by Region 2024 & 2032
- Figure 3: North America Veterinary Ultrasound Devices Industry Revenue (Million), by Country 2024 & 2032
- Figure 4: North America Veterinary Ultrasound Devices Industry Volume (K Units), by Country 2024 & 2032
- Figure 5: North America Veterinary Ultrasound Devices Industry Revenue Share (%), by Country 2024 & 2032
- Figure 6: North America Veterinary Ultrasound Devices Industry Volume Share (%), by Country 2024 & 2032
- Figure 7: Europe Veterinary Ultrasound Devices Industry Revenue (Million), by Country 2024 & 2032
- Figure 8: Europe Veterinary Ultrasound Devices Industry Volume (K Units), by Country 2024 & 2032
- Figure 9: Europe Veterinary Ultrasound Devices Industry Revenue Share (%), by Country 2024 & 2032
- Figure 10: Europe Veterinary Ultrasound Devices Industry Volume Share (%), by Country 2024 & 2032
- Figure 11: Asia Pacific Veterinary Ultrasound Devices Industry Revenue (Million), by Country 2024 & 2032
- Figure 12: Asia Pacific Veterinary Ultrasound Devices Industry Volume (K Units), by Country 2024 & 2032
- Figure 13: Asia Pacific Veterinary Ultrasound Devices Industry Revenue Share (%), by Country 2024 & 2032
- Figure 14: Asia Pacific Veterinary Ultrasound Devices Industry Volume Share (%), by Country 2024 & 2032
- Figure 15: Middle East Veterinary Ultrasound Devices Industry Revenue (Million), by Country 2024 & 2032
- Figure 16: Middle East Veterinary Ultrasound Devices Industry Volume (K Units), by Country 2024 & 2032
- Figure 17: Middle East Veterinary Ultrasound Devices Industry Revenue Share (%), by Country 2024 & 2032
- Figure 18: Middle East Veterinary Ultrasound Devices Industry Volume Share (%), by Country 2024 & 2032
- Figure 19: South America Veterinary Ultrasound Devices Industry Revenue (Million), by Country 2024 & 2032
- Figure 20: South America Veterinary Ultrasound Devices Industry Volume (K Units), by Country 2024 & 2032
- Figure 21: South America Veterinary Ultrasound Devices Industry Revenue Share (%), by Country 2024 & 2032
- Figure 22: South America Veterinary Ultrasound Devices Industry Volume Share (%), by Country 2024 & 2032
- Figure 23: North America Veterinary Ultrasound Devices Industry Revenue (Million), by Product 2024 & 2032
- Figure 24: North America Veterinary Ultrasound Devices Industry Volume (K Units), by Product 2024 & 2032
- Figure 25: North America Veterinary Ultrasound Devices Industry Revenue Share (%), by Product 2024 & 2032
- Figure 26: North America Veterinary Ultrasound Devices Industry Volume Share (%), by Product 2024 & 2032
- Figure 27: North America Veterinary Ultrasound Devices Industry Revenue (Million), by Animal Type 2024 & 2032
- Figure 28: North America Veterinary Ultrasound Devices Industry Volume (K Units), by Animal Type 2024 & 2032
- Figure 29: North America Veterinary Ultrasound Devices Industry Revenue Share (%), by Animal Type 2024 & 2032
- Figure 30: North America Veterinary Ultrasound Devices Industry Volume Share (%), by Animal Type 2024 & 2032
- Figure 31: North America Veterinary Ultrasound Devices Industry Revenue (Million), by Country 2024 & 2032
- Figure 32: North America Veterinary Ultrasound Devices Industry Volume (K Units), by Country 2024 & 2032
- Figure 33: North America Veterinary Ultrasound Devices Industry Revenue Share (%), by Country 2024 & 2032
- Figure 34: North America Veterinary Ultrasound Devices Industry Volume Share (%), by Country 2024 & 2032
- Figure 35: Europe Veterinary Ultrasound Devices Industry Revenue (Million), by Product 2024 & 2032
- Figure 36: Europe Veterinary Ultrasound Devices Industry Volume (K Units), by Product 2024 & 2032
- Figure 37: Europe Veterinary Ultrasound Devices Industry Revenue Share (%), by Product 2024 & 2032
- Figure 38: Europe Veterinary Ultrasound Devices Industry Volume Share (%), by Product 2024 & 2032
- Figure 39: Europe Veterinary Ultrasound Devices Industry Revenue (Million), by Animal Type 2024 & 2032
- Figure 40: Europe Veterinary Ultrasound Devices Industry Volume (K Units), by Animal Type 2024 & 2032
- Figure 41: Europe Veterinary Ultrasound Devices Industry Revenue Share (%), by Animal Type 2024 & 2032
- Figure 42: Europe Veterinary Ultrasound Devices Industry Volume Share (%), by Animal Type 2024 & 2032
- Figure 43: Europe Veterinary Ultrasound Devices Industry Revenue (Million), by Country 2024 & 2032
- Figure 44: Europe Veterinary Ultrasound Devices Industry Volume (K Units), by Country 2024 & 2032
- Figure 45: Europe Veterinary Ultrasound Devices Industry Revenue Share (%), by Country 2024 & 2032
- Figure 46: Europe Veterinary Ultrasound Devices Industry Volume Share (%), by Country 2024 & 2032
- Figure 47: Asia Pacific Veterinary Ultrasound Devices Industry Revenue (Million), by Product 2024 & 2032
- Figure 48: Asia Pacific Veterinary Ultrasound Devices Industry Volume (K Units), by Product 2024 & 2032
- Figure 49: Asia Pacific Veterinary Ultrasound Devices Industry Revenue Share (%), by Product 2024 & 2032
- Figure 50: Asia Pacific Veterinary Ultrasound Devices Industry Volume Share (%), by Product 2024 & 2032
- Figure 51: Asia Pacific Veterinary Ultrasound Devices Industry Revenue (Million), by Animal Type 2024 & 2032
- Figure 52: Asia Pacific Veterinary Ultrasound Devices Industry Volume (K Units), by Animal Type 2024 & 2032
- Figure 53: Asia Pacific Veterinary Ultrasound Devices Industry Revenue Share (%), by Animal Type 2024 & 2032
- Figure 54: Asia Pacific Veterinary Ultrasound Devices Industry Volume Share (%), by Animal Type 2024 & 2032
- Figure 55: Asia Pacific Veterinary Ultrasound Devices Industry Revenue (Million), by Country 2024 & 2032
- Figure 56: Asia Pacific Veterinary Ultrasound Devices Industry Volume (K Units), by Country 2024 & 2032
- Figure 57: Asia Pacific Veterinary Ultrasound Devices Industry Revenue Share (%), by Country 2024 & 2032
- Figure 58: Asia Pacific Veterinary Ultrasound Devices Industry Volume Share (%), by Country 2024 & 2032
- Figure 59: Middle East Veterinary Ultrasound Devices Industry Revenue (Million), by Product 2024 & 2032
- Figure 60: Middle East Veterinary Ultrasound Devices Industry Volume (K Units), by Product 2024 & 2032
- Figure 61: Middle East Veterinary Ultrasound Devices Industry Revenue Share (%), by Product 2024 & 2032
- Figure 62: Middle East Veterinary Ultrasound Devices Industry Volume Share (%), by Product 2024 & 2032
- Figure 63: Middle East Veterinary Ultrasound Devices Industry Revenue (Million), by Animal Type 2024 & 2032
- Figure 64: Middle East Veterinary Ultrasound Devices Industry Volume (K Units), by Animal Type 2024 & 2032
- Figure 65: Middle East Veterinary Ultrasound Devices Industry Revenue Share (%), by Animal Type 2024 & 2032
- Figure 66: Middle East Veterinary Ultrasound Devices Industry Volume Share (%), by Animal Type 2024 & 2032
- Figure 67: Middle East Veterinary Ultrasound Devices Industry Revenue (Million), by Country 2024 & 2032
- Figure 68: Middle East Veterinary Ultrasound Devices Industry Volume (K Units), by Country 2024 & 2032
- Figure 69: Middle East Veterinary Ultrasound Devices Industry Revenue Share (%), by Country 2024 & 2032
- Figure 70: Middle East Veterinary Ultrasound Devices Industry Volume Share (%), by Country 2024 & 2032
- Figure 71: GCC Veterinary Ultrasound Devices Industry Revenue (Million), by Product 2024 & 2032
- Figure 72: GCC Veterinary Ultrasound Devices Industry Volume (K Units), by Product 2024 & 2032
- Figure 73: GCC Veterinary Ultrasound Devices Industry Revenue Share (%), by Product 2024 & 2032
- Figure 74: GCC Veterinary Ultrasound Devices Industry Volume Share (%), by Product 2024 & 2032
- Figure 75: GCC Veterinary Ultrasound Devices Industry Revenue (Million), by Animal Type 2024 & 2032
- Figure 76: GCC Veterinary Ultrasound Devices Industry Volume (K Units), by Animal Type 2024 & 2032
- Figure 77: GCC Veterinary Ultrasound Devices Industry Revenue Share (%), by Animal Type 2024 & 2032
- Figure 78: GCC Veterinary Ultrasound Devices Industry Volume Share (%), by Animal Type 2024 & 2032
- Figure 79: GCC Veterinary Ultrasound Devices Industry Revenue (Million), by Country 2024 & 2032
- Figure 80: GCC Veterinary Ultrasound Devices Industry Volume (K Units), by Country 2024 & 2032
- Figure 81: GCC Veterinary Ultrasound Devices Industry Revenue Share (%), by Country 2024 & 2032
- Figure 82: GCC Veterinary Ultrasound Devices Industry Volume Share (%), by Country 2024 & 2032
- Figure 83: South America Veterinary Ultrasound Devices Industry Revenue (Million), by Product 2024 & 2032
- Figure 84: South America Veterinary Ultrasound Devices Industry Volume (K Units), by Product 2024 & 2032
- Figure 85: South America Veterinary Ultrasound Devices Industry Revenue Share (%), by Product 2024 & 2032
- Figure 86: South America Veterinary Ultrasound Devices Industry Volume Share (%), by Product 2024 & 2032
- Figure 87: South America Veterinary Ultrasound Devices Industry Revenue (Million), by Animal Type 2024 & 2032
- Figure 88: South America Veterinary Ultrasound Devices Industry Volume (K Units), by Animal Type 2024 & 2032
- Figure 89: South America Veterinary Ultrasound Devices Industry Revenue Share (%), by Animal Type 2024 & 2032
- Figure 90: South America Veterinary Ultrasound Devices Industry Volume Share (%), by Animal Type 2024 & 2032
- Figure 91: South America Veterinary Ultrasound Devices Industry Revenue (Million), by Country 2024 & 2032
- Figure 92: South America Veterinary Ultrasound Devices Industry Volume (K Units), by Country 2024 & 2032
- Figure 93: South America Veterinary Ultrasound Devices Industry Revenue Share (%), by Country 2024 & 2032
- Figure 94: South America Veterinary Ultrasound Devices Industry Volume Share (%), by Country 2024 & 2032
List of Tables
- Table 1: Global Veterinary Ultrasound Devices Industry Revenue Million Forecast, by Region 2019 & 2032
- Table 2: Global Veterinary Ultrasound Devices Industry Volume K Units Forecast, by Region 2019 & 2032
- Table 3: Global Veterinary Ultrasound Devices Industry Revenue Million Forecast, by Product 2019 & 2032
- Table 4: Global Veterinary Ultrasound Devices Industry Volume K Units Forecast, by Product 2019 & 2032
- Table 5: Global Veterinary Ultrasound Devices Industry Revenue Million Forecast, by Animal Type 2019 & 2032
- Table 6: Global Veterinary Ultrasound Devices Industry Volume K Units Forecast, by Animal Type 2019 & 2032
- Table 7: Global Veterinary Ultrasound Devices Industry Revenue Million Forecast, by Region 2019 & 2032
- Table 8: Global Veterinary Ultrasound Devices Industry Volume K Units Forecast, by Region 2019 & 2032
- Table 9: Global Veterinary Ultrasound Devices Industry Revenue Million Forecast, by Country 2019 & 2032
- Table 10: Global Veterinary Ultrasound Devices Industry Volume K Units Forecast, by Country 2019 & 2032
- Table 11: United States Veterinary Ultrasound Devices Industry Revenue (Million) Forecast, by Application 2019 & 2032
- Table 12: United States Veterinary Ultrasound Devices Industry Volume (K Units) Forecast, by Application 2019 & 2032
- Table 13: Canada Veterinary Ultrasound Devices Industry Revenue (Million) Forecast, by Application 2019 & 2032
- Table 14: Canada Veterinary Ultrasound Devices Industry Volume (K Units) Forecast, by Application 2019 & 2032
- Table 15: Mexico Veterinary Ultrasound Devices Industry Revenue (Million) Forecast, by Application 2019 & 2032
- Table 16: Mexico Veterinary Ultrasound Devices Industry Volume (K Units) Forecast, by Application 2019 & 2032
- Table 17: Global Veterinary Ultrasound Devices Industry Revenue Million Forecast, by Country 2019 & 2032
- Table 18: Global Veterinary Ultrasound Devices Industry Volume K Units Forecast, by Country 2019 & 2032
- Table 19: Germany Veterinary Ultrasound Devices Industry Revenue (Million) Forecast, by Application 2019 & 2032
- Table 20: Germany Veterinary Ultrasound Devices Industry Volume (K Units) Forecast, by Application 2019 & 2032
- Table 21: United Kingdom Veterinary Ultrasound Devices Industry Revenue (Million) Forecast, by Application 2019 & 2032
- Table 22: United Kingdom Veterinary Ultrasound Devices Industry Volume (K Units) Forecast, by Application 2019 & 2032
- Table 23: France Veterinary Ultrasound Devices Industry Revenue (Million) Forecast, by Application 2019 & 2032
- Table 24: France Veterinary Ultrasound Devices Industry Volume (K Units) Forecast, by Application 2019 & 2032
- Table 25: Italy Veterinary Ultrasound Devices Industry Revenue (Million) Forecast, by Application 2019 & 2032
- Table 26: Italy Veterinary Ultrasound Devices Industry Volume (K Units) Forecast, by Application 2019 & 2032
- Table 27: Spain Veterinary Ultrasound Devices Industry Revenue (Million) Forecast, by Application 2019 & 2032
- Table 28: Spain Veterinary Ultrasound Devices Industry Volume (K Units) Forecast, by Application 2019 & 2032
- Table 29: Rest of Europe Veterinary Ultrasound Devices Industry Revenue (Million) Forecast, by Application 2019 & 2032
- Table 30: Rest of Europe Veterinary Ultrasound Devices Industry Volume (K Units) Forecast, by Application 2019 & 2032
- Table 31: Global Veterinary Ultrasound Devices Industry Revenue Million Forecast, by Country 2019 & 2032
- Table 32: Global Veterinary Ultrasound Devices Industry Volume K Units Forecast, by Country 2019 & 2032
- Table 33: China Veterinary Ultrasound Devices Industry Revenue (Million) Forecast, by Application 2019 & 2032
- Table 34: China Veterinary Ultrasound Devices Industry Volume (K Units) Forecast, by Application 2019 & 2032
- Table 35: Japan Veterinary Ultrasound Devices Industry Revenue (Million) Forecast, by Application 2019 & 2032
- Table 36: Japan Veterinary Ultrasound Devices Industry Volume (K Units) Forecast, by Application 2019 & 2032
- Table 37: India Veterinary Ultrasound Devices Industry Revenue (Million) Forecast, by Application 2019 & 2032
- Table 38: India Veterinary Ultrasound Devices Industry Volume (K Units) Forecast, by Application 2019 & 2032
- Table 39: Australia Veterinary Ultrasound Devices Industry Revenue (Million) Forecast, by Application 2019 & 2032
- Table 40: Australia Veterinary Ultrasound Devices Industry Volume (K Units) Forecast, by Application 2019 & 2032
- Table 41: South Korea Veterinary Ultrasound Devices Industry Revenue (Million) Forecast, by Application 2019 & 2032
- Table 42: South Korea Veterinary Ultrasound Devices Industry Volume (K Units) Forecast, by Application 2019 & 2032
- Table 43: Rest of Asia Pacific Veterinary Ultrasound Devices Industry Revenue (Million) Forecast, by Application 2019 & 2032
- Table 44: Rest of Asia Pacific Veterinary Ultrasound Devices Industry Volume (K Units) Forecast, by Application 2019 & 2032
- Table 45: Global Veterinary Ultrasound Devices Industry Revenue Million Forecast, by Country 2019 & 2032
- Table 46: Global Veterinary Ultrasound Devices Industry Volume K Units Forecast, by Country 2019 & 2032
- Table 47: GCC Veterinary Ultrasound Devices Industry Revenue (Million) Forecast, by Application 2019 & 2032
- Table 48: GCC Veterinary Ultrasound Devices Industry Volume (K Units) Forecast, by Application 2019 & 2032
- Table 49: South Africa Veterinary Ultrasound Devices Industry Revenue (Million) Forecast, by Application 2019 & 2032
- Table 50: South Africa Veterinary Ultrasound Devices Industry Volume (K Units) Forecast, by Application 2019 & 2032
- Table 51: Rest of Middle East Veterinary Ultrasound Devices Industry Revenue (Million) Forecast, by Application 2019 & 2032
- Table 52: Rest of Middle East Veterinary Ultrasound Devices Industry Volume (K Units) Forecast, by Application 2019 & 2032
- Table 53: Global Veterinary Ultrasound Devices Industry Revenue Million Forecast, by Country 2019 & 2032
- Table 54: Global Veterinary Ultrasound Devices Industry Volume K Units Forecast, by Country 2019 & 2032
- Table 55: Brazil Veterinary Ultrasound Devices Industry Revenue (Million) Forecast, by Application 2019 & 2032
- Table 56: Brazil Veterinary Ultrasound Devices Industry Volume (K Units) Forecast, by Application 2019 & 2032
- Table 57: Argentina Veterinary Ultrasound Devices Industry Revenue (Million) Forecast, by Application 2019 & 2032
- Table 58: Argentina Veterinary Ultrasound Devices Industry Volume (K Units) Forecast, by Application 2019 & 2032
- Table 59: Rest of South America Veterinary Ultrasound Devices Industry Revenue (Million) Forecast, by Application 2019 & 2032
- Table 60: Rest of South America Veterinary Ultrasound Devices Industry Volume (K Units) Forecast, by Application 2019 & 2032
- Table 61: Global Veterinary Ultrasound Devices Industry Revenue Million Forecast, by Product 2019 & 2032
- Table 62: Global Veterinary Ultrasound Devices Industry Volume K Units Forecast, by Product 2019 & 2032
- Table 63: Global Veterinary Ultrasound Devices Industry Revenue Million Forecast, by Animal Type 2019 & 2032
- Table 64: Global Veterinary Ultrasound Devices Industry Volume K Units Forecast, by Animal Type 2019 & 2032
- Table 65: Global Veterinary Ultrasound Devices Industry Revenue Million Forecast, by Country 2019 & 2032
- Table 66: Global Veterinary Ultrasound Devices Industry Volume K Units Forecast, by Country 2019 & 2032
- Table 67: United States Veterinary Ultrasound Devices Industry Revenue (Million) Forecast, by Application 2019 & 2032
- Table 68: United States Veterinary Ultrasound Devices Industry Volume (K Units) Forecast, by Application 2019 & 2032
- Table 69: Canada Veterinary Ultrasound Devices Industry Revenue (Million) Forecast, by Application 2019 & 2032
- Table 70: Canada Veterinary Ultrasound Devices Industry Volume (K Units) Forecast, by Application 2019 & 2032
- Table 71: Mexico Veterinary Ultrasound Devices Industry Revenue (Million) Forecast, by Application 2019 & 2032
- Table 72: Mexico Veterinary Ultrasound Devices Industry Volume (K Units) Forecast, by Application 2019 & 2032
- Table 73: Global Veterinary Ultrasound Devices Industry Revenue Million Forecast, by Product 2019 & 2032
- Table 74: Global Veterinary Ultrasound Devices Industry Volume K Units Forecast, by Product 2019 & 2032
- Table 75: Global Veterinary Ultrasound Devices Industry Revenue Million Forecast, by Animal Type 2019 & 2032
- Table 76: Global Veterinary Ultrasound Devices Industry Volume K Units Forecast, by Animal Type 2019 & 2032
- Table 77: Global Veterinary Ultrasound Devices Industry Revenue Million Forecast, by Country 2019 & 2032
- Table 78: Global Veterinary Ultrasound Devices Industry Volume K Units Forecast, by Country 2019 & 2032
- Table 79: Germany Veterinary Ultrasound Devices Industry Revenue (Million) Forecast, by Application 2019 & 2032
- Table 80: Germany Veterinary Ultrasound Devices Industry Volume (K Units) Forecast, by Application 2019 & 2032
- Table 81: United Kingdom Veterinary Ultrasound Devices Industry Revenue (Million) Forecast, by Application 2019 & 2032
- Table 82: United Kingdom Veterinary Ultrasound Devices Industry Volume (K Units) Forecast, by Application 2019 & 2032
- Table 83: France Veterinary Ultrasound Devices Industry Revenue (Million) Forecast, by Application 2019 & 2032
- Table 84: France Veterinary Ultrasound Devices Industry Volume (K Units) Forecast, by Application 2019 & 2032
- Table 85: Italy Veterinary Ultrasound Devices Industry Revenue (Million) Forecast, by Application 2019 & 2032
- Table 86: Italy Veterinary Ultrasound Devices Industry Volume (K Units) Forecast, by Application 2019 & 2032
- Table 87: Spain Veterinary Ultrasound Devices Industry Revenue (Million) Forecast, by Application 2019 & 2032
- Table 88: Spain Veterinary Ultrasound Devices Industry Volume (K Units) Forecast, by Application 2019 & 2032
- Table 89: Rest of Europe Veterinary Ultrasound Devices Industry Revenue (Million) Forecast, by Application 2019 & 2032
- Table 90: Rest of Europe Veterinary Ultrasound Devices Industry Volume (K Units) Forecast, by Application 2019 & 2032
- Table 91: Global Veterinary Ultrasound Devices Industry Revenue Million Forecast, by Product 2019 & 2032
- Table 92: Global Veterinary Ultrasound Devices Industry Volume K Units Forecast, by Product 2019 & 2032
- Table 93: Global Veterinary Ultrasound Devices Industry Revenue Million Forecast, by Animal Type 2019 & 2032
- Table 94: Global Veterinary Ultrasound Devices Industry Volume K Units Forecast, by Animal Type 2019 & 2032
- Table 95: Global Veterinary Ultrasound Devices Industry Revenue Million Forecast, by Country 2019 & 2032
- Table 96: Global Veterinary Ultrasound Devices Industry Volume K Units Forecast, by Country 2019 & 2032
- Table 97: China Veterinary Ultrasound Devices Industry Revenue (Million) Forecast, by Application 2019 & 2032
- Table 98: China Veterinary Ultrasound Devices Industry Volume (K Units) Forecast, by Application 2019 & 2032
- Table 99: Japan Veterinary Ultrasound Devices Industry Revenue (Million) Forecast, by Application 2019 & 2032
- Table 100: Japan Veterinary Ultrasound Devices Industry Volume (K Units) Forecast, by Application 2019 & 2032
- Table 101: India Veterinary Ultrasound Devices Industry Revenue (Million) Forecast, by Application 2019 & 2032
- Table 102: India Veterinary Ultrasound Devices Industry Volume (K Units) Forecast, by Application 2019 & 2032
- Table 103: Australia Veterinary Ultrasound Devices Industry Revenue (Million) Forecast, by Application 2019 & 2032
- Table 104: Australia Veterinary Ultrasound Devices Industry Volume (K Units) Forecast, by Application 2019 & 2032
- Table 105: South Korea Veterinary Ultrasound Devices Industry Revenue (Million) Forecast, by Application 2019 & 2032
- Table 106: South Korea Veterinary Ultrasound Devices Industry Volume (K Units) Forecast, by Application 2019 & 2032
- Table 107: Rest of Asia Pacific Veterinary Ultrasound Devices Industry Revenue (Million) Forecast, by Application 2019 & 2032
- Table 108: Rest of Asia Pacific Veterinary Ultrasound Devices Industry Volume (K Units) Forecast, by Application 2019 & 2032
- Table 109: Global Veterinary Ultrasound Devices Industry Revenue Million Forecast, by Product 2019 & 2032
- Table 110: Global Veterinary Ultrasound Devices Industry Volume K Units Forecast, by Product 2019 & 2032
- Table 111: Global Veterinary Ultrasound Devices Industry Revenue Million Forecast, by Animal Type 2019 & 2032
- Table 112: Global Veterinary Ultrasound Devices Industry Volume K Units Forecast, by Animal Type 2019 & 2032
- Table 113: Global Veterinary Ultrasound Devices Industry Revenue Million Forecast, by Country 2019 & 2032
- Table 114: Global Veterinary Ultrasound Devices Industry Volume K Units Forecast, by Country 2019 & 2032
- Table 115: Global Veterinary Ultrasound Devices Industry Revenue Million Forecast, by Product 2019 & 2032
- Table 116: Global Veterinary Ultrasound Devices Industry Volume K Units Forecast, by Product 2019 & 2032
- Table 117: Global Veterinary Ultrasound Devices Industry Revenue Million Forecast, by Animal Type 2019 & 2032
- Table 118: Global Veterinary Ultrasound Devices Industry Volume K Units Forecast, by Animal Type 2019 & 2032
- Table 119: Global Veterinary Ultrasound Devices Industry Revenue Million Forecast, by Country 2019 & 2032
- Table 120: Global Veterinary Ultrasound Devices Industry Volume K Units Forecast, by Country 2019 & 2032
- Table 121: South Africa Veterinary Ultrasound Devices Industry Revenue (Million) Forecast, by Application 2019 & 2032
- Table 122: South Africa Veterinary Ultrasound Devices Industry Volume (K Units) Forecast, by Application 2019 & 2032
- Table 123: Rest of Middle East Veterinary Ultrasound Devices Industry Revenue (Million) Forecast, by Application 2019 & 2032
- Table 124: Rest of Middle East Veterinary Ultrasound Devices Industry Volume (K Units) Forecast, by Application 2019 & 2032
- Table 125: Global Veterinary Ultrasound Devices Industry Revenue Million Forecast, by Product 2019 & 2032
- Table 126: Global Veterinary Ultrasound Devices Industry Volume K Units Forecast, by Product 2019 & 2032
- Table 127: Global Veterinary Ultrasound Devices Industry Revenue Million Forecast, by Animal Type 2019 & 2032
- Table 128: Global Veterinary Ultrasound Devices Industry Volume K Units Forecast, by Animal Type 2019 & 2032
- Table 129: Global Veterinary Ultrasound Devices Industry Revenue Million Forecast, by Country 2019 & 2032
- Table 130: Global Veterinary Ultrasound Devices Industry Volume K Units Forecast, by Country 2019 & 2032
- Table 131: Brazil Veterinary Ultrasound Devices Industry Revenue (Million) Forecast, by Application 2019 & 2032
- Table 132: Brazil Veterinary Ultrasound Devices Industry Volume (K Units) Forecast, by Application 2019 & 2032
- Table 133: Argentina Veterinary Ultrasound Devices Industry Revenue (Million) Forecast, by Application 2019 & 2032
- Table 134: Argentina Veterinary Ultrasound Devices Industry Volume (K Units) Forecast, by Application 2019 & 2032
- Table 135: Rest of South America Veterinary Ultrasound Devices Industry Revenue (Million) Forecast, by Application 2019 & 2032
- Table 136: Rest of South America Veterinary Ultrasound Devices Industry Volume (K Units) Forecast, by Application 2019 & 2032
Frequently Asked Questions
1. What is the projected Compound Annual Growth Rate (CAGR) of the Veterinary Ultrasound Devices Industry?
The projected CAGR is approximately 5.60%.
2. Which companies are prominent players in the Veterinary Ultrasound Devices Industry?
Key companies in the market include Siemens Healthcare GmbH, DRAMINSKI SA, Canon Inc, Esaote SpA, Sonostar Technologies Co Limited, Samsung Medison Co Ltd, IMV Imaging, Shenzhen Mindray Bio-Medical Electronics Co Ltd, Fujifilm Holdings Corporation.
3. What are the main segments of the Veterinary Ultrasound Devices Industry?
The market segments include Product, Animal Type.
4. Can you provide details about the market size?
The market size is estimated to be USD XX Million as of 2022.
5. What are some drivers contributing to market growth?
Increase in Animal Adoption and Animal Health Expenditure; Rise in Demand for Diagnosis of Animal Health Conditions and Technological Advancements.
6. What are the notable trends driving market growth?
Small Animals Segment is Expected to Witness a Healthy CAGR Over the Forecast Period.
7. Are there any restraints impacting market growth?
Lack of Skilled Personnel; High Cost of the Devices.
8. Can you provide examples of recent developments in the market?
In November 2022, Advanced Veterinary Ultrasound (AVU), a Division of Advanced Ultrasound Systems, and Draminski SA, a manufacturer of quality point-of-care ultrasound (POCUS), partnered to provide feature-rich systems to the veterinary market. Through the agreement, AVU is authorized to market, sell, and service the line of portable ultrasound systems Draminski offers, such as the Draminski Blue, iScan2, and iScan Mini systems.
9. What pricing options are available for accessing the report?
Pricing options include single-user, multi-user, and enterprise licenses priced at USD 4750, USD 5250, and USD 8750 respectively.
10. Is the market size provided in terms of value or volume?
The market size is provided in terms of value, measured in Million and volume, measured in K Units.
11. Are there any specific market keywords associated with the report?
Yes, the market keyword associated with the report is "Veterinary Ultrasound Devices Industry," which aids in identifying and referencing the specific market segment covered.
12. How do I determine which pricing option suits my needs best?
The pricing options vary based on user requirements and access needs. Individual users may opt for single-user licenses, while businesses requiring broader access may choose multi-user or enterprise licenses for cost-effective access to the report.
13. Are there any additional resources or data provided in the Veterinary Ultrasound Devices Industry report?
While the report offers comprehensive insights, it's advisable to review the specific contents or supplementary materials provided to ascertain if additional resources or data are available.
14. How can I stay updated on further developments or reports in the Veterinary Ultrasound Devices Industry?
To stay informed about further developments, trends, and reports in the Veterinary Ultrasound Devices Industry, consider subscribing to industry newsletters, following relevant companies and organizations, or regularly checking reputable industry news sources and publications.
Methodology
Step 1 - Identification of Relevant Samples Size from Population Database


Step 2 - Approaches for Defining Global Market Size (Value, Volume* & Price*)

Note*: In applicable scenarios
Step 3 - Data Sources
Primary Research
- Web Analytics
- Survey Reports
- Research Institute
- Latest Research Reports
- Opinion Leaders
Secondary Research
- Annual Reports
- White Paper
- Latest Press Release
- Industry Association
- Paid Database
- Investor Presentations

Step 4 - Data Triangulation
Involves using different sources of information in order to increase the validity of a study
These sources are likely to be stakeholders in a program - participants, other researchers, program staff, other community members, and so on.
Then we put all data in single framework & apply various statistical tools to find out the dynamic on the market.
During the analysis stage, feedback from the stakeholder groups would be compared to determine areas of agreement as well as areas of divergence
