

Key Insights
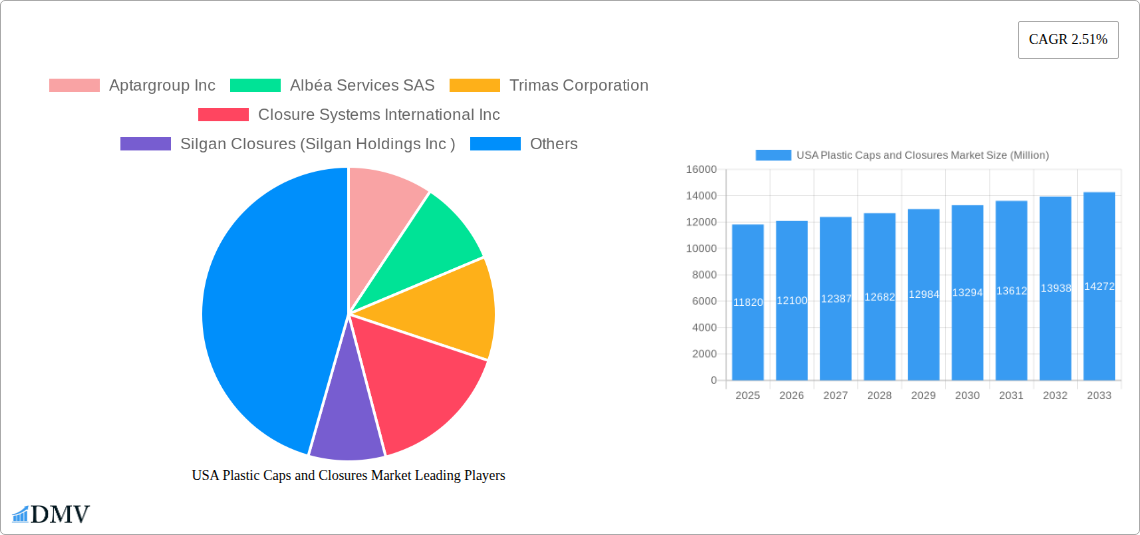
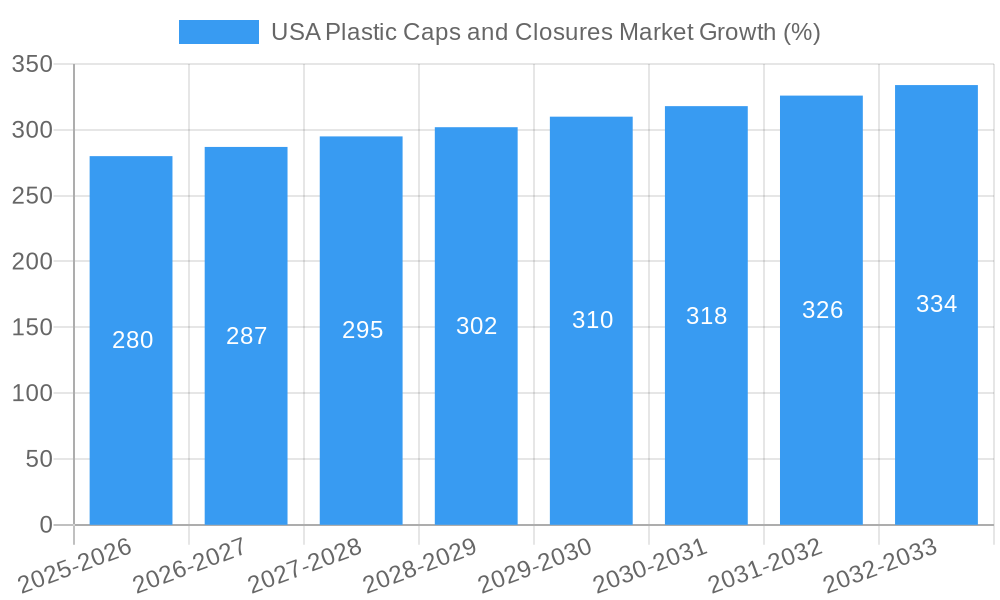
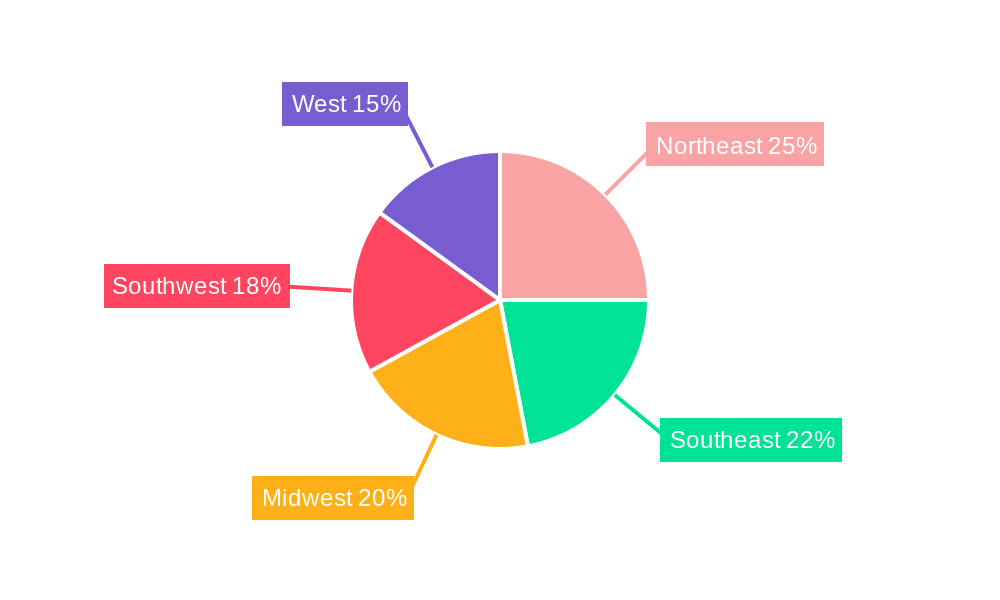
The US plastic caps and closures market, valued at $11.82 billion in 2025, is projected to experience steady growth with a Compound Annual Growth Rate (CAGR) of 2.51% from 2025 to 2033. This growth is fueled by several key drivers. The burgeoning food and beverage industry, coupled with increasing demand for convenient and tamper-evident packaging, significantly contributes to market expansion. The pharmaceutical and healthcare sectors also play a vital role, demanding specialized closures for medication and hygiene products. Furthermore, the rise in e-commerce and online retail necessitates secure and efficient packaging solutions, further boosting market demand. Consumer preference for sustainable and recyclable packaging options is a notable trend, driving innovation in bio-based and recycled plastic materials. However, fluctuating raw material prices and environmental concerns regarding plastic waste pose significant restraints. The market is segmented by raw material (polyethylene, PET, polypropylene, and others), type (threaded, dispensing, unthreaded, and child-resistant), and application (food, pharmaceutical, beverage, cosmetics, household chemicals, and others). Major players like Aptargroup Inc., Albéa Services SAS, and Berry Global Inc. are shaping market competition through product diversification and strategic partnerships. Regional analysis reveals significant market presence across the United States, with varying growth rates across Northeast, Southeast, Midwest, Southwest, and West regions reflecting differing industrial concentrations and consumer habits.
The forecast period (2025-2033) anticipates continued expansion, driven by ongoing technological advancements in closure design and manufacturing processes. The introduction of innovative, lightweight, and sustainable solutions will likely influence market dynamics. However, regulatory pressures related to plastic waste management and the rising adoption of alternative packaging materials represent potential challenges. Companies are increasingly focusing on eco-friendly options, such as recyclable and biodegradable plastics, to mitigate environmental concerns and meet evolving consumer demands. This strategic shift towards sustainability is expected to reshape the competitive landscape and influence future market growth projections. The diverse application segments offer ample opportunities for market expansion and penetration.
USA Plastic Caps and Closures Market: A Comprehensive Report (2019-2033)
This insightful report provides a detailed analysis of the USA plastic caps and closures market, offering a comprehensive overview of its current state, future trajectory, and key players. The study period spans from 2019 to 2033, with 2025 serving as both the base and estimated year. The report meticulously examines market segmentation, industry dynamics, competitive landscape, and emerging opportunities, providing stakeholders with crucial insights for strategic decision-making. The market is projected to reach xx Million by 2033, demonstrating significant growth potential.
USA Plastic Caps and Closures Market Composition & Trends
The USA plastic caps and closures market is a dynamic landscape characterized by moderate concentration, with several major players holding significant market share. Aptargroup Inc, Albéa Services SAS, Trimas Corporation, Closure Systems International Inc, Silgan Closures (Silgan Holdings Inc), O Berk Company LLC, Bericap Holding, Guala Closures Group (Guala Pack SPA), Tetra Pak International SA, Berry Global Inc, MJS Packaging, and Amcor Ltd are among the key players, although the market also encompasses numerous smaller regional manufacturers. The market share distribution is currently skewed towards larger multinational corporations, accounting for approximately 60% of total revenue. However, increasing demand for specialized closures is enabling smaller, niche players to carve out a significant portion of the market.
Innovation is a key driver, with continuous advancements in materials science and manufacturing techniques resulting in lighter, more sustainable, and functional closures. Regulatory landscapes, particularly those focused on sustainability and recyclability, are significantly impacting material choices and manufacturing processes. Substitute products, such as metal or glass closures, face competition from the cost-effectiveness and versatility of plastic. End-user preferences heavily influence demand patterns, with the food and beverage industries being major consumers. M&A activity has been moderate, with deal values averaging around xx Million USD per transaction. Recent mergers have focused on consolidating market share and expanding product portfolios.
- Market Concentration: Moderately concentrated, with major players holding ~60% market share.
- Innovation: Focus on lightweight, sustainable, and functional designs.
- Regulation: Increasing emphasis on recyclability and sustainable materials.
- Substitute Products: Metal and glass closures face competition from plastic.
- End-Users: Food and beverage industries are dominant consumers.
- M&A Activity: Moderate activity with average deal values of xx Million USD.
USA Plastic Caps and Closures Market Industry Evolution
The USA plastic caps and closures market has exhibited steady growth over the historical period (2019-2024), with a Compound Annual Growth Rate (CAGR) of xx%. This growth is primarily driven by increasing demand from the food, beverage, and pharmaceutical sectors, fueled by population growth and rising consumption. Technological advancements, particularly in injection molding and material science, have led to the development of more efficient and cost-effective manufacturing processes. The shift towards sustainable packaging solutions has created opportunities for manufacturers to produce eco-friendly, recyclable closures. Consumer preferences are shifting toward convenient packaging formats, further driving demand for innovative closures, such as dispensing caps and child-resistant closures. The forecast period (2025-2033) projects a CAGR of xx%, driven by the factors mentioned above and anticipated technological breakthroughs in material science and closure design, aiming to address current recycling challenges. Furthermore, the market is witnessing a growing adoption of recycled content in plastic closures, further boosting sustainability. This transition is expected to accelerate in the coming years, impacting raw material demand and manufacturing processes. The integration of smart technologies, such as sensors embedded within closures to improve product quality control and traceability, is also expected to gain traction, though currently at a lower adoption rate of less than 5%.
Leading Regions, Countries, or Segments in USA Plastic Caps and Closures Market
The USA plastic caps and closures market is geographically diverse, with significant contributions from various regions and states. While exact regional breakdowns require deeper analysis within the full report, certain segments dominate in terms of volume and value.
By Raw Material:
- Polyethylene (PE): Holds the largest market share due to its cost-effectiveness, flexibility, and suitability for various applications. Key drivers include its use in lightweight closures and initiatives supporting PE recycling.
- Polyethylene Terephthalate (PET): Significant market share driven by its use in beverage bottles and food containers. Regulatory support for recycled PET further boosts this segment.
- Polypropylene (PP): Strong presence due to its durability and resistance to heat, favored in food and pharmaceutical applications. Investment in PP recycling technologies is driving growth.
- Other Materials: Holds a smaller, though still significant, share, with various niche applications.
By Type:
- Threaded Caps: Dominates due to its widespread use across various applications and ease of use.
- Dispensing Caps: Growing demand driven by convenience and functionality in various applications, such as personal care and household chemicals.
- Child-resistant Caps: Stringent regulations are driving growth in this segment, particularly in pharmaceutical and household chemical applications.
By Application:
Food and Beverage: Remains the largest application segment, driving high demand for plastic caps and closures due to its high volume consumption.
Pharmaceutical and Healthcare: Stringent regulations and the need for tamper-evident closures are significant drivers.
Cosmetics and Toiletries: Growth driven by increasing consumer demand for premium packaging and convenience.
Key Drivers: Investment in recycling technologies, regulatory support for sustainable materials, and consumer preference for convenience.
USA Plastic Caps and Closures Market Product Innovations
Recent innovations focus on lightweighting, recyclability, and enhanced functionality. Berry Global's October 2023 launch of lightweight PE tube closures, offering versatility and reduced greenhouse gas emissions, exemplifies this trend. Other notable innovations include the development of caps with improved sealing mechanisms to prevent leakage and tamper-evident features for enhanced security. The integration of smart technologies remains an emerging area, with potential to improve traceability and supply chain management. These advancements contribute to enhanced performance metrics, including reduced material usage, improved consumer experience, and enhanced product safety.
Propelling Factors for USA Plastic Caps and Closures Market Growth
Several factors are driving the growth of the USA plastic caps and closures market. Technological advancements, particularly in materials science and manufacturing techniques, lead to cost-effective and sustainable solutions. Economic growth and rising disposable incomes increase consumer spending on packaged goods, boosting demand. Furthermore, stringent regulations regarding child safety and product tampering drive the demand for specialized closures. Finally, the growing focus on sustainability and the circular economy creates opportunities for recyclable and eco-friendly closures.
Obstacles in the USA Plastic Caps and Closures Market
Challenges include increasing raw material costs and fluctuations in resin prices, impacting profitability. Supply chain disruptions can impact availability and lead times. Furthermore, intense competition necessitates continuous innovation to maintain market share. Stricter environmental regulations and evolving consumer preferences for sustainable packaging require ongoing adaptations. These factors need careful consideration for successful market navigation.
Future Opportunities in USA Plastic Caps and Closures Market
Significant opportunities lie in the development of biodegradable and compostable closures, meeting growing demand for sustainable packaging. The integration of smart technologies into closures, enabling traceability and tamper-evident features, is also a significant area for expansion. Growing demand in emerging markets and untapped niches offers further potential. Finally, collaborating with recycling initiatives can lead to more sustainable practices and meet growing environmental concerns.
Major Players in the USA Plastic Caps and Closures Market Ecosystem
- Aptargroup Inc
- Albéa Services SAS
- Trimas Corporation
- Closure Systems International Inc
- Silgan Closures (Silgan Holdings Inc)
- O Berk Company LLC
- Bericap Holding
- Guala Closures Group (Guala Pack SPA)
- Tetra Pak International SA
- Berry Global Inc
- MJS Packaging
- Amcor Ltd
Key Developments in USA Plastic Caps and Closures Market Industry
- October 2023: Berry Global launched lightweight PE tube closures, emphasizing design, material versatility, and greenhouse gas reduction. This innovation is expected to increase demand for PE resin.
- May 2023: Closed Loop Partners secured a USD 10 Million investment to promote PE and PP recycling in the US and Canada, highlighting the growing focus on circular economy initiatives within the plastics industry.
Strategic USA Plastic Caps and Closures Market Forecast
The USA plastic caps and closures market is poised for continued growth, driven by innovation in sustainable materials, increasing demand across various sectors, and a growing emphasis on circular economy practices. The focus on lightweighting, recyclability, and enhanced functionality will continue to shape market dynamics. Opportunities lie in developing innovative closures that meet stringent regulatory requirements and consumer preferences for convenience and sustainability, leading to a robust market outlook for the forecast period.
USA Plastic Caps and Closures Market Segmentation
-
1. Raw Material
- 1.1. Polyethylene (PE)
- 1.2. Polyethylene Terephthalate (PET)
- 1.3. Polypropylene (PP)
- 1.4. Other Materials (Polystyrene and PVC)
-
2. Type
- 2.1. Threaded
- 2.2. Dispensing
- 2.3. Unthreaded
- 2.4. Child-resistant
-
3. Application
- 3.1. Food
- 3.2. Pharmaceutical and Healthcare
- 3.3. Beverage
- 3.4. Cosmetics and Toiletries
- 3.5. Household Chemicals
- 3.6. Other Applications
USA Plastic Caps and Closures Market Segmentation By Geography
-
1. North America
- 1.1. United States
- 1.2. Canada
- 1.3. Mexico
-
2. South America
- 2.1. Brazil
- 2.2. Argentina
- 2.3. Rest of South America
-
3. Europe
- 3.1. United Kingdom
- 3.2. Germany
- 3.3. France
- 3.4. Italy
- 3.5. Spain
- 3.6. Russia
- 3.7. Benelux
- 3.8. Nordics
- 3.9. Rest of Europe
-
4. Middle East & Africa
- 4.1. Turkey
- 4.2. Israel
- 4.3. GCC
- 4.4. North Africa
- 4.5. South Africa
- 4.6. Rest of Middle East & Africa
-
5. Asia Pacific
- 5.1. China
- 5.2. India
- 5.3. Japan
- 5.4. South Korea
- 5.5. ASEAN
- 5.6. Oceania
- 5.7. Rest of Asia Pacific
USA Plastic Caps and Closures Market REPORT HIGHLIGHTS
| Aspects | Details |
|---|---|
| Study Period | 2019-2033 |
| Base Year | 2024 |
| Estimated Year | 2025 |
| Forecast Period | 2025-2033 |
| Historical Period | 2019-2024 |
| Growth Rate | CAGR of 2.51% from 2019-2033 |
| Segmentation |
|
Table of Contents
- 1. Introduction
- 1.1. Research Scope
- 1.2. Market Segmentation
- 1.3. Research Methodology
- 1.4. Definitions and Assumptions
- 2. Executive Summary
- 2.1. Introduction
- 3. Market Dynamics
- 3.1. Introduction
- 3.2. Market Drivers
- 3.2.1. Demand for Packaged Food and Pharmaceutical Drugs; Increasing Demand from Small and Medium-Scale End-user Industries
- 3.3. Market Restrains
- 3.3.1. Increasing Price Volatility of Raw Materials
- 3.4. Market Trends
- 3.4.1. Polyethylene (PE) to be the Fastest Growing Raw Material Segment
- 4. Market Factor Analysis
- 4.1. Porters Five Forces
- 4.2. Supply/Value Chain
- 4.3. PESTEL analysis
- 4.4. Market Entropy
- 4.5. Patent/Trademark Analysis
- 5. Global USA Plastic Caps and Closures Market Analysis, Insights and Forecast, 2019-2031
- 5.1. Market Analysis, Insights and Forecast - by Raw Material
- 5.1.1. Polyethylene (PE)
- 5.1.2. Polyethylene Terephthalate (PET)
- 5.1.3. Polypropylene (PP)
- 5.1.4. Other Materials (Polystyrene and PVC)
- 5.2. Market Analysis, Insights and Forecast - by Type
- 5.2.1. Threaded
- 5.2.2. Dispensing
- 5.2.3. Unthreaded
- 5.2.4. Child-resistant
- 5.3. Market Analysis, Insights and Forecast - by Application
- 5.3.1. Food
- 5.3.2. Pharmaceutical and Healthcare
- 5.3.3. Beverage
- 5.3.4. Cosmetics and Toiletries
- 5.3.5. Household Chemicals
- 5.3.6. Other Applications
- 5.4. Market Analysis, Insights and Forecast - by Region
- 5.4.1. North America
- 5.4.2. South America
- 5.4.3. Europe
- 5.4.4. Middle East & Africa
- 5.4.5. Asia Pacific
- 5.1. Market Analysis, Insights and Forecast - by Raw Material
- 6. North America USA Plastic Caps and Closures Market Analysis, Insights and Forecast, 2019-2031
- 6.1. Market Analysis, Insights and Forecast - by Raw Material
- 6.1.1. Polyethylene (PE)
- 6.1.2. Polyethylene Terephthalate (PET)
- 6.1.3. Polypropylene (PP)
- 6.1.4. Other Materials (Polystyrene and PVC)
- 6.2. Market Analysis, Insights and Forecast - by Type
- 6.2.1. Threaded
- 6.2.2. Dispensing
- 6.2.3. Unthreaded
- 6.2.4. Child-resistant
- 6.3. Market Analysis, Insights and Forecast - by Application
- 6.3.1. Food
- 6.3.2. Pharmaceutical and Healthcare
- 6.3.3. Beverage
- 6.3.4. Cosmetics and Toiletries
- 6.3.5. Household Chemicals
- 6.3.6. Other Applications
- 6.1. Market Analysis, Insights and Forecast - by Raw Material
- 7. South America USA Plastic Caps and Closures Market Analysis, Insights and Forecast, 2019-2031
- 7.1. Market Analysis, Insights and Forecast - by Raw Material
- 7.1.1. Polyethylene (PE)
- 7.1.2. Polyethylene Terephthalate (PET)
- 7.1.3. Polypropylene (PP)
- 7.1.4. Other Materials (Polystyrene and PVC)
- 7.2. Market Analysis, Insights and Forecast - by Type
- 7.2.1. Threaded
- 7.2.2. Dispensing
- 7.2.3. Unthreaded
- 7.2.4. Child-resistant
- 7.3. Market Analysis, Insights and Forecast - by Application
- 7.3.1. Food
- 7.3.2. Pharmaceutical and Healthcare
- 7.3.3. Beverage
- 7.3.4. Cosmetics and Toiletries
- 7.3.5. Household Chemicals
- 7.3.6. Other Applications
- 7.1. Market Analysis, Insights and Forecast - by Raw Material
- 8. Europe USA Plastic Caps and Closures Market Analysis, Insights and Forecast, 2019-2031
- 8.1. Market Analysis, Insights and Forecast - by Raw Material
- 8.1.1. Polyethylene (PE)
- 8.1.2. Polyethylene Terephthalate (PET)
- 8.1.3. Polypropylene (PP)
- 8.1.4. Other Materials (Polystyrene and PVC)
- 8.2. Market Analysis, Insights and Forecast - by Type
- 8.2.1. Threaded
- 8.2.2. Dispensing
- 8.2.3. Unthreaded
- 8.2.4. Child-resistant
- 8.3. Market Analysis, Insights and Forecast - by Application
- 8.3.1. Food
- 8.3.2. Pharmaceutical and Healthcare
- 8.3.3. Beverage
- 8.3.4. Cosmetics and Toiletries
- 8.3.5. Household Chemicals
- 8.3.6. Other Applications
- 8.1. Market Analysis, Insights and Forecast - by Raw Material
- 9. Middle East & Africa USA Plastic Caps and Closures Market Analysis, Insights and Forecast, 2019-2031
- 9.1. Market Analysis, Insights and Forecast - by Raw Material
- 9.1.1. Polyethylene (PE)
- 9.1.2. Polyethylene Terephthalate (PET)
- 9.1.3. Polypropylene (PP)
- 9.1.4. Other Materials (Polystyrene and PVC)
- 9.2. Market Analysis, Insights and Forecast - by Type
- 9.2.1. Threaded
- 9.2.2. Dispensing
- 9.2.3. Unthreaded
- 9.2.4. Child-resistant
- 9.3. Market Analysis, Insights and Forecast - by Application
- 9.3.1. Food
- 9.3.2. Pharmaceutical and Healthcare
- 9.3.3. Beverage
- 9.3.4. Cosmetics and Toiletries
- 9.3.5. Household Chemicals
- 9.3.6. Other Applications
- 9.1. Market Analysis, Insights and Forecast - by Raw Material
- 10. Asia Pacific USA Plastic Caps and Closures Market Analysis, Insights and Forecast, 2019-2031
- 10.1. Market Analysis, Insights and Forecast - by Raw Material
- 10.1.1. Polyethylene (PE)
- 10.1.2. Polyethylene Terephthalate (PET)
- 10.1.3. Polypropylene (PP)
- 10.1.4. Other Materials (Polystyrene and PVC)
- 10.2. Market Analysis, Insights and Forecast - by Type
- 10.2.1. Threaded
- 10.2.2. Dispensing
- 10.2.3. Unthreaded
- 10.2.4. Child-resistant
- 10.3. Market Analysis, Insights and Forecast - by Application
- 10.3.1. Food
- 10.3.2. Pharmaceutical and Healthcare
- 10.3.3. Beverage
- 10.3.4. Cosmetics and Toiletries
- 10.3.5. Household Chemicals
- 10.3.6. Other Applications
- 10.1. Market Analysis, Insights and Forecast - by Raw Material
- 11. Northeast USA Plastic Caps and Closures Market Analysis, Insights and Forecast, 2019-2031
- 12. Southeast USA Plastic Caps and Closures Market Analysis, Insights and Forecast, 2019-2031
- 13. Midwest USA Plastic Caps and Closures Market Analysis, Insights and Forecast, 2019-2031
- 14. Southwest USA Plastic Caps and Closures Market Analysis, Insights and Forecast, 2019-2031
- 15. West USA Plastic Caps and Closures Market Analysis, Insights and Forecast, 2019-2031
- 16. Competitive Analysis
- 16.1. Global Market Share Analysis 2024
- 16.2. Company Profiles
- 16.2.1 Aptargroup Inc
- 16.2.1.1. Overview
- 16.2.1.2. Products
- 16.2.1.3. SWOT Analysis
- 16.2.1.4. Recent Developments
- 16.2.1.5. Financials (Based on Availability)
- 16.2.2 Albéa Services SAS
- 16.2.2.1. Overview
- 16.2.2.2. Products
- 16.2.2.3. SWOT Analysis
- 16.2.2.4. Recent Developments
- 16.2.2.5. Financials (Based on Availability)
- 16.2.3 Trimas Corporation
- 16.2.3.1. Overview
- 16.2.3.2. Products
- 16.2.3.3. SWOT Analysis
- 16.2.3.4. Recent Developments
- 16.2.3.5. Financials (Based on Availability)
- 16.2.4 Closure Systems International Inc
- 16.2.4.1. Overview
- 16.2.4.2. Products
- 16.2.4.3. SWOT Analysis
- 16.2.4.4. Recent Developments
- 16.2.4.5. Financials (Based on Availability)
- 16.2.5 Silgan Closures (Silgan Holdings Inc )
- 16.2.5.1. Overview
- 16.2.5.2. Products
- 16.2.5.3. SWOT Analysis
- 16.2.5.4. Recent Developments
- 16.2.5.5. Financials (Based on Availability)
- 16.2.6 O Berk Company LLC
- 16.2.6.1. Overview
- 16.2.6.2. Products
- 16.2.6.3. SWOT Analysis
- 16.2.6.4. Recent Developments
- 16.2.6.5. Financials (Based on Availability)
- 16.2.7 Bericap Holding*List Not Exhaustive
- 16.2.7.1. Overview
- 16.2.7.2. Products
- 16.2.7.3. SWOT Analysis
- 16.2.7.4. Recent Developments
- 16.2.7.5. Financials (Based on Availability)
- 16.2.8 Guala Closures Group (Guala Pack SPA)
- 16.2.8.1. Overview
- 16.2.8.2. Products
- 16.2.8.3. SWOT Analysis
- 16.2.8.4. Recent Developments
- 16.2.8.5. Financials (Based on Availability)
- 16.2.9 Tetra Pak International SA
- 16.2.9.1. Overview
- 16.2.9.2. Products
- 16.2.9.3. SWOT Analysis
- 16.2.9.4. Recent Developments
- 16.2.9.5. Financials (Based on Availability)
- 16.2.10 Berry Global Inc
- 16.2.10.1. Overview
- 16.2.10.2. Products
- 16.2.10.3. SWOT Analysis
- 16.2.10.4. Recent Developments
- 16.2.10.5. Financials (Based on Availability)
- 16.2.11 MJS Packaging
- 16.2.11.1. Overview
- 16.2.11.2. Products
- 16.2.11.3. SWOT Analysis
- 16.2.11.4. Recent Developments
- 16.2.11.5. Financials (Based on Availability)
- 16.2.12 Amcor Ltd
- 16.2.12.1. Overview
- 16.2.12.2. Products
- 16.2.12.3. SWOT Analysis
- 16.2.12.4. Recent Developments
- 16.2.12.5. Financials (Based on Availability)
- 16.2.1 Aptargroup Inc
List of Figures
- Figure 1: Global USA Plastic Caps and Closures Market Revenue Breakdown (Million, %) by Region 2024 & 2032
- Figure 2: United states USA Plastic Caps and Closures Market Revenue (Million), by Country 2024 & 2032
- Figure 3: United states USA Plastic Caps and Closures Market Revenue Share (%), by Country 2024 & 2032
- Figure 4: North America USA Plastic Caps and Closures Market Revenue (Million), by Raw Material 2024 & 2032
- Figure 5: North America USA Plastic Caps and Closures Market Revenue Share (%), by Raw Material 2024 & 2032
- Figure 6: North America USA Plastic Caps and Closures Market Revenue (Million), by Type 2024 & 2032
- Figure 7: North America USA Plastic Caps and Closures Market Revenue Share (%), by Type 2024 & 2032
- Figure 8: North America USA Plastic Caps and Closures Market Revenue (Million), by Application 2024 & 2032
- Figure 9: North America USA Plastic Caps and Closures Market Revenue Share (%), by Application 2024 & 2032
- Figure 10: North America USA Plastic Caps and Closures Market Revenue (Million), by Country 2024 & 2032
- Figure 11: North America USA Plastic Caps and Closures Market Revenue Share (%), by Country 2024 & 2032
- Figure 12: South America USA Plastic Caps and Closures Market Revenue (Million), by Raw Material 2024 & 2032
- Figure 13: South America USA Plastic Caps and Closures Market Revenue Share (%), by Raw Material 2024 & 2032
- Figure 14: South America USA Plastic Caps and Closures Market Revenue (Million), by Type 2024 & 2032
- Figure 15: South America USA Plastic Caps and Closures Market Revenue Share (%), by Type 2024 & 2032
- Figure 16: South America USA Plastic Caps and Closures Market Revenue (Million), by Application 2024 & 2032
- Figure 17: South America USA Plastic Caps and Closures Market Revenue Share (%), by Application 2024 & 2032
- Figure 18: South America USA Plastic Caps and Closures Market Revenue (Million), by Country 2024 & 2032
- Figure 19: South America USA Plastic Caps and Closures Market Revenue Share (%), by Country 2024 & 2032
- Figure 20: Europe USA Plastic Caps and Closures Market Revenue (Million), by Raw Material 2024 & 2032
- Figure 21: Europe USA Plastic Caps and Closures Market Revenue Share (%), by Raw Material 2024 & 2032
- Figure 22: Europe USA Plastic Caps and Closures Market Revenue (Million), by Type 2024 & 2032
- Figure 23: Europe USA Plastic Caps and Closures Market Revenue Share (%), by Type 2024 & 2032
- Figure 24: Europe USA Plastic Caps and Closures Market Revenue (Million), by Application 2024 & 2032
- Figure 25: Europe USA Plastic Caps and Closures Market Revenue Share (%), by Application 2024 & 2032
- Figure 26: Europe USA Plastic Caps and Closures Market Revenue (Million), by Country 2024 & 2032
- Figure 27: Europe USA Plastic Caps and Closures Market Revenue Share (%), by Country 2024 & 2032
- Figure 28: Middle East & Africa USA Plastic Caps and Closures Market Revenue (Million), by Raw Material 2024 & 2032
- Figure 29: Middle East & Africa USA Plastic Caps and Closures Market Revenue Share (%), by Raw Material 2024 & 2032
- Figure 30: Middle East & Africa USA Plastic Caps and Closures Market Revenue (Million), by Type 2024 & 2032
- Figure 31: Middle East & Africa USA Plastic Caps and Closures Market Revenue Share (%), by Type 2024 & 2032
- Figure 32: Middle East & Africa USA Plastic Caps and Closures Market Revenue (Million), by Application 2024 & 2032
- Figure 33: Middle East & Africa USA Plastic Caps and Closures Market Revenue Share (%), by Application 2024 & 2032
- Figure 34: Middle East & Africa USA Plastic Caps and Closures Market Revenue (Million), by Country 2024 & 2032
- Figure 35: Middle East & Africa USA Plastic Caps and Closures Market Revenue Share (%), by Country 2024 & 2032
- Figure 36: Asia Pacific USA Plastic Caps and Closures Market Revenue (Million), by Raw Material 2024 & 2032
- Figure 37: Asia Pacific USA Plastic Caps and Closures Market Revenue Share (%), by Raw Material 2024 & 2032
- Figure 38: Asia Pacific USA Plastic Caps and Closures Market Revenue (Million), by Type 2024 & 2032
- Figure 39: Asia Pacific USA Plastic Caps and Closures Market Revenue Share (%), by Type 2024 & 2032
- Figure 40: Asia Pacific USA Plastic Caps and Closures Market Revenue (Million), by Application 2024 & 2032
- Figure 41: Asia Pacific USA Plastic Caps and Closures Market Revenue Share (%), by Application 2024 & 2032
- Figure 42: Asia Pacific USA Plastic Caps and Closures Market Revenue (Million), by Country 2024 & 2032
- Figure 43: Asia Pacific USA Plastic Caps and Closures Market Revenue Share (%), by Country 2024 & 2032
List of Tables
- Table 1: Global USA Plastic Caps and Closures Market Revenue Million Forecast, by Region 2019 & 2032
- Table 2: Global USA Plastic Caps and Closures Market Revenue Million Forecast, by Raw Material 2019 & 2032
- Table 3: Global USA Plastic Caps and Closures Market Revenue Million Forecast, by Type 2019 & 2032
- Table 4: Global USA Plastic Caps and Closures Market Revenue Million Forecast, by Application 2019 & 2032
- Table 5: Global USA Plastic Caps and Closures Market Revenue Million Forecast, by Region 2019 & 2032
- Table 6: Global USA Plastic Caps and Closures Market Revenue Million Forecast, by Country 2019 & 2032
- Table 7: Northeast USA Plastic Caps and Closures Market Revenue (Million) Forecast, by Application 2019 & 2032
- Table 8: Southeast USA Plastic Caps and Closures Market Revenue (Million) Forecast, by Application 2019 & 2032
- Table 9: Midwest USA Plastic Caps and Closures Market Revenue (Million) Forecast, by Application 2019 & 2032
- Table 10: Southwest USA Plastic Caps and Closures Market Revenue (Million) Forecast, by Application 2019 & 2032
- Table 11: West USA Plastic Caps and Closures Market Revenue (Million) Forecast, by Application 2019 & 2032
- Table 12: Global USA Plastic Caps and Closures Market Revenue Million Forecast, by Raw Material 2019 & 2032
- Table 13: Global USA Plastic Caps and Closures Market Revenue Million Forecast, by Type 2019 & 2032
- Table 14: Global USA Plastic Caps and Closures Market Revenue Million Forecast, by Application 2019 & 2032
- Table 15: Global USA Plastic Caps and Closures Market Revenue Million Forecast, by Country 2019 & 2032
- Table 16: United States USA Plastic Caps and Closures Market Revenue (Million) Forecast, by Application 2019 & 2032
- Table 17: Canada USA Plastic Caps and Closures Market Revenue (Million) Forecast, by Application 2019 & 2032
- Table 18: Mexico USA Plastic Caps and Closures Market Revenue (Million) Forecast, by Application 2019 & 2032
- Table 19: Global USA Plastic Caps and Closures Market Revenue Million Forecast, by Raw Material 2019 & 2032
- Table 20: Global USA Plastic Caps and Closures Market Revenue Million Forecast, by Type 2019 & 2032
- Table 21: Global USA Plastic Caps and Closures Market Revenue Million Forecast, by Application 2019 & 2032
- Table 22: Global USA Plastic Caps and Closures Market Revenue Million Forecast, by Country 2019 & 2032
- Table 23: Brazil USA Plastic Caps and Closures Market Revenue (Million) Forecast, by Application 2019 & 2032
- Table 24: Argentina USA Plastic Caps and Closures Market Revenue (Million) Forecast, by Application 2019 & 2032
- Table 25: Rest of South America USA Plastic Caps and Closures Market Revenue (Million) Forecast, by Application 2019 & 2032
- Table 26: Global USA Plastic Caps and Closures Market Revenue Million Forecast, by Raw Material 2019 & 2032
- Table 27: Global USA Plastic Caps and Closures Market Revenue Million Forecast, by Type 2019 & 2032
- Table 28: Global USA Plastic Caps and Closures Market Revenue Million Forecast, by Application 2019 & 2032
- Table 29: Global USA Plastic Caps and Closures Market Revenue Million Forecast, by Country 2019 & 2032
- Table 30: United Kingdom USA Plastic Caps and Closures Market Revenue (Million) Forecast, by Application 2019 & 2032
- Table 31: Germany USA Plastic Caps and Closures Market Revenue (Million) Forecast, by Application 2019 & 2032
- Table 32: France USA Plastic Caps and Closures Market Revenue (Million) Forecast, by Application 2019 & 2032
- Table 33: Italy USA Plastic Caps and Closures Market Revenue (Million) Forecast, by Application 2019 & 2032
- Table 34: Spain USA Plastic Caps and Closures Market Revenue (Million) Forecast, by Application 2019 & 2032
- Table 35: Russia USA Plastic Caps and Closures Market Revenue (Million) Forecast, by Application 2019 & 2032
- Table 36: Benelux USA Plastic Caps and Closures Market Revenue (Million) Forecast, by Application 2019 & 2032
- Table 37: Nordics USA Plastic Caps and Closures Market Revenue (Million) Forecast, by Application 2019 & 2032
- Table 38: Rest of Europe USA Plastic Caps and Closures Market Revenue (Million) Forecast, by Application 2019 & 2032
- Table 39: Global USA Plastic Caps and Closures Market Revenue Million Forecast, by Raw Material 2019 & 2032
- Table 40: Global USA Plastic Caps and Closures Market Revenue Million Forecast, by Type 2019 & 2032
- Table 41: Global USA Plastic Caps and Closures Market Revenue Million Forecast, by Application 2019 & 2032
- Table 42: Global USA Plastic Caps and Closures Market Revenue Million Forecast, by Country 2019 & 2032
- Table 43: Turkey USA Plastic Caps and Closures Market Revenue (Million) Forecast, by Application 2019 & 2032
- Table 44: Israel USA Plastic Caps and Closures Market Revenue (Million) Forecast, by Application 2019 & 2032
- Table 45: GCC USA Plastic Caps and Closures Market Revenue (Million) Forecast, by Application 2019 & 2032
- Table 46: North Africa USA Plastic Caps and Closures Market Revenue (Million) Forecast, by Application 2019 & 2032
- Table 47: South Africa USA Plastic Caps and Closures Market Revenue (Million) Forecast, by Application 2019 & 2032
- Table 48: Rest of Middle East & Africa USA Plastic Caps and Closures Market Revenue (Million) Forecast, by Application 2019 & 2032
- Table 49: Global USA Plastic Caps and Closures Market Revenue Million Forecast, by Raw Material 2019 & 2032
- Table 50: Global USA Plastic Caps and Closures Market Revenue Million Forecast, by Type 2019 & 2032
- Table 51: Global USA Plastic Caps and Closures Market Revenue Million Forecast, by Application 2019 & 2032
- Table 52: Global USA Plastic Caps and Closures Market Revenue Million Forecast, by Country 2019 & 2032
- Table 53: China USA Plastic Caps and Closures Market Revenue (Million) Forecast, by Application 2019 & 2032
- Table 54: India USA Plastic Caps and Closures Market Revenue (Million) Forecast, by Application 2019 & 2032
- Table 55: Japan USA Plastic Caps and Closures Market Revenue (Million) Forecast, by Application 2019 & 2032
- Table 56: South Korea USA Plastic Caps and Closures Market Revenue (Million) Forecast, by Application 2019 & 2032
- Table 57: ASEAN USA Plastic Caps and Closures Market Revenue (Million) Forecast, by Application 2019 & 2032
- Table 58: Oceania USA Plastic Caps and Closures Market Revenue (Million) Forecast, by Application 2019 & 2032
- Table 59: Rest of Asia Pacific USA Plastic Caps and Closures Market Revenue (Million) Forecast, by Application 2019 & 2032
Frequently Asked Questions
1. What is the projected Compound Annual Growth Rate (CAGR) of the USA Plastic Caps and Closures Market?
The projected CAGR is approximately 2.51%.
2. Which companies are prominent players in the USA Plastic Caps and Closures Market?
Key companies in the market include Aptargroup Inc, Albéa Services SAS, Trimas Corporation, Closure Systems International Inc, Silgan Closures (Silgan Holdings Inc ), O Berk Company LLC, Bericap Holding*List Not Exhaustive, Guala Closures Group (Guala Pack SPA), Tetra Pak International SA, Berry Global Inc, MJS Packaging, Amcor Ltd.
3. What are the main segments of the USA Plastic Caps and Closures Market?
The market segments include Raw Material, Type, Application.
4. Can you provide details about the market size?
The market size is estimated to be USD 11.82 Million as of 2022.
5. What are some drivers contributing to market growth?
Demand for Packaged Food and Pharmaceutical Drugs; Increasing Demand from Small and Medium-Scale End-user Industries.
6. What are the notable trends driving market growth?
Polyethylene (PE) to be the Fastest Growing Raw Material Segment.
7. Are there any restraints impacting market growth?
Increasing Price Volatility of Raw Materials.
8. Can you provide examples of recent developments in the market?
October 2023: Berry Global launched a solution for lightweight tube closures that integrates cutting-edge design, material versatility, and greenhouse gas reduction. Manufactured from PE, these closures are available in 35 mm and 50 mm diameters, with options for matte or glossy surface finishes and orifice sizes of 3mm or 5mm. Anticipated innovations like this across the market are expected to drive higher demand for Polyethylene (PE) resin across the country in the upcoming years.
9. What pricing options are available for accessing the report?
Pricing options include single-user, multi-user, and enterprise licenses priced at USD 3800, USD 4500, and USD 5800 respectively.
10. Is the market size provided in terms of value or volume?
The market size is provided in terms of value, measured in Million.
11. Are there any specific market keywords associated with the report?
Yes, the market keyword associated with the report is "USA Plastic Caps and Closures Market," which aids in identifying and referencing the specific market segment covered.
12. How do I determine which pricing option suits my needs best?
The pricing options vary based on user requirements and access needs. Individual users may opt for single-user licenses, while businesses requiring broader access may choose multi-user or enterprise licenses for cost-effective access to the report.
13. Are there any additional resources or data provided in the USA Plastic Caps and Closures Market report?
While the report offers comprehensive insights, it's advisable to review the specific contents or supplementary materials provided to ascertain if additional resources or data are available.
14. How can I stay updated on further developments or reports in the USA Plastic Caps and Closures Market?
To stay informed about further developments, trends, and reports in the USA Plastic Caps and Closures Market, consider subscribing to industry newsletters, following relevant companies and organizations, or regularly checking reputable industry news sources and publications.
Methodology
Step 1 - Identification of Relevant Samples Size from Population Database


Step 2 - Approaches for Defining Global Market Size (Value, Volume* & Price*)

Note*: In applicable scenarios
Step 3 - Data Sources
Primary Research
- Web Analytics
- Survey Reports
- Research Institute
- Latest Research Reports
- Opinion Leaders
Secondary Research
- Annual Reports
- White Paper
- Latest Press Release
- Industry Association
- Paid Database
- Investor Presentations

Step 4 - Data Triangulation
Involves using different sources of information in order to increase the validity of a study
These sources are likely to be stakeholders in a program - participants, other researchers, program staff, other community members, and so on.
Then we put all data in single framework & apply various statistical tools to find out the dynamic on the market.
During the analysis stage, feedback from the stakeholder groups would be compared to determine areas of agreement as well as areas of divergence
