

Key Insights
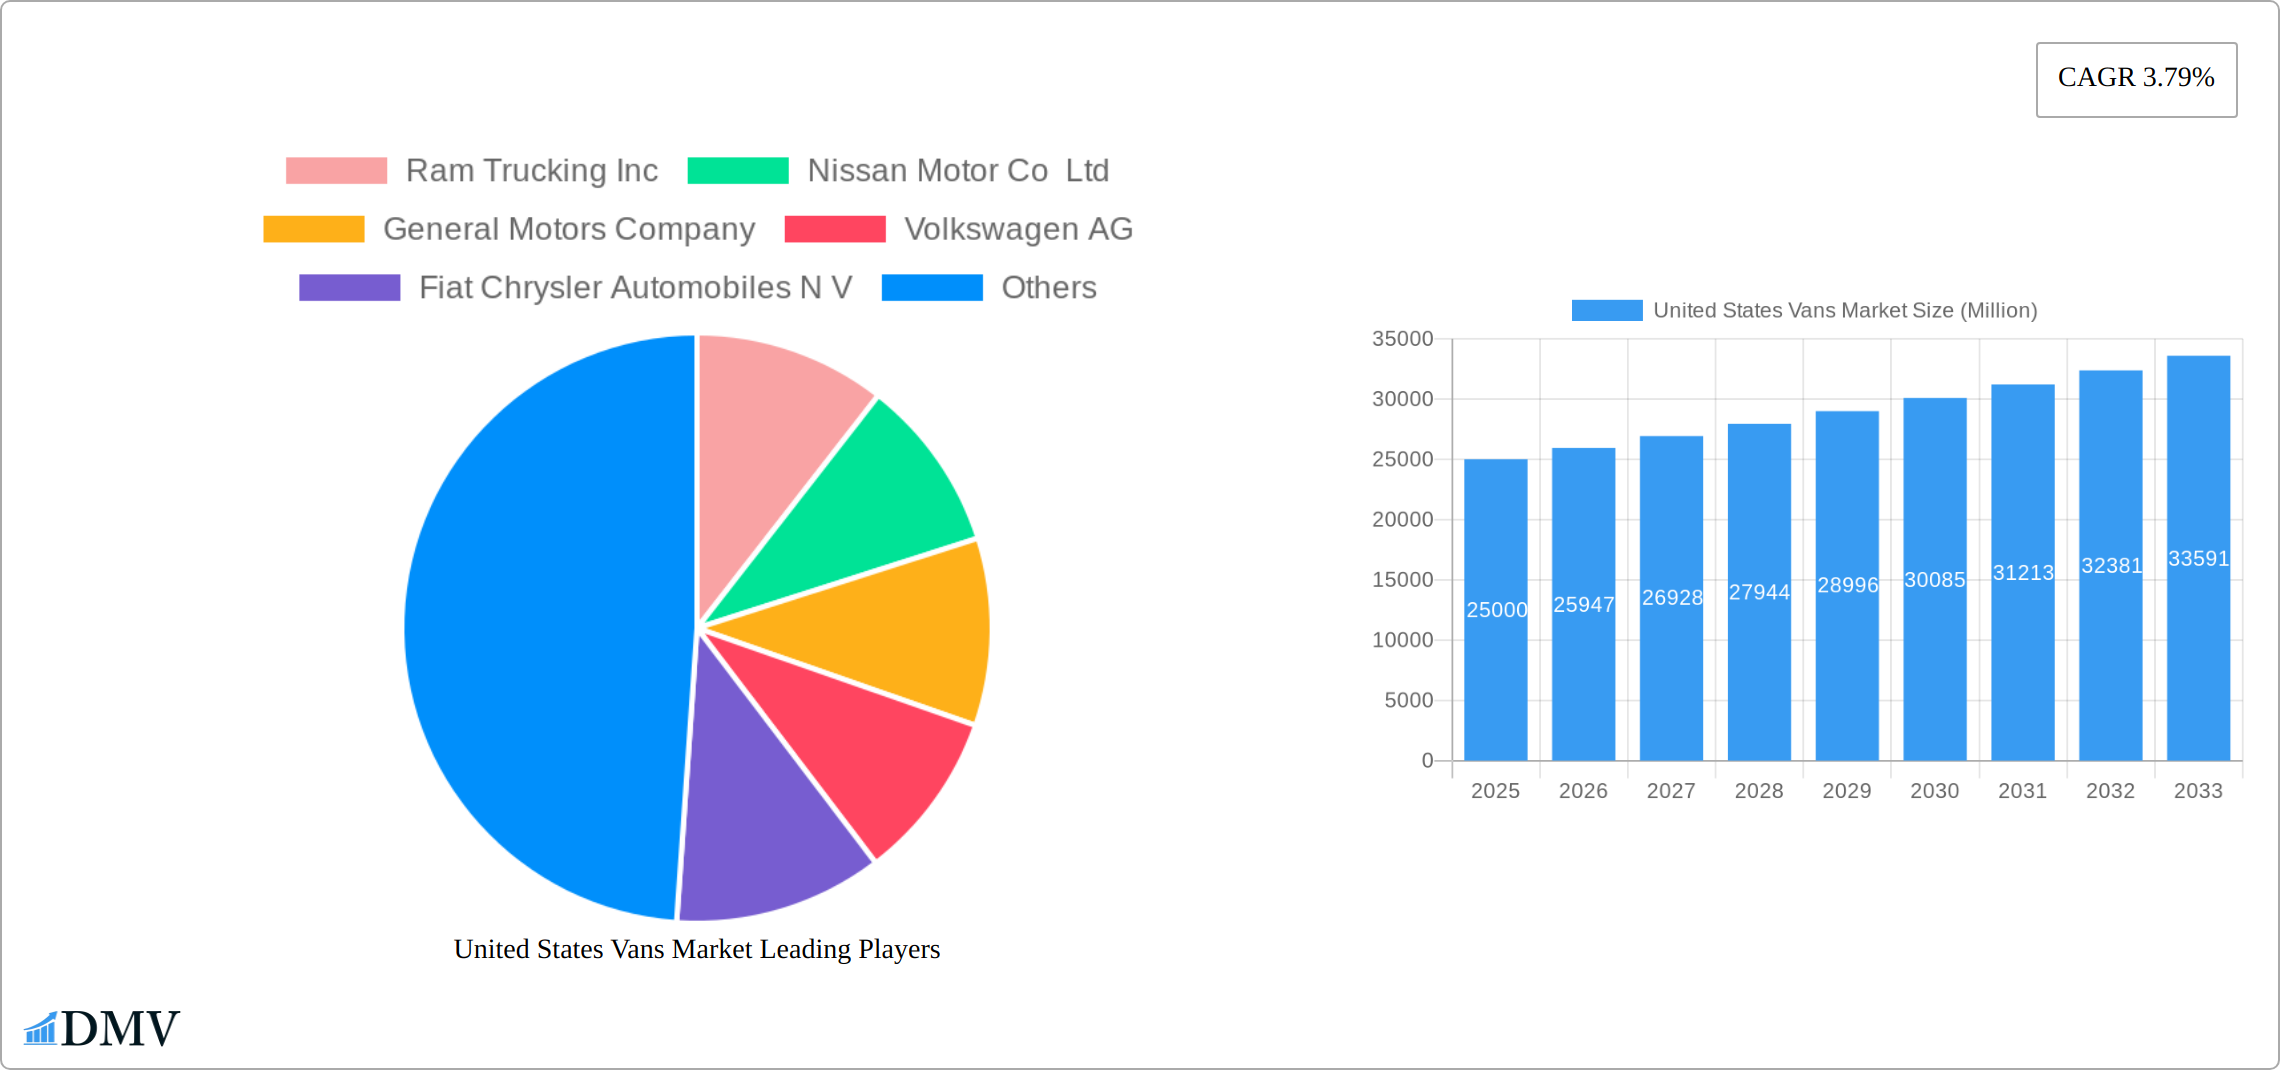
The United States vans market, characterized by a 3.79% CAGR (2019-2024), demonstrates robust growth driven by the increasing demand for last-mile delivery services, e-commerce expansion, and the burgeoning construction industry. The market segmentation reveals a significant portion attributed to gasoline-powered vans, though the hybrid and electric vehicle segment is experiencing rapid expansion, fueled by environmental regulations and corporate sustainability initiatives. Major players like Ford, GM, and Ram Trucks dominate the market, leveraging their established distribution networks and brand recognition. However, emerging companies specializing in electric vans are challenging the status quo, presenting innovative solutions and attracting environmentally conscious consumers and businesses. The North American region, particularly the United States, constitutes a substantial share of the global market, reflecting the region's robust economy and extensive transportation infrastructure. Future growth will likely be influenced by factors including fluctuating fuel prices, advancements in electric vehicle technology, and government policies promoting sustainable transportation.
The forecast period (2025-2033) anticipates continued growth, driven by the ongoing expansion of e-commerce and the increasing adoption of hybrid and electric vans. Technological advancements, such as improved battery technology and charging infrastructure, will play a crucial role in shaping market dynamics. Competition will remain fierce, with established players investing heavily in research and development to maintain their market share and new entrants vying for a position in this expanding market segment. Regulatory changes focused on emissions reduction and fuel efficiency will continue to influence the adoption of cleaner vehicle technologies. The continued development of sophisticated logistics and fleet management systems will also play a part in the overall growth of the US vans market. Successful market entrants will need to focus on offering a combination of cost-effectiveness, reliability, and environmentally friendly solutions.
United States Vans Market: A Comprehensive Report (2019-2033)
This insightful report provides a detailed analysis of the United States vans market, encompassing historical data (2019-2024), the current market (Base Year: 2025, Estimated Year: 2025), and a comprehensive forecast (2025-2033). It delves into market composition, industry evolution, leading segments, product innovations, growth drivers, obstacles, future opportunities, and key players, equipping stakeholders with crucial insights for informed decision-making. The report analyzes a market valued at xx Million in 2025, projected to reach xx Million by 2033, showcasing substantial growth potential.
United States Vans Market Market Composition & Trends
This section provides a comprehensive overview of the U.S. vans market landscape, examining market concentration, innovation drivers, regulatory dynamics, substitute products, end-user profiles, and mergers & acquisitions (M&A) activities. We analyze the market share distribution among key players like Ford Motor Company, General Motors Company (including Chevrolet), Stellantis (Fiat Chrysler Automobiles N V), Daimler AG (Mercedes-Benz AG), Nissan Motor Co Ltd, and Volkswagen AG, alongside smaller but significant players such as Workhorse Group Inc and IVECO S p A. The report also details M&A activities within the sector, estimating the total deal value at approximately xx Million during the study period (2019-2024).
- Market Concentration: The market exhibits a moderately concentrated structure, with a few dominant players holding a significant market share.
- Innovation Catalysts: The push towards electrification, autonomous driving features, and enhanced fuel efficiency are key drivers of innovation.
- Regulatory Landscape: Stringent emission standards and safety regulations significantly impact market dynamics and product development.
- Substitute Products: Light-duty trucks and cargo vans present some level of competition.
- End-User Profiles: The report identifies key end-users, including delivery services, logistics companies, small businesses, and individual consumers.
- M&A Activities: The report analyzes significant M&A transactions, providing insights into their implications for market consolidation and competition. Deal values are estimated at xx Million across the studied period.

United States Vans Market Industry Evolution
This section analyzes the evolution of the U.S. vans market from 2019 to 2033, focusing on market growth trajectories, technological advancements, and evolving consumer preferences. The market experienced a Compound Annual Growth Rate (CAGR) of xx% during 2019-2024. Factors influencing this growth include increasing e-commerce activity driving demand for delivery vans, advancements in electric vehicle (EV) technology, and evolving consumer preferences towards more fuel-efficient and technologically advanced vehicles. We project a CAGR of xx% from 2025 to 2033, driven by the continued adoption of electric vans and increasing focus on sustainability. The adoption rate of hybrid and electric vans is expected to significantly increase over the forecast period, reaching xx% by 2033.
Leading Regions, Countries, or Segments in United States Vans Market
This section highlights the dominant segments within the U.S. vans market based on propulsion type (Gasoline, Hybrid, and Electric Vehicles). California is expected to be the leading region, driven by strong EV adoption rates and supportive government policies.
- Key Drivers for California Dominance:
- Strong regulatory support for EVs: California has implemented stringent emission regulations, favoring the adoption of electric vehicles.
- High investment in charging infrastructure: Significant investments in charging stations are bolstering EV adoption.
- Growing demand from delivery and logistics companies: The booming e-commerce sector in California is driving demand for delivery vans.
The gasoline segment currently holds the largest market share, but the hybrid and electric vehicle segments are projected to witness rapid growth in the coming years.
United States Vans Market Product Innovations
Recent product innovations focus on enhanced fuel efficiency, advanced safety features, and increased cargo capacity. Manufacturers are introducing electric and hybrid van models with extended range and improved battery technology. Features like advanced driver-assistance systems (ADAS) and telematics are becoming increasingly prevalent. Unique selling propositions include optimized cargo space, enhanced durability, and customizable configurations catering to diverse user needs.
Propelling Factors for United States Vans Market Growth
The U.S. vans market growth is fueled by several factors: the booming e-commerce sector driving demand for last-mile delivery, government incentives promoting the adoption of electric vans, increasing investments in charging infrastructure, and advancements in EV battery technology extending range and reducing charging times. Furthermore, the rising preference for fuel-efficient vehicles contributes significantly to market expansion.
Obstacles in the United States Vans Market Market
Key obstacles include the high initial cost of electric vans, supply chain disruptions impacting component availability, and intense competition among established and new entrants. The fluctuating price of gasoline also impacts market dynamics, influencing consumer purchasing decisions. Furthermore, the development and implementation of comprehensive charging infrastructure continues to pose a challenge.
Future Opportunities in United States Vans Market
Future opportunities reside in the growing demand for autonomous delivery vans, advancements in battery technology further improving EV range and charging speed, and the expansion of the market into new segments, such as specialized delivery for healthcare and pharmaceuticals.
Major Players in the United States Vans Market Ecosystem
- Ram Trucking Inc
- Nissan Motor Co Ltd
- General Motors Company
- Volkswagen AG
- Fiat Chrysler Automobiles N V
- Daimler AG (Mercedes-Benz AG)
- Workhorse Group Inc
- IVECO S p A
- GM Motor (Chevrolet)
- Ford Motor Company
Key Developments in United States Vans Market Industry
- June 2023: FORD NEXT launches a new pilot program offering flexible electric vehicle leasing solutions for Uber drivers in select U.S. markets. This fosters wider EV adoption among a key user group.
- June 2023: Stellantis secures a deal with Merchants Fleet for 12,500 Ram ProMaster EV units over the next several years, indicating significant growth in the commercial EV sector.
- June 2023: Mercedes-Benz expands the availability of its DRIVE PILOT (SAE Level 3) system to California, marking a significant advancement in autonomous driving technology within the U.S. market.
Strategic United States Vans Market Market Forecast
The U.S. vans market is poised for robust growth, driven by the increasing adoption of electric and hybrid vehicles, the expansion of e-commerce, and the development of autonomous driving technologies. Government initiatives promoting sustainable transportation will further accelerate market expansion. The continued focus on innovation and technological advancements will shape the competitive landscape and drive future market potential.
United States Vans Market Segmentation
-
1. Propulsion Type
-
1.1. Hybrid and Electric Vehicles
-
1.1.1. By Fuel Category
- 1.1.1.1. BEV
- 1.1.1.2. HEV
-
1.1.1. By Fuel Category
-
1.2. ICE
- 1.2.1. Diesel
- 1.2.2. Gasoline
-
1.1. Hybrid and Electric Vehicles
United States Vans Market Segmentation By Geography
- 1. United States

United States Vans Market REPORT HIGHLIGHTS
| Aspects | Details |
|---|---|
| Study Period | 2019-2033 |
| Base Year | 2024 |
| Estimated Year | 2025 |
| Forecast Period | 2025-2033 |
| Historical Period | 2019-2024 |
| Growth Rate | CAGR of 3.79% from 2019-2033 |
| Segmentation |
|
Table of Contents
- 1. Introduction
- 1.1. Research Scope
- 1.2. Market Segmentation
- 1.3. Research Methodology
- 1.4. Definitions and Assumptions
- 2. Executive Summary
- 2.1. Introduction
- 3. Market Dynamics
- 3.1. Introduction
- 3.2. Market Drivers
- 3.2.1. Rising Demand for Small Boats; Expanding Recreational Boating Opportunities
- 3.3. Market Restrains
- 3.3.1. Strict Emission Norms for Recreation Boats Likely to Have Negative Impact
- 3.4. Market Trends
- 3.4.1. OTHER KEY INDUSTRY TRENDS COVERED IN THE REPORT
- 4. Market Factor Analysis
- 4.1. Porters Five Forces
- 4.2. Supply/Value Chain
- 4.3. PESTEL analysis
- 4.4. Market Entropy
- 4.5. Patent/Trademark Analysis
- 5. United States Vans Market Analysis, Insights and Forecast, 2019-2031
- 5.1. Market Analysis, Insights and Forecast - by Propulsion Type
- 5.1.1. Hybrid and Electric Vehicles
- 5.1.1.1. By Fuel Category
- 5.1.1.1.1. BEV
- 5.1.1.1.2. HEV
- 5.1.1.1. By Fuel Category
- 5.1.2. ICE
- 5.1.2.1. Diesel
- 5.1.2.2. Gasoline
- 5.1.1. Hybrid and Electric Vehicles
- 5.2. Market Analysis, Insights and Forecast - by Region
- 5.2.1. United States
- 5.1. Market Analysis, Insights and Forecast - by Propulsion Type
- 6. North America United States Vans Market Analysis, Insights and Forecast, 2019-2031
- 6.1. Market Analysis, Insights and Forecast - By Country/Sub-region
- 6.1.1 United States
- 6.1.2 Canada
- 6.1.3 Rest of North America
- 7. Europe United States Vans Market Analysis, Insights and Forecast, 2019-2031
- 7.1. Market Analysis, Insights and Forecast - By Country/Sub-region
- 7.1.1 Germany
- 7.1.2 United Kingdom
- 7.1.3 France
- 7.1.4 Rest of Europe
- 8. Asia Pacific United States Vans Market Analysis, Insights and Forecast, 2019-2031
- 8.1. Market Analysis, Insights and Forecast - By Country/Sub-region
- 8.1.1 India
- 8.1.2 China
- 8.1.3 Japan
- 8.1.4 South Korea
- 8.1.5 Rest of Asia Pacific
- 9. Rest of the World United States Vans Market Analysis, Insights and Forecast, 2019-2031
- 9.1. Market Analysis, Insights and Forecast - By Country/Sub-region
- 9.1.1 Brazil
- 9.1.2 Mexico
- 9.1.3 United Arab Emirates
- 9.1.4 Other Countries
- 10. Competitive Analysis
- 10.1. Market Share Analysis 2024
- 10.2. Company Profiles
- 10.2.1 Ram Trucking Inc
- 10.2.1.1. Overview
- 10.2.1.2. Products
- 10.2.1.3. SWOT Analysis
- 10.2.1.4. Recent Developments
- 10.2.1.5. Financials (Based on Availability)
- 10.2.2 Nissan Motor Co Ltd
- 10.2.2.1. Overview
- 10.2.2.2. Products
- 10.2.2.3. SWOT Analysis
- 10.2.2.4. Recent Developments
- 10.2.2.5. Financials (Based on Availability)
- 10.2.3 General Motors Company
- 10.2.3.1. Overview
- 10.2.3.2. Products
- 10.2.3.3. SWOT Analysis
- 10.2.3.4. Recent Developments
- 10.2.3.5. Financials (Based on Availability)
- 10.2.4 Volkswagen AG
- 10.2.4.1. Overview
- 10.2.4.2. Products
- 10.2.4.3. SWOT Analysis
- 10.2.4.4. Recent Developments
- 10.2.4.5. Financials (Based on Availability)
- 10.2.5 Fiat Chrysler Automobiles N V
- 10.2.5.1. Overview
- 10.2.5.2. Products
- 10.2.5.3. SWOT Analysis
- 10.2.5.4. Recent Developments
- 10.2.5.5. Financials (Based on Availability)
- 10.2.6 Daimler AG (Mercedes-Benz AG)
- 10.2.6.1. Overview
- 10.2.6.2. Products
- 10.2.6.3. SWOT Analysis
- 10.2.6.4. Recent Developments
- 10.2.6.5. Financials (Based on Availability)
- 10.2.7 Workhorse Group Inc
- 10.2.7.1. Overview
- 10.2.7.2. Products
- 10.2.7.3. SWOT Analysis
- 10.2.7.4. Recent Developments
- 10.2.7.5. Financials (Based on Availability)
- 10.2.8 IVECO S p A
- 10.2.8.1. Overview
- 10.2.8.2. Products
- 10.2.8.3. SWOT Analysis
- 10.2.8.4. Recent Developments
- 10.2.8.5. Financials (Based on Availability)
- 10.2.9 GM Motor (Chevrolet)
- 10.2.9.1. Overview
- 10.2.9.2. Products
- 10.2.9.3. SWOT Analysis
- 10.2.9.4. Recent Developments
- 10.2.9.5. Financials (Based on Availability)
- 10.2.10 Ford Motor Company
- 10.2.10.1. Overview
- 10.2.10.2. Products
- 10.2.10.3. SWOT Analysis
- 10.2.10.4. Recent Developments
- 10.2.10.5. Financials (Based on Availability)
- 10.2.1 Ram Trucking Inc
List of Figures
- Figure 1: United States Vans Market Revenue Breakdown (Million, %) by Product 2024 & 2032
- Figure 2: United States Vans Market Share (%) by Company 2024
List of Tables
- Table 1: United States Vans Market Revenue Million Forecast, by Region 2019 & 2032
- Table 2: United States Vans Market Revenue Million Forecast, by Propulsion Type 2019 & 2032
- Table 3: United States Vans Market Revenue Million Forecast, by Region 2019 & 2032
- Table 4: United States Vans Market Revenue Million Forecast, by Country 2019 & 2032
- Table 5: United States United States Vans Market Revenue (Million) Forecast, by Application 2019 & 2032
- Table 6: Canada United States Vans Market Revenue (Million) Forecast, by Application 2019 & 2032
- Table 7: Rest of North America United States Vans Market Revenue (Million) Forecast, by Application 2019 & 2032
- Table 8: United States Vans Market Revenue Million Forecast, by Country 2019 & 2032
- Table 9: Germany United States Vans Market Revenue (Million) Forecast, by Application 2019 & 2032
- Table 10: United Kingdom United States Vans Market Revenue (Million) Forecast, by Application 2019 & 2032
- Table 11: France United States Vans Market Revenue (Million) Forecast, by Application 2019 & 2032
- Table 12: Rest of Europe United States Vans Market Revenue (Million) Forecast, by Application 2019 & 2032
- Table 13: United States Vans Market Revenue Million Forecast, by Country 2019 & 2032
- Table 14: India United States Vans Market Revenue (Million) Forecast, by Application 2019 & 2032
- Table 15: China United States Vans Market Revenue (Million) Forecast, by Application 2019 & 2032
- Table 16: Japan United States Vans Market Revenue (Million) Forecast, by Application 2019 & 2032
- Table 17: South Korea United States Vans Market Revenue (Million) Forecast, by Application 2019 & 2032
- Table 18: Rest of Asia Pacific United States Vans Market Revenue (Million) Forecast, by Application 2019 & 2032
- Table 19: United States Vans Market Revenue Million Forecast, by Country 2019 & 2032
- Table 20: Brazil United States Vans Market Revenue (Million) Forecast, by Application 2019 & 2032
- Table 21: Mexico United States Vans Market Revenue (Million) Forecast, by Application 2019 & 2032
- Table 22: United Arab Emirates United States Vans Market Revenue (Million) Forecast, by Application 2019 & 2032
- Table 23: Other Countries United States Vans Market Revenue (Million) Forecast, by Application 2019 & 2032
- Table 24: United States Vans Market Revenue Million Forecast, by Propulsion Type 2019 & 2032
- Table 25: United States Vans Market Revenue Million Forecast, by Country 2019 & 2032
Frequently Asked Questions
1. What is the projected Compound Annual Growth Rate (CAGR) of the United States Vans Market?
The projected CAGR is approximately 3.79%.
2. Which companies are prominent players in the United States Vans Market?
Key companies in the market include Ram Trucking Inc, Nissan Motor Co Ltd, General Motors Company, Volkswagen AG, Fiat Chrysler Automobiles N V, Daimler AG (Mercedes-Benz AG), Workhorse Group Inc, IVECO S p A, GM Motor (Chevrolet), Ford Motor Company.
3. What are the main segments of the United States Vans Market?
The market segments include Propulsion Type.
4. Can you provide details about the market size?
The market size is estimated to be USD XX Million as of 2022.
5. What are some drivers contributing to market growth?
Rising Demand for Small Boats; Expanding Recreational Boating Opportunities.
6. What are the notable trends driving market growth?
OTHER KEY INDUSTRY TRENDS COVERED IN THE REPORT.
7. Are there any restraints impacting market growth?
Strict Emission Norms for Recreation Boats Likely to Have Negative Impact.
8. Can you provide examples of recent developments in the market?
June 2023: FORD NEXT launches New pilot program creates flexible electric solutions for drivers who use the Uber platform in select U.S. markets, allowing them to lease a vehicle for more customized time periods.June 2023: Stellantis adds Merchants Fleet as latest Ram ProMaster EV commercial customer and that agreement calls for 12,500 Ram ProMaster EV units over the next several years.June 2023: Mercedes-Benz DRIVE PILOT expands U.S. availability to California and introduce a SAE Level 3 system in a standard-production vehicle for use on public freeways in the most populous state in the U.S.
9. What pricing options are available for accessing the report?
Pricing options include single-user, multi-user, and enterprise licenses priced at USD 3800, USD 4500, and USD 5800 respectively.
10. Is the market size provided in terms of value or volume?
The market size is provided in terms of value, measured in Million.
11. Are there any specific market keywords associated with the report?
Yes, the market keyword associated with the report is "United States Vans Market," which aids in identifying and referencing the specific market segment covered.
12. How do I determine which pricing option suits my needs best?
The pricing options vary based on user requirements and access needs. Individual users may opt for single-user licenses, while businesses requiring broader access may choose multi-user or enterprise licenses for cost-effective access to the report.
13. Are there any additional resources or data provided in the United States Vans Market report?
While the report offers comprehensive insights, it's advisable to review the specific contents or supplementary materials provided to ascertain if additional resources or data are available.
14. How can I stay updated on further developments or reports in the United States Vans Market?
To stay informed about further developments, trends, and reports in the United States Vans Market, consider subscribing to industry newsletters, following relevant companies and organizations, or regularly checking reputable industry news sources and publications.
Methodology
Step 1 - Identification of Relevant Samples Size from Population Database


Step 2 - Approaches for Defining Global Market Size (Value, Volume* & Price*)

Note*: In applicable scenarios
Step 3 - Data Sources
Primary Research
- Web Analytics
- Survey Reports
- Research Institute
- Latest Research Reports
- Opinion Leaders
Secondary Research
- Annual Reports
- White Paper
- Latest Press Release
- Industry Association
- Paid Database
- Investor Presentations

Step 4 - Data Triangulation
Involves using different sources of information in order to increase the validity of a study
These sources are likely to be stakeholders in a program - participants, other researchers, program staff, other community members, and so on.
Then we put all data in single framework & apply various statistical tools to find out the dynamic on the market.
During the analysis stage, feedback from the stakeholder groups would be compared to determine areas of agreement as well as areas of divergence
