

Key Insights
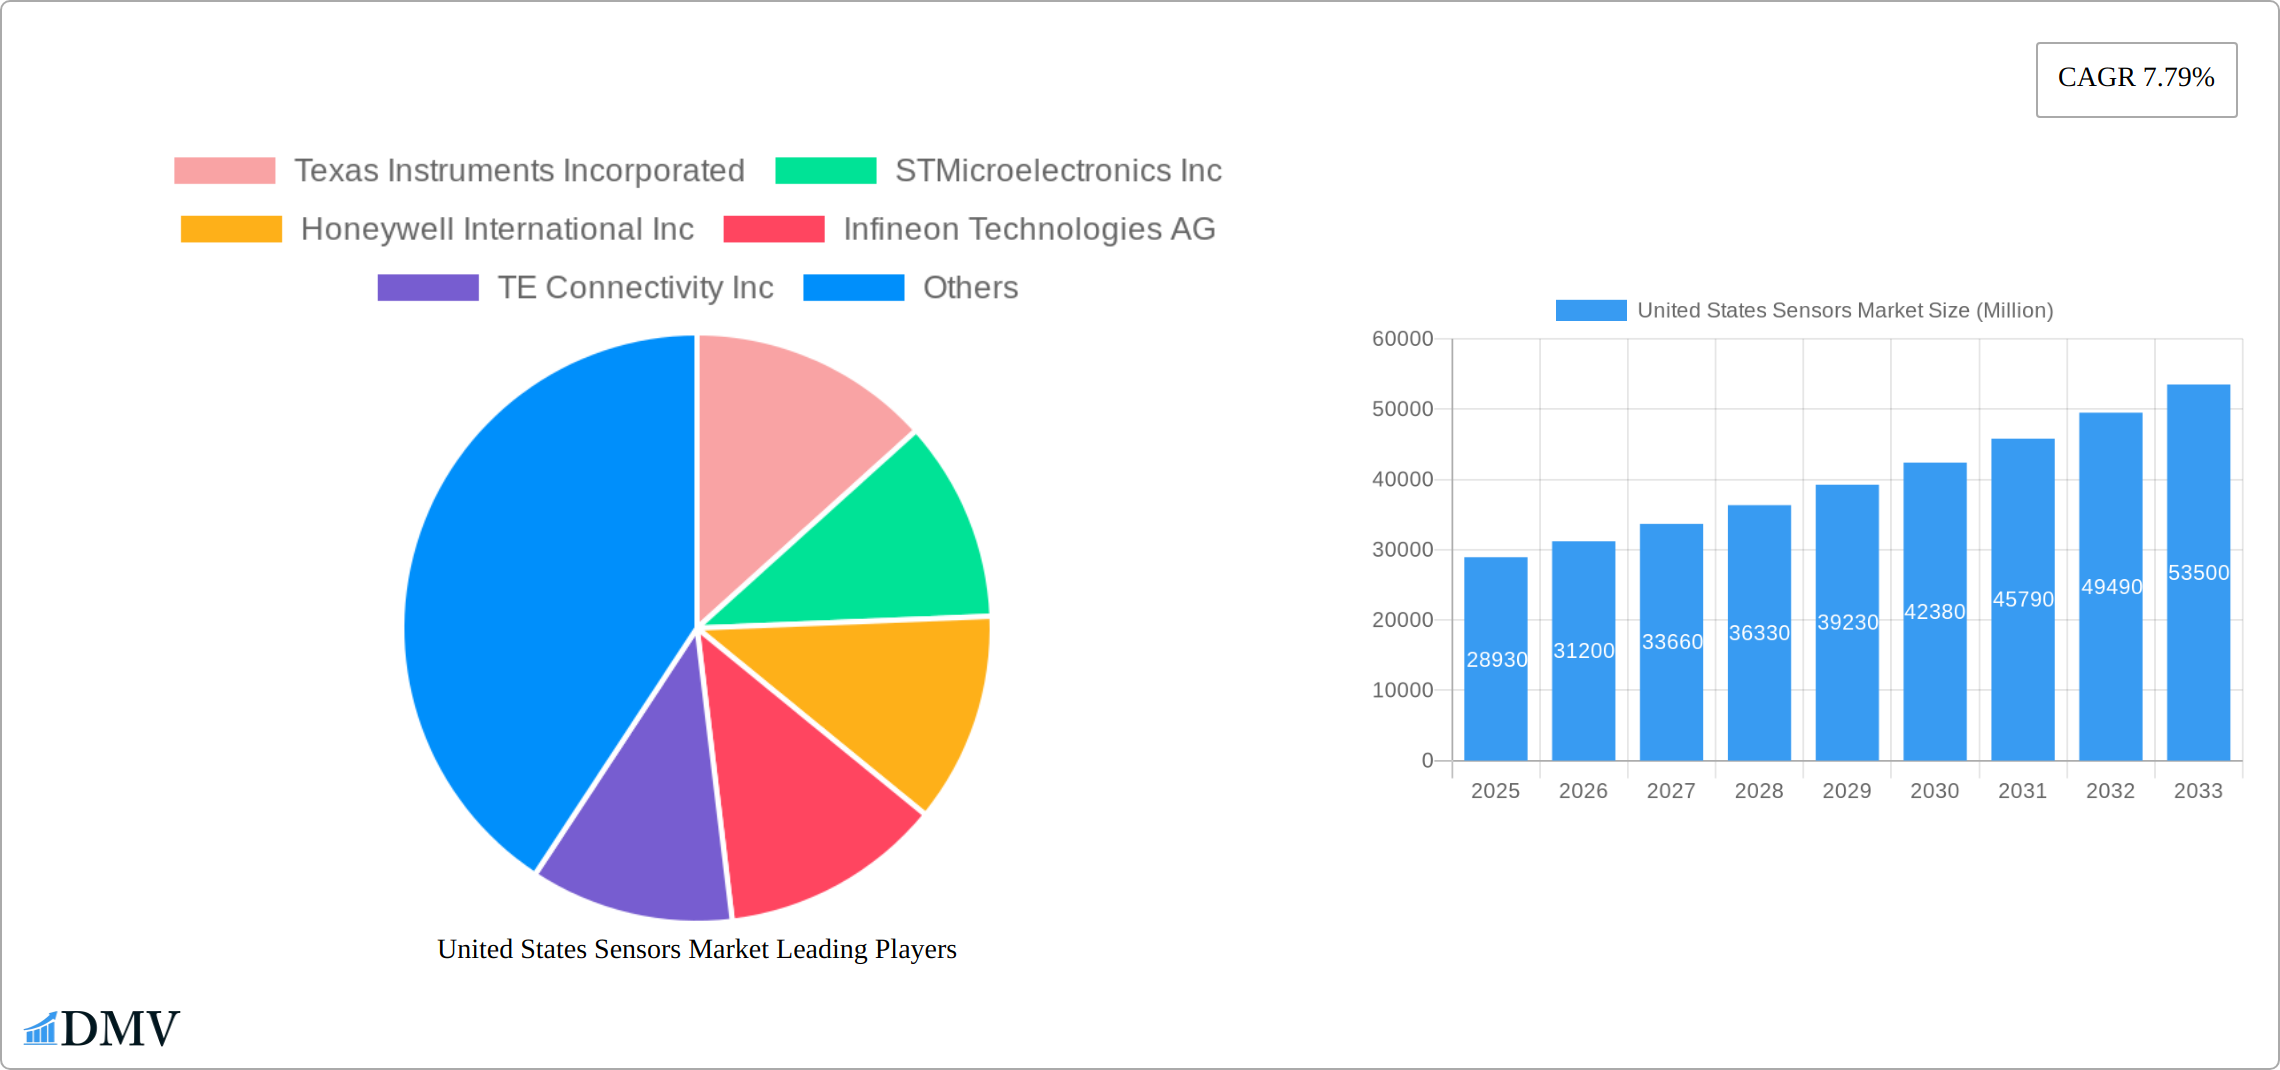
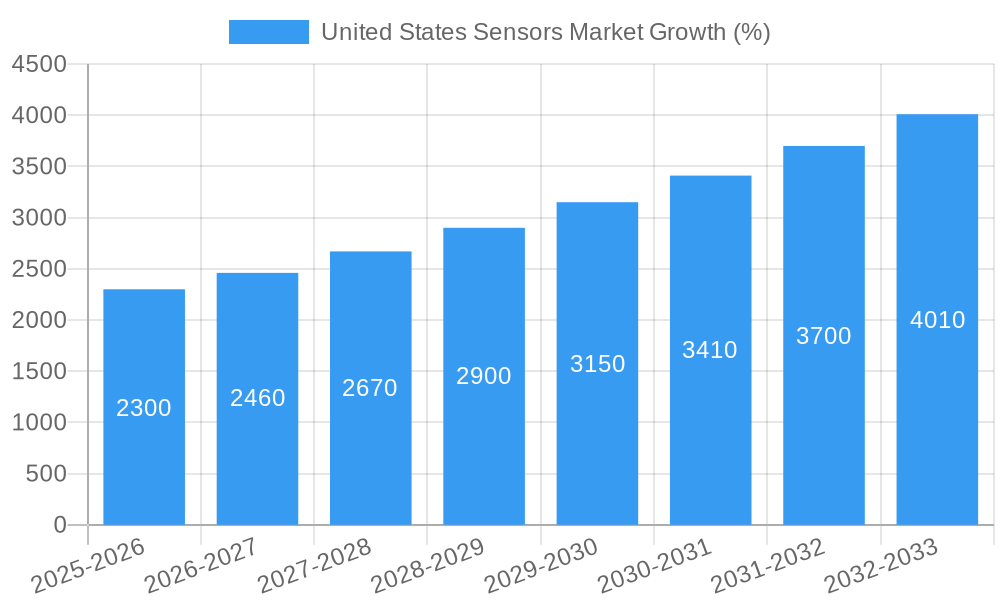
The United States sensors market, valued at $28.93 billion in 2025, is projected to experience robust growth, driven by several key factors. The increasing adoption of automation and Industry 4.0 technologies across various sectors, including automotive, healthcare, and manufacturing, is fueling significant demand for advanced sensor solutions. Furthermore, the growing need for enhanced data analytics and real-time monitoring capabilities is propelling the market forward. Government initiatives promoting technological advancements and infrastructure development further contribute to this positive trajectory. Specific growth areas include the rising demand for sophisticated sensors in autonomous vehicles, smart homes, and wearable technology, as well as the increasing use of IoT-enabled devices requiring sensor integration. Competitive dynamics are shaped by both established players like Texas Instruments and Honeywell, and emerging companies specializing in niche sensor technologies. The market’s segmentation likely includes various sensor types (e.g., pressure, temperature, image sensors), application areas, and end-user industries.
Despite the considerable growth potential, certain challenges persist. The relatively high cost of advanced sensor technologies can limit wider adoption, particularly in cost-sensitive sectors. Supply chain disruptions and the complexity of integrating diverse sensor systems into existing infrastructure also present challenges. However, ongoing technological innovations, leading to more cost-effective and efficient sensor solutions, are expected to mitigate these constraints. The market is witnessing a clear shift towards miniaturization, improved accuracy, and enhanced connectivity, which promise to further accelerate market expansion throughout the forecast period (2025-2033). Continuous innovation in sensor technology and the growing integration of sensors across multiple applications will shape the competitive landscape, fostering both consolidation and diversification within the market.
United States Sensors Market: A Comprehensive Report (2019-2033)
This insightful report provides a detailed analysis of the United States sensors market, encompassing market size, growth drivers, challenges, and future opportunities. The study period covers 2019-2033, with 2025 as the base and estimated year. This comprehensive analysis is essential for stakeholders seeking to understand the dynamics of this rapidly evolving market and make informed strategic decisions. The market is projected to reach xx Million by 2033, representing a significant growth opportunity.
United States Sensors Market Composition & Trends
This section dives deep into the competitive landscape of the US sensors market, examining market concentration, innovation drivers, regulatory influences, substitute products, key end-user segments, and merger & acquisition (M&A) activities. The report analyzes the market share distribution among key players, including Texas Instruments Incorporated, STMicroelectronics Inc, Honeywell International Inc, Infineon Technologies AG, TE Connectivity Inc, Rockwell Automation Inc, Bosch Sensortec GmbH, Omega Engineering Inc, Siemens AG, ams OSRAM AG, Sick AG, ABB Limited, Omron Corporation, and Allegro MicroSystems Inc.
- Market Concentration: The US sensors market exhibits a [Describe level of concentration - e.g., moderately concentrated] structure, with the top five players holding an estimated [xx]% market share in 2024.
- Innovation Catalysts: Technological advancements such as the Internet of Things (IoT), artificial intelligence (AI), and Industry 4.0 are driving significant innovation in sensor technologies, leading to the development of more sophisticated and specialized sensors.
- Regulatory Landscape: Government regulations concerning data privacy, cybersecurity, and product safety are shaping the market, influencing design and deployment strategies.
- Substitute Products: While sensors are unique in their functionalities, certain applications might leverage alternative technologies, impacting market growth in specific sectors. The report details these alternatives and their market penetration.
- End-User Profiles: The report categorizes end-users across various sectors, including automotive, industrial automation, healthcare, consumer electronics, and aerospace & defense, providing a granular understanding of each segment’s sensor needs.
- M&A Activities: The report analyzes recent M&A activities within the sector, including the deal values and strategic implications of key transactions, outlining their impact on market consolidation and technological advancements. For example, xx number of M&A deals were recorded between 2019 and 2024, with a total value of approximately xx Million.
United States Sensors Market Industry Evolution
This section provides a comprehensive analysis of the US sensors market's evolution, covering historical trends (2019-2024), present dynamics (2025), and future projections (2025-2033). The report examines growth trajectories, technological disruptions, and changing consumer demands, providing detailed data points such as compound annual growth rates (CAGR) and adoption rates for key sensor types. The market experienced a CAGR of xx% during the historical period (2019-2024), and is projected to grow at a CAGR of xx% during the forecast period (2025-2033). This growth is driven by increasing demand for smart devices, automation in industries, and the expansion of the IoT ecosystem. The report further details the impact of technological advancements such as miniaturization, improved accuracy, and enhanced connectivity on market growth. The shift towards advanced sensor technologies, such as LiDAR and advanced pressure sensors, is also analyzed in detail.
Leading Regions, Countries, or Segments in United States Sensors Market
This section identifies and analyzes the leading regions, countries, or segments within the United States sensors market. Detailed analysis will highlight the dominance of specific areas and explore the factors contributing to their leading position.
- Key Drivers:
- Significant investments in research and development (R&D) by both public and private sectors
- Favorable government policies and regulations promoting technological innovation and adoption.
- Strong presence of major sensor manufacturers and a robust supply chain
- High demand from key end-use industries like automotive and aerospace
- Dominance Factors: The report conducts an in-depth analysis of the reasons behind the dominance of the leading region/country/segment including factors like market size, growth rate, technological advancements, industry clusters, and supportive government initiatives. [Detailed Paragraph explaining the reasons behind the dominance – 600 words]
United States Sensors Market Product Innovations
Recent product innovations have significantly impacted the US sensors market. Companies are continuously introducing sensors with enhanced features, such as improved accuracy, higher resolution, smaller form factors, and wireless connectivity. These innovations cater to the increasing demand for data-driven decision-making in various applications across various industries. For example, TE Connectivity's new wireless pressure sensors, discussed in the key developments section, demonstrate a focus on efficient energy use and versatile application capabilities. These improvements are driving adoption across diverse sectors and further fueling market growth.
Propelling Factors for United States Sensors Market Growth
Several factors are contributing to the growth of the United States sensors market. Technological advancements, particularly in areas like IoT and AI, are driving the demand for sensors across various industries. Furthermore, increasing government investments in infrastructure development and automation projects are stimulating market growth. The rising demand for smart devices in the consumer electronics market and the growing adoption of advanced sensor technologies in the automotive sector also play a significant role.
Obstacles in the United States Sensors Market
Despite the promising growth outlook, several challenges are hindering the market's growth trajectory. The rising cost of sensor technologies, particularly in specialized applications, remains a considerable barrier. Supply chain disruptions, especially in the wake of geopolitical events, can impact the availability and price of sensors, limiting market expansion. Intense competition amongst various players can reduce profit margins. Finally, stringent regulatory requirements regarding data privacy and security may complicate implementation in certain sectors.
Future Opportunities in United States Sensors Market
The future of the US sensors market looks bright, with several promising opportunities emerging. The increasing integration of sensors in smart homes, smart cities, and wearable technology will drive significant growth in the consumer electronics sector. The rising demand for automation in industrial settings will also contribute to market expansion. Furthermore, advancements in sensor technology, such as miniaturization and improved energy efficiency, are paving the way for novel applications in various industries, presenting exciting opportunities for players in this dynamic market.
Major Players in the United States Sensors Market Ecosystem
- Texas Instruments Incorporated (Texas Instruments)
- STMicroelectronics Inc (STMicroelectronics)
- Honeywell International Inc (Honeywell)
- Infineon Technologies AG (Infineon Technologies)
- TE Connectivity Inc (TE Connectivity)
- Rockwell Automation Inc (Rockwell Automation)
- Bosch Sensortec GmbH (Bosch Sensortec)
- Omega Engineering Inc (Omega Engineering)
- Siemens AG (Siemens)
- ams OSRAM AG (ams OSRAM)
- Sick AG (Sick AG)
- ABB Limited (ABB)
- Omron Corporation (Omron)
- Allegro MicroSystems Inc (Allegro MicroSystems)
Key Developments in United States Sensors Market Industry
- April 2024: TE Connectivity expanded its product line with two advanced wireless pressure sensors (65xxN and 69xxN) designed for periodic condition monitoring. The 65xxN sensor utilizes BLE 5.3 technology for short-range applications, offering efficient battery life and adaptability.
- February 2024: STMicroelectronics launched an all-in-one, direct Time-of-Flight (dToF) 3D LiDAR module with a market-leading 2.3k resolution and secured an early design win for its smallest 500k-pixel indirect Time-of-Flight (iToF) sensor. These developments highlight advancements in 3D sensing technology.
Strategic United States Sensors Market Forecast
The US sensors market is poised for sustained growth driven by ongoing technological advancements, increasing automation across various sectors, and the expanding adoption of smart devices and connected systems. The continued miniaturization and improved accuracy of sensors, along with the rising demand for data-driven decision-making, create significant opportunities for market players. Future growth will depend on effectively addressing supply chain vulnerabilities and meeting evolving regulatory requirements. The market is projected to exhibit robust growth over the forecast period, fueled by these developments and increasing integration of sensors across diverse application areas.
United States Sensors Market Segmentation
-
1. Product Type
- 1.1. Temperature
- 1.2. Pressure
- 1.3. Level
- 1.4. Flow
- 1.5. Proximity
- 1.6. Environmental (Humidity, Gas and Combos)
- 1.7. Chemical
- 1.8. Inertial
-
1.9. Magnetic
- 1.9.1. Hall effect sensors
- 1.9.2. Other Magnetic Sensors
- 1.10. Position Sensors
- 1.11. Current Sensors
- 1.12. Other Types
-
2. Mode of Operation
- 2.1. Optical
- 2.2. Electrical Resistance
- 2.3. Biosensor
- 2.4. Piezoresistive
- 2.5. Image
- 2.6. Capacitive
- 2.7. Piezoelectric
- 2.8. LiDAR
- 2.9. Radar
- 2.10. Other Modes of Operations
-
3. End-user Industry
- 3.1. Automotive
- 3.2. Consumer Electronics
- 3.3. Energy
- 3.4. Industrial and Other
- 3.5. Medical and Wellness
- 3.6. Construction, Agriculture and Mining
- 3.7. Aerospace
- 3.8. Robotics
- 3.9. Other End-user Industries
United States Sensors Market Segmentation By Geography
- 1. United States
United States Sensors Market REPORT HIGHLIGHTS
| Aspects | Details |
|---|---|
| Study Period | 2019-2033 |
| Base Year | 2024 |
| Estimated Year | 2025 |
| Forecast Period | 2025-2033 |
| Historical Period | 2019-2024 |
| Growth Rate | CAGR of 7.79% from 2019-2033 |
| Segmentation |
|
Table of Contents
- 1. Introduction
- 1.1. Research Scope
- 1.2. Market Segmentation
- 1.3. Research Methodology
- 1.4. Definitions and Assumptions
- 2. Executive Summary
- 2.1. Introduction
- 3. Market Dynamics
- 3.1. Introduction
- 3.2. Market Drivers
- 3.2.1. Rising Demand for IoT and Connected Devices; Increasing Adoption of Advanced Sensor Technologies in Automotive Industry
- 3.3. Market Restrains
- 3.3.1. Rising Demand for IoT and Connected Devices; Increasing Adoption of Advanced Sensor Technologies in Automotive Industry
- 3.4. Market Trends
- 3.4.1. Environmental Sensors is Expected to Witness a Significant Growth
- 4. Market Factor Analysis
- 4.1. Porters Five Forces
- 4.2. Supply/Value Chain
- 4.3. PESTEL analysis
- 4.4. Market Entropy
- 4.5. Patent/Trademark Analysis
- 5. United States Sensors Market Analysis, Insights and Forecast, 2019-2031
- 5.1. Market Analysis, Insights and Forecast - by Product Type
- 5.1.1. Temperature
- 5.1.2. Pressure
- 5.1.3. Level
- 5.1.4. Flow
- 5.1.5. Proximity
- 5.1.6. Environmental (Humidity, Gas and Combos)
- 5.1.7. Chemical
- 5.1.8. Inertial
- 5.1.9. Magnetic
- 5.1.9.1. Hall effect sensors
- 5.1.9.2. Other Magnetic Sensors
- 5.1.10. Position Sensors
- 5.1.11. Current Sensors
- 5.1.12. Other Types
- 5.2. Market Analysis, Insights and Forecast - by Mode of Operation
- 5.2.1. Optical
- 5.2.2. Electrical Resistance
- 5.2.3. Biosensor
- 5.2.4. Piezoresistive
- 5.2.5. Image
- 5.2.6. Capacitive
- 5.2.7. Piezoelectric
- 5.2.8. LiDAR
- 5.2.9. Radar
- 5.2.10. Other Modes of Operations
- 5.3. Market Analysis, Insights and Forecast - by End-user Industry
- 5.3.1. Automotive
- 5.3.2. Consumer Electronics
- 5.3.3. Energy
- 5.3.4. Industrial and Other
- 5.3.5. Medical and Wellness
- 5.3.6. Construction, Agriculture and Mining
- 5.3.7. Aerospace
- 5.3.8. Robotics
- 5.3.9. Other End-user Industries
- 5.4. Market Analysis, Insights and Forecast - by Region
- 5.4.1. United States
- 5.1. Market Analysis, Insights and Forecast - by Product Type
- 6. Competitive Analysis
- 6.1. Market Share Analysis 2024
- 6.2. Company Profiles
- 6.2.1 Texas Instruments Incorporated
- 6.2.1.1. Overview
- 6.2.1.2. Products
- 6.2.1.3. SWOT Analysis
- 6.2.1.4. Recent Developments
- 6.2.1.5. Financials (Based on Availability)
- 6.2.2 STMicroelectronics Inc
- 6.2.2.1. Overview
- 6.2.2.2. Products
- 6.2.2.3. SWOT Analysis
- 6.2.2.4. Recent Developments
- 6.2.2.5. Financials (Based on Availability)
- 6.2.3 Honeywell International Inc
- 6.2.3.1. Overview
- 6.2.3.2. Products
- 6.2.3.3. SWOT Analysis
- 6.2.3.4. Recent Developments
- 6.2.3.5. Financials (Based on Availability)
- 6.2.4 Infineon Technologies AG
- 6.2.4.1. Overview
- 6.2.4.2. Products
- 6.2.4.3. SWOT Analysis
- 6.2.4.4. Recent Developments
- 6.2.4.5. Financials (Based on Availability)
- 6.2.5 TE Connectivity Inc
- 6.2.5.1. Overview
- 6.2.5.2. Products
- 6.2.5.3. SWOT Analysis
- 6.2.5.4. Recent Developments
- 6.2.5.5. Financials (Based on Availability)
- 6.2.6 Rockwell Automation Inc
- 6.2.6.1. Overview
- 6.2.6.2. Products
- 6.2.6.3. SWOT Analysis
- 6.2.6.4. Recent Developments
- 6.2.6.5. Financials (Based on Availability)
- 6.2.7 Bosch Sensortec GmbH
- 6.2.7.1. Overview
- 6.2.7.2. Products
- 6.2.7.3. SWOT Analysis
- 6.2.7.4. Recent Developments
- 6.2.7.5. Financials (Based on Availability)
- 6.2.8 Omega Engineering Inc
- 6.2.8.1. Overview
- 6.2.8.2. Products
- 6.2.8.3. SWOT Analysis
- 6.2.8.4. Recent Developments
- 6.2.8.5. Financials (Based on Availability)
- 6.2.9 Siemens AG
- 6.2.9.1. Overview
- 6.2.9.2. Products
- 6.2.9.3. SWOT Analysis
- 6.2.9.4. Recent Developments
- 6.2.9.5. Financials (Based on Availability)
- 6.2.10 ams OSRAM AG
- 6.2.10.1. Overview
- 6.2.10.2. Products
- 6.2.10.3. SWOT Analysis
- 6.2.10.4. Recent Developments
- 6.2.10.5. Financials (Based on Availability)
- 6.2.11 Sick AG
- 6.2.11.1. Overview
- 6.2.11.2. Products
- 6.2.11.3. SWOT Analysis
- 6.2.11.4. Recent Developments
- 6.2.11.5. Financials (Based on Availability)
- 6.2.12 ABB Limited
- 6.2.12.1. Overview
- 6.2.12.2. Products
- 6.2.12.3. SWOT Analysis
- 6.2.12.4. Recent Developments
- 6.2.12.5. Financials (Based on Availability)
- 6.2.13 Omron Corporation
- 6.2.13.1. Overview
- 6.2.13.2. Products
- 6.2.13.3. SWOT Analysis
- 6.2.13.4. Recent Developments
- 6.2.13.5. Financials (Based on Availability)
- 6.2.14 Allegro MicroSystems Inc
- 6.2.14.1. Overview
- 6.2.14.2. Products
- 6.2.14.3. SWOT Analysis
- 6.2.14.4. Recent Developments
- 6.2.14.5. Financials (Based on Availability)
- 6.2.1 Texas Instruments Incorporated
List of Figures
- Figure 1: United States Sensors Market Revenue Breakdown (Million, %) by Product 2024 & 2032
- Figure 2: United States Sensors Market Share (%) by Company 2024
List of Tables
- Table 1: United States Sensors Market Revenue Million Forecast, by Region 2019 & 2032
- Table 2: United States Sensors Market Volume Billion Forecast, by Region 2019 & 2032
- Table 3: United States Sensors Market Revenue Million Forecast, by Product Type 2019 & 2032
- Table 4: United States Sensors Market Volume Billion Forecast, by Product Type 2019 & 2032
- Table 5: United States Sensors Market Revenue Million Forecast, by Mode of Operation 2019 & 2032
- Table 6: United States Sensors Market Volume Billion Forecast, by Mode of Operation 2019 & 2032
- Table 7: United States Sensors Market Revenue Million Forecast, by End-user Industry 2019 & 2032
- Table 8: United States Sensors Market Volume Billion Forecast, by End-user Industry 2019 & 2032
- Table 9: United States Sensors Market Revenue Million Forecast, by Region 2019 & 2032
- Table 10: United States Sensors Market Volume Billion Forecast, by Region 2019 & 2032
- Table 11: United States Sensors Market Revenue Million Forecast, by Product Type 2019 & 2032
- Table 12: United States Sensors Market Volume Billion Forecast, by Product Type 2019 & 2032
- Table 13: United States Sensors Market Revenue Million Forecast, by Mode of Operation 2019 & 2032
- Table 14: United States Sensors Market Volume Billion Forecast, by Mode of Operation 2019 & 2032
- Table 15: United States Sensors Market Revenue Million Forecast, by End-user Industry 2019 & 2032
- Table 16: United States Sensors Market Volume Billion Forecast, by End-user Industry 2019 & 2032
- Table 17: United States Sensors Market Revenue Million Forecast, by Country 2019 & 2032
- Table 18: United States Sensors Market Volume Billion Forecast, by Country 2019 & 2032
Frequently Asked Questions
1. What is the projected Compound Annual Growth Rate (CAGR) of the United States Sensors Market?
The projected CAGR is approximately 7.79%.
2. Which companies are prominent players in the United States Sensors Market?
Key companies in the market include Texas Instruments Incorporated, STMicroelectronics Inc, Honeywell International Inc, Infineon Technologies AG, TE Connectivity Inc, Rockwell Automation Inc, Bosch Sensortec GmbH, Omega Engineering Inc, Siemens AG, ams OSRAM AG, Sick AG, ABB Limited, Omron Corporation, Allegro MicroSystems Inc.
3. What are the main segments of the United States Sensors Market?
The market segments include Product Type, Mode of Operation, End-user Industry.
4. Can you provide details about the market size?
The market size is estimated to be USD 28.93 Million as of 2022.
5. What are some drivers contributing to market growth?
Rising Demand for IoT and Connected Devices; Increasing Adoption of Advanced Sensor Technologies in Automotive Industry.
6. What are the notable trends driving market growth?
Environmental Sensors is Expected to Witness a Significant Growth.
7. Are there any restraints impacting market growth?
Rising Demand for IoT and Connected Devices; Increasing Adoption of Advanced Sensor Technologies in Automotive Industry.
8. Can you provide examples of recent developments in the market?
April 2024: TE Connectivity (TE) has expanded its product line by introducing two advanced wireless pressure sensors. The first, the 65xxN sensor, is tailored for short-range applications, while the second, the 69xxN sensor, is optimized for long-range coverage. Both sensors are crafted explicitly for periodic condition monitoring. Notably, the 65xxN sensor utilizes BLE (Bluetooth Low Energy) 5.3 technology, enabling seamless localized data collection and transmission. The 65xxN wireless pressure sensor leverages BLE technology for efficient battery performance and adaptability across diverse pressure conditions.
9. What pricing options are available for accessing the report?
Pricing options include single-user, multi-user, and enterprise licenses priced at USD 3800, USD 4500, and USD 5800 respectively.
10. Is the market size provided in terms of value or volume?
The market size is provided in terms of value, measured in Million and volume, measured in Billion.
11. Are there any specific market keywords associated with the report?
Yes, the market keyword associated with the report is "United States Sensors Market," which aids in identifying and referencing the specific market segment covered.
12. How do I determine which pricing option suits my needs best?
The pricing options vary based on user requirements and access needs. Individual users may opt for single-user licenses, while businesses requiring broader access may choose multi-user or enterprise licenses for cost-effective access to the report.
13. Are there any additional resources or data provided in the United States Sensors Market report?
While the report offers comprehensive insights, it's advisable to review the specific contents or supplementary materials provided to ascertain if additional resources or data are available.
14. How can I stay updated on further developments or reports in the United States Sensors Market?
To stay informed about further developments, trends, and reports in the United States Sensors Market, consider subscribing to industry newsletters, following relevant companies and organizations, or regularly checking reputable industry news sources and publications.
Methodology
Step 1 - Identification of Relevant Samples Size from Population Database


Step 2 - Approaches for Defining Global Market Size (Value, Volume* & Price*)

Note*: In applicable scenarios
Step 3 - Data Sources
Primary Research
- Web Analytics
- Survey Reports
- Research Institute
- Latest Research Reports
- Opinion Leaders
Secondary Research
- Annual Reports
- White Paper
- Latest Press Release
- Industry Association
- Paid Database
- Investor Presentations

Step 4 - Data Triangulation
Involves using different sources of information in order to increase the validity of a study
These sources are likely to be stakeholders in a program - participants, other researchers, program staff, other community members, and so on.
Then we put all data in single framework & apply various statistical tools to find out the dynamic on the market.
During the analysis stage, feedback from the stakeholder groups would be compared to determine areas of agreement as well as areas of divergence
