

Key Insights
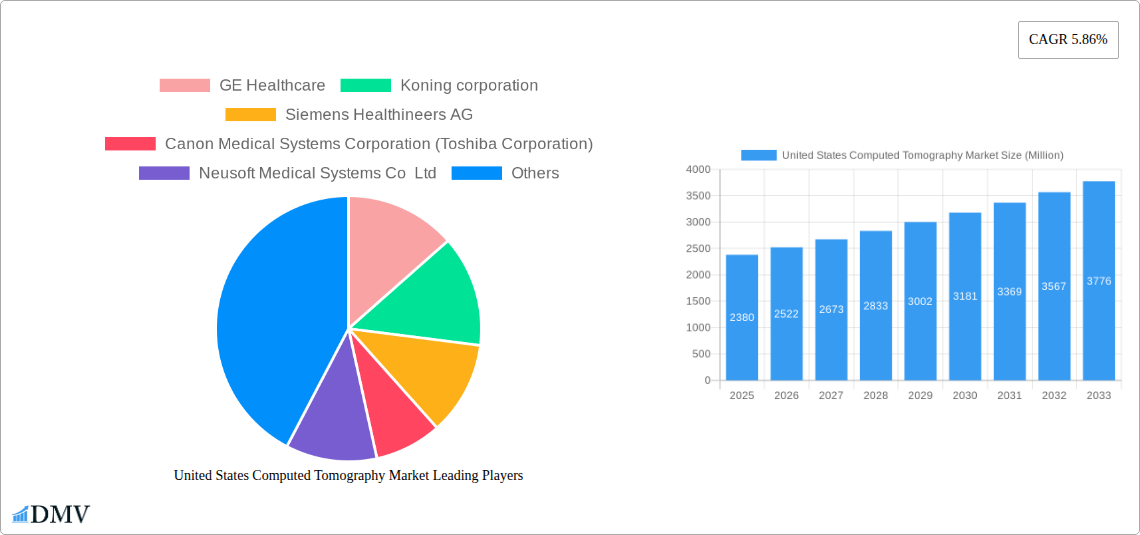
The United States Computed Tomography (CT) market, valued at approximately $2.38 billion in 2025, is poised for substantial growth, driven by several key factors. Technological advancements leading to faster scan times, improved image quality, and lower radiation doses are significantly increasing the adoption of CT scans across various medical specialties. The aging population and rising prevalence of chronic diseases like cancer, cardiovascular ailments, and neurological disorders are further fueling demand. Increased investments in healthcare infrastructure, particularly in advanced imaging technologies, are also contributing to market expansion. The market is segmented by slice type (low, medium, high), application (oncology, neurology, cardiovascular, musculoskeletal, and others), and end-user (hospitals, diagnostic centers, and others). Hospitals currently represent the largest segment, driven by their comprehensive diagnostic capabilities and the increasing need for rapid and accurate diagnoses. The high slice CT scanners segment is expected to witness faster growth due to their superior image resolution and ability to perform complex procedures.
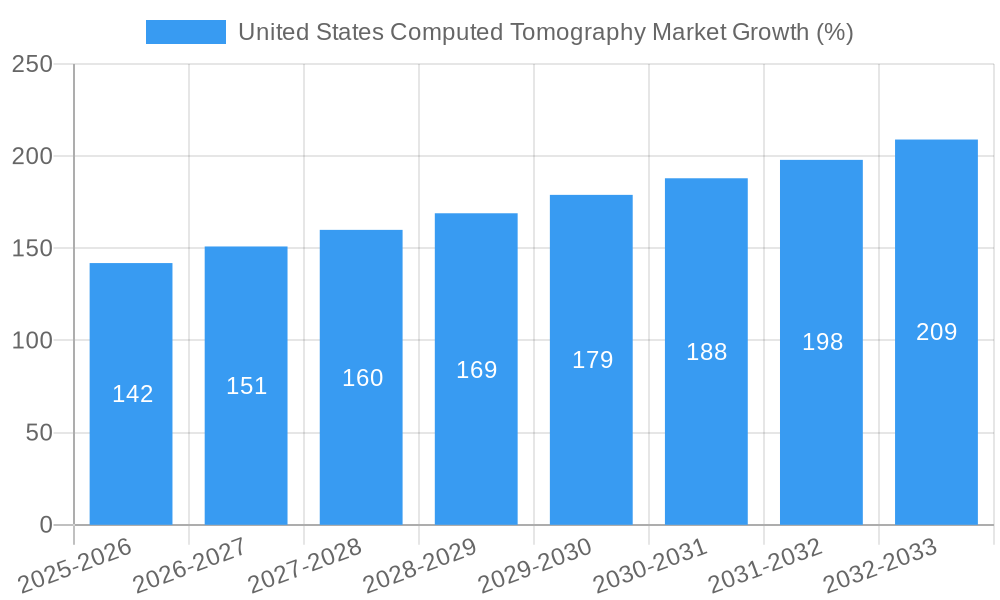
Competition in the US CT market is intense, with major players including GE Healthcare, Siemens Healthineers AG, Canon Medical Systems Corporation, and Philips vying for market share through technological innovation, strategic partnerships, and acquisitions. While pricing pressures and the rising costs of maintenance and service contracts represent potential restraints, the overall market outlook remains positive, projected to expand at a Compound Annual Growth Rate (CAGR) of 5.86% from 2025 to 2033. The increasing emphasis on preventative healthcare and the growing adoption of minimally invasive procedures, which often rely on CT guidance, are anticipated to further bolster market growth in the coming years. Geographic growth will largely be concentrated within the US, given the factors outlined above; however, other developed nations and rapidly developing economies could present potential opportunities for expansion.
United States Computed Tomography Market Report: 2019-2033
This comprehensive report provides a detailed analysis of the United States Computed Tomography (CT) market, offering invaluable insights for stakeholders across the medical imaging landscape. From market size and segmentation to technological advancements and future growth projections, this report covers all aspects of this dynamic industry. The study period spans from 2019 to 2033, with 2025 serving as the base and estimated year. The forecast period extends from 2025 to 2033, while the historical period encompasses 2019-2024. The market is valued at xx Million in 2025 and is projected to reach xx Million by 2033, exhibiting a CAGR of xx%.
United States Computed Tomography Market Composition & Trends
The United States Computed Tomography market is characterized by a moderate level of concentration, with key players holding significant market share. The market share distribution among the top five players in 2025 is estimated at approximately 60%, indicating a competitive yet consolidated landscape. Innovation is a critical driver, fueled by advancements in image processing, detector technology, and software algorithms. The regulatory landscape, primarily governed by the FDA, plays a crucial role in shaping market dynamics. Substitute products, such as MRI and ultrasound, exist but offer different imaging capabilities, thus limiting direct competition. The end-user profile consists mainly of hospitals and diagnostic centers, with a growing contribution from other end-users like ambulatory surgical centers. Mergers and acquisitions (M&A) activity has been moderate in recent years, with deal values averaging xx Million per transaction in the past three years (2022-2024).
- Market Concentration: Moderately Concentrated (Top 5 players hold ~60% market share in 2025).
- Innovation Catalysts: Advancements in image processing, detector technology, and AI-powered software.
- Regulatory Landscape: Primarily governed by FDA approvals and regulations.
- Substitute Products: MRI, Ultrasound (limited direct competition due to differing imaging capabilities).
- End-User Profile: Hospitals (55%), Diagnostic Centers (35%), Other End Users (10%) in 2025.
- M&A Activity: Moderate; Average deal value of xx Million (2022-2024).
United States Computed Tomography Market Industry Evolution
The US Computed Tomography market has witnessed consistent growth over the past few years, driven by factors such as increasing prevalence of chronic diseases, technological advancements, and rising healthcare expenditure. The market experienced a CAGR of xx% from 2019 to 2024 and is projected to maintain a robust growth trajectory throughout the forecast period (2025-2033). Technological advancements, such as multi-slice CT scanners, iterative reconstruction techniques, and AI-powered image analysis tools, have significantly enhanced image quality, reduced scan times, and improved diagnostic accuracy. Simultaneously, a growing preference for minimally invasive procedures and the rising demand for advanced imaging solutions are shaping consumer demand. The adoption rate of high-slice CT scanners is steadily increasing, driven by their superior image quality and diagnostic capabilities. The market is also witnessing the increasing integration of CT with other imaging modalities, such as PET and SPECT, to enhance diagnostic capabilities.
Leading Regions, Countries, or Segments in United States Computed Tomography Market
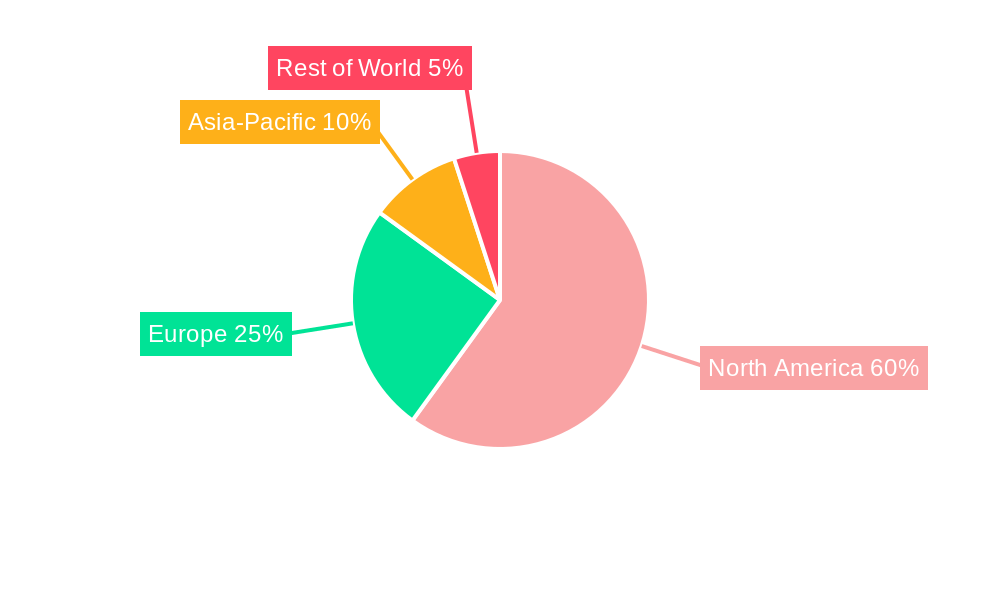
The market demonstrates strong regional variations in adoption and growth rates. While data is not publicly available for specific state-level breakdown, larger metropolitan areas with high population densities and established healthcare infrastructure consistently contribute higher proportions of the overall market volume. This includes areas like California, Texas, Florida, and New York. Analyzing the segments, the High-Slice CT segment is expected to lead in terms of growth rate owing to its enhanced image quality and diagnostic capabilities. Similarly, within applications, oncology, cardiology, and neurology demonstrate significant market traction due to the high prevalence of related diseases and the crucial role of CT imaging in diagnosis and treatment planning.
- Key Drivers for High-Slice CT Segment Dominance: Superior image quality, faster scan times, improved diagnostic accuracy, and increasing reimbursement rates.
- Key Drivers for Oncology Application Dominance: High prevalence of cancer, importance of CT in staging and treatment planning, and rising cancer screening rates.
- Hospitals and Diagnostic Centers: Major end-users, driven by high patient volumes and investment in advanced imaging technologies.
United States Computed Tomography Market Product Innovations
Recent innovations in CT technology include the development of dual-energy CT, which allows for improved tissue characterization and differentiation. Advances in iterative reconstruction techniques continue to improve image quality while reducing radiation dose. Furthermore, the integration of AI and machine learning algorithms is enhancing image analysis and providing more efficient workflows. The unique selling proposition of many advanced systems includes improved speed, lower radiation exposure, and more accurate diagnostic capabilities.
Propelling Factors for United States Computed Tomography Market Growth
Several factors propel the growth of the US Computed Tomography market. Technological advancements, such as the development of multi-slice CT scanners and advanced image processing techniques, lead to improved diagnostic accuracy and efficiency. The increasing prevalence of chronic diseases like cardiovascular disease and cancer necessitates advanced imaging technologies, driving market demand. Furthermore, rising healthcare expenditure and favorable government regulations support market growth. The adoption of value-based care models further emphasizes the importance of effective and efficient diagnostic tools, further boosting demand for advanced CT technology.
Obstacles in the United States Computed Tomography Market Market
The market faces some obstacles, including high costs associated with CT scanners and their maintenance. Supply chain disruptions and fluctuations in raw material prices can impact production costs and availability. Furthermore, intense competition among established players and emerging entrants can create pricing pressures. Regulatory hurdles associated with FDA approvals and reimbursement policies also pose challenges to market expansion and innovation. Strict regulations aimed at reducing radiation exposure can influence system design and adoption rates.
Future Opportunities in United States Computed Tomography Market
Future opportunities lie in the development and adoption of more advanced technologies such as AI-powered image analysis tools that improve diagnostic accuracy and efficiency. The increasing demand for mobile and point-of-care CT systems offers significant growth potential. Expansion into underserved areas and the integration of CT with other imaging modalities, such as PET and SPECT, will also create lucrative opportunities. Furthermore, the development of cost-effective and radiation-efficient CT scanners will cater to a wider range of healthcare providers.
Major Players in the United States Computed Tomography Market Ecosystem
- GE Healthcare
- Koning corporation
- Siemens Healthineers AG
- Canon Medical Systems Corporation (Toshiba Corporation)
- Neusoft Medical Systems Co Ltd
- Carestream Health
- Koninklijke Philips NV
- Stryker Corporation
- Planmeca Group (Planmed OY)
- Samsung Electronics Co Ltd
- Fujifilm Holdings Corporation
Key Developments in United States Computed Tomography Market Industry
- June 2022: Xoran Technologies receives a patent for a modular computed tomography (CT) system assembly, signifying advancements in point-of-care imaging.
- March 2022: NeuroLogica Corp's OmniTom Elite receives 510(k) approval, expanding access to mobile CT imaging solutions.
Strategic United States Computed Tomography Market Market Forecast
The US Computed Tomography market is poised for continued growth, driven by technological advancements, increasing prevalence of chronic diseases, and rising healthcare spending. The market's future success hinges on the adoption of innovative technologies like AI-powered image analysis and the development of cost-effective, radiation-efficient systems. The expansion of point-of-care and mobile CT solutions will further contribute to market expansion, creating substantial opportunities for growth in the coming years.
United States Computed Tomography Market Segmentation
-
1. Type
- 1.1. Low Slice
- 1.2. Medium Slice
- 1.3. High Slice
-
2. Application
- 2.1. Oncology
- 2.2. Neurology
- 2.3. Cardiovascular
- 2.4. Musculoskeletal
- 2.5. Other Applications
-
3. End User
- 3.1. Hospitals
- 3.2. Diagnostic Centers
- 3.3. Other End Users
United States Computed Tomography Market Segmentation By Geography
- 1. United States
United States Computed Tomography Market REPORT HIGHLIGHTS
| Aspects | Details |
|---|---|
| Study Period | 2019-2033 |
| Base Year | 2024 |
| Estimated Year | 2025 |
| Forecast Period | 2025-2033 |
| Historical Period | 2019-2024 |
| Growth Rate | CAGR of 5.86% from 2019-2033 |
| Segmentation |
|
Table of Contents
- 1. Introduction
- 1.1. Research Scope
- 1.2. Market Segmentation
- 1.3. Research Methodology
- 1.4. Definitions and Assumptions
- 2. Executive Summary
- 2.1. Introduction
- 3. Market Dynamics
- 3.1. Introduction
- 3.2. Market Drivers
- 3.2.1. Increasing Prevalence of Chronic Diseases; Rising Geriatric Population; Increasing Technological Advancements
- 3.3. Market Restrains
- 3.3.1. Lack Of Proper Reimbursement And Stringent Regulatory Approval Procedures; High Cost of Equipment
- 3.4. Market Trends
- 3.4.1. Oncology Segment is Expected to Hold a Significant Market Share Over the Forecast Period
- 4. Market Factor Analysis
- 4.1. Porters Five Forces
- 4.2. Supply/Value Chain
- 4.3. PESTEL analysis
- 4.4. Market Entropy
- 4.5. Patent/Trademark Analysis
- 5. United States Computed Tomography Market Analysis, Insights and Forecast, 2019-2031
- 5.1. Market Analysis, Insights and Forecast - by Type
- 5.1.1. Low Slice
- 5.1.2. Medium Slice
- 5.1.3. High Slice
- 5.2. Market Analysis, Insights and Forecast - by Application
- 5.2.1. Oncology
- 5.2.2. Neurology
- 5.2.3. Cardiovascular
- 5.2.4. Musculoskeletal
- 5.2.5. Other Applications
- 5.3. Market Analysis, Insights and Forecast - by End User
- 5.3.1. Hospitals
- 5.3.2. Diagnostic Centers
- 5.3.3. Other End Users
- 5.4. Market Analysis, Insights and Forecast - by Region
- 5.4.1. United States
- 5.1. Market Analysis, Insights and Forecast - by Type
- 6. United States United States Computed Tomography Market Analysis, Insights and Forecast, 2019-2031
- 7. Canada United States Computed Tomography Market Analysis, Insights and Forecast, 2019-2031
- 8. Mexico United States Computed Tomography Market Analysis, Insights and Forecast, 2019-2031
- 9. Competitive Analysis
- 9.1. Market Share Analysis 2024
- 9.2. Company Profiles
- 9.2.1 GE Healthcare
- 9.2.1.1. Overview
- 9.2.1.2. Products
- 9.2.1.3. SWOT Analysis
- 9.2.1.4. Recent Developments
- 9.2.1.5. Financials (Based on Availability)
- 9.2.2 Koning corporation
- 9.2.2.1. Overview
- 9.2.2.2. Products
- 9.2.2.3. SWOT Analysis
- 9.2.2.4. Recent Developments
- 9.2.2.5. Financials (Based on Availability)
- 9.2.3 Siemens Healthineers AG
- 9.2.3.1. Overview
- 9.2.3.2. Products
- 9.2.3.3. SWOT Analysis
- 9.2.3.4. Recent Developments
- 9.2.3.5. Financials (Based on Availability)
- 9.2.4 Canon Medical Systems Corporation (Toshiba Corporation)
- 9.2.4.1. Overview
- 9.2.4.2. Products
- 9.2.4.3. SWOT Analysis
- 9.2.4.4. Recent Developments
- 9.2.4.5. Financials (Based on Availability)
- 9.2.5 Neusoft Medical Systems Co Ltd
- 9.2.5.1. Overview
- 9.2.5.2. Products
- 9.2.5.3. SWOT Analysis
- 9.2.5.4. Recent Developments
- 9.2.5.5. Financials (Based on Availability)
- 9.2.6 Carestream Health
- 9.2.6.1. Overview
- 9.2.6.2. Products
- 9.2.6.3. SWOT Analysis
- 9.2.6.4. Recent Developments
- 9.2.6.5. Financials (Based on Availability)
- 9.2.7 Koninklijke Philips NV
- 9.2.7.1. Overview
- 9.2.7.2. Products
- 9.2.7.3. SWOT Analysis
- 9.2.7.4. Recent Developments
- 9.2.7.5. Financials (Based on Availability)
- 9.2.8 Stryker Corporation
- 9.2.8.1. Overview
- 9.2.8.2. Products
- 9.2.8.3. SWOT Analysis
- 9.2.8.4. Recent Developments
- 9.2.8.5. Financials (Based on Availability)
- 9.2.9 Planmeca Group (Planmed OY)
- 9.2.9.1. Overview
- 9.2.9.2. Products
- 9.2.9.3. SWOT Analysis
- 9.2.9.4. Recent Developments
- 9.2.9.5. Financials (Based on Availability)
- 9.2.10 Samsung Electronics Co Ltd
- 9.2.10.1. Overview
- 9.2.10.2. Products
- 9.2.10.3. SWOT Analysis
- 9.2.10.4. Recent Developments
- 9.2.10.5. Financials (Based on Availability)
- 9.2.11 Fujifilm Holdings Corporation
- 9.2.11.1. Overview
- 9.2.11.2. Products
- 9.2.11.3. SWOT Analysis
- 9.2.11.4. Recent Developments
- 9.2.11.5. Financials (Based on Availability)
- 9.2.1 GE Healthcare
List of Figures
- Figure 1: United States Computed Tomography Market Revenue Breakdown (Million, %) by Product 2024 & 2032
- Figure 2: United States Computed Tomography Market Share (%) by Company 2024
List of Tables
- Table 1: United States Computed Tomography Market Revenue Million Forecast, by Region 2019 & 2032
- Table 2: United States Computed Tomography Market Revenue Million Forecast, by Type 2019 & 2032
- Table 3: United States Computed Tomography Market Revenue Million Forecast, by Application 2019 & 2032
- Table 4: United States Computed Tomography Market Revenue Million Forecast, by End User 2019 & 2032
- Table 5: United States Computed Tomography Market Revenue Million Forecast, by Region 2019 & 2032
- Table 6: United States Computed Tomography Market Revenue Million Forecast, by Country 2019 & 2032
- Table 7: United States United States Computed Tomography Market Revenue (Million) Forecast, by Application 2019 & 2032
- Table 8: Canada United States Computed Tomography Market Revenue (Million) Forecast, by Application 2019 & 2032
- Table 9: Mexico United States Computed Tomography Market Revenue (Million) Forecast, by Application 2019 & 2032
- Table 10: United States Computed Tomography Market Revenue Million Forecast, by Type 2019 & 2032
- Table 11: United States Computed Tomography Market Revenue Million Forecast, by Application 2019 & 2032
- Table 12: United States Computed Tomography Market Revenue Million Forecast, by End User 2019 & 2032
- Table 13: United States Computed Tomography Market Revenue Million Forecast, by Country 2019 & 2032
Frequently Asked Questions
1. What is the projected Compound Annual Growth Rate (CAGR) of the United States Computed Tomography Market?
The projected CAGR is approximately 5.86%.
2. Which companies are prominent players in the United States Computed Tomography Market?
Key companies in the market include GE Healthcare, Koning corporation, Siemens Healthineers AG, Canon Medical Systems Corporation (Toshiba Corporation), Neusoft Medical Systems Co Ltd, Carestream Health, Koninklijke Philips NV, Stryker Corporation, Planmeca Group (Planmed OY), Samsung Electronics Co Ltd, Fujifilm Holdings Corporation.
3. What are the main segments of the United States Computed Tomography Market?
The market segments include Type, Application, End User.
4. Can you provide details about the market size?
The market size is estimated to be USD 2.38 Million as of 2022.
5. What are some drivers contributing to market growth?
Increasing Prevalence of Chronic Diseases; Rising Geriatric Population; Increasing Technological Advancements.
6. What are the notable trends driving market growth?
Oncology Segment is Expected to Hold a Significant Market Share Over the Forecast Period.
7. Are there any restraints impacting market growth?
Lack Of Proper Reimbursement And Stringent Regulatory Approval Procedures; High Cost of Equipment.
8. Can you provide examples of recent developments in the market?
In June 2022, Xoran Technologies, a United States-based company received a patent for a modular computed tomography (CT) system assembly. Together with our twenty and counting active patents, this ground-breaking cone beam CT arrangement opens up new possibilities. The innovation is just the start of a new line of point-of-care (POC) imaging equipment from Xoran.
9. What pricing options are available for accessing the report?
Pricing options include single-user, multi-user, and enterprise licenses priced at USD 3800, USD 4500, and USD 5800 respectively.
10. Is the market size provided in terms of value or volume?
The market size is provided in terms of value, measured in Million.
11. Are there any specific market keywords associated with the report?
Yes, the market keyword associated with the report is "United States Computed Tomography Market," which aids in identifying and referencing the specific market segment covered.
12. How do I determine which pricing option suits my needs best?
The pricing options vary based on user requirements and access needs. Individual users may opt for single-user licenses, while businesses requiring broader access may choose multi-user or enterprise licenses for cost-effective access to the report.
13. Are there any additional resources or data provided in the United States Computed Tomography Market report?
While the report offers comprehensive insights, it's advisable to review the specific contents or supplementary materials provided to ascertain if additional resources or data are available.
14. How can I stay updated on further developments or reports in the United States Computed Tomography Market?
To stay informed about further developments, trends, and reports in the United States Computed Tomography Market, consider subscribing to industry newsletters, following relevant companies and organizations, or regularly checking reputable industry news sources and publications.
Methodology
Step 1 - Identification of Relevant Samples Size from Population Database


Step 2 - Approaches for Defining Global Market Size (Value, Volume* & Price*)

Note*: In applicable scenarios
Step 3 - Data Sources
Primary Research
- Web Analytics
- Survey Reports
- Research Institute
- Latest Research Reports
- Opinion Leaders
Secondary Research
- Annual Reports
- White Paper
- Latest Press Release
- Industry Association
- Paid Database
- Investor Presentations

Step 4 - Data Triangulation
Involves using different sources of information in order to increase the validity of a study
These sources are likely to be stakeholders in a program - participants, other researchers, program staff, other community members, and so on.
Then we put all data in single framework & apply various statistical tools to find out the dynamic on the market.
During the analysis stage, feedback from the stakeholder groups would be compared to determine areas of agreement as well as areas of divergence
