

Key Insights
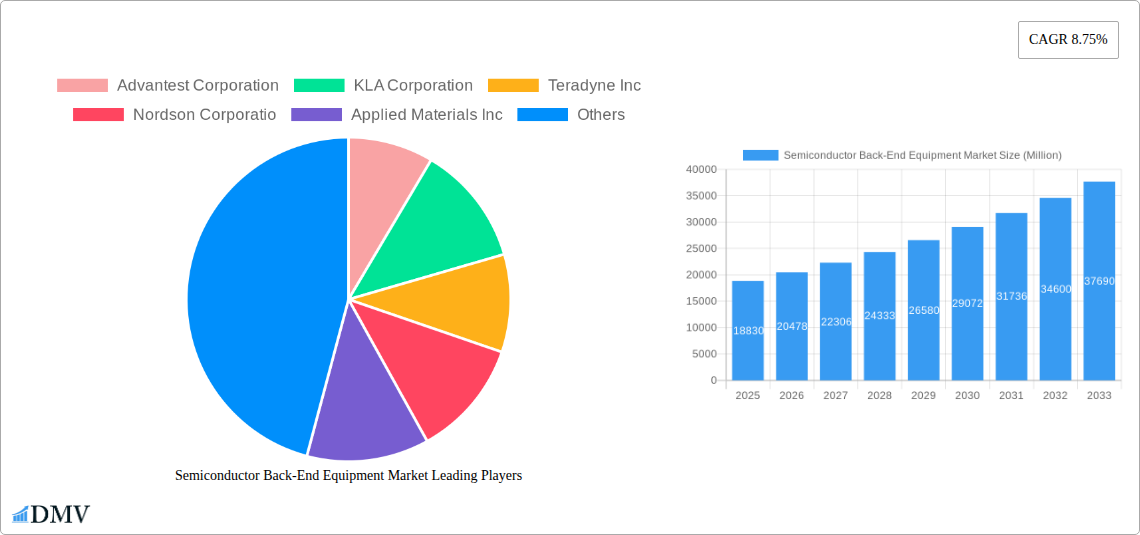
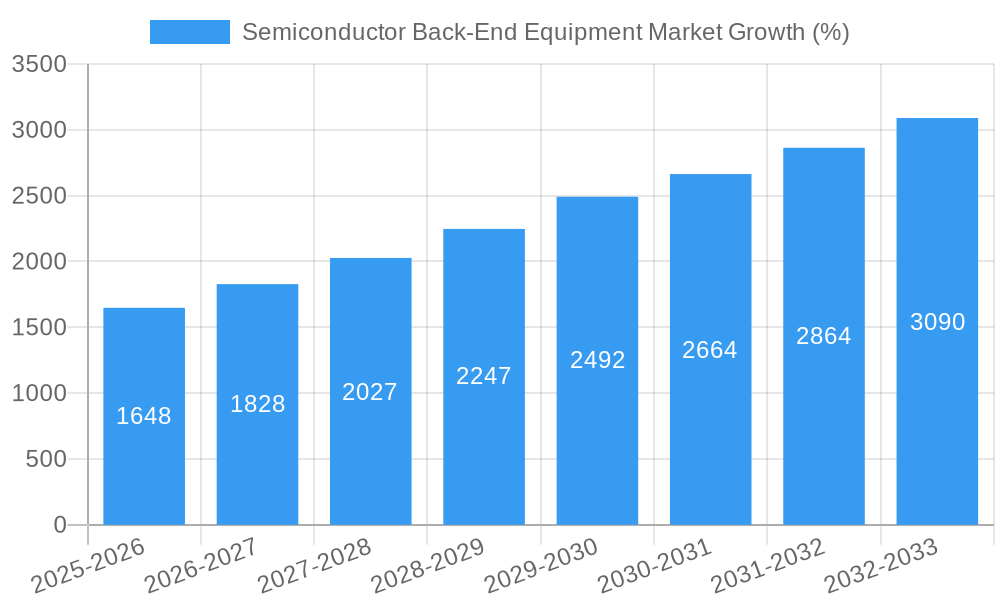
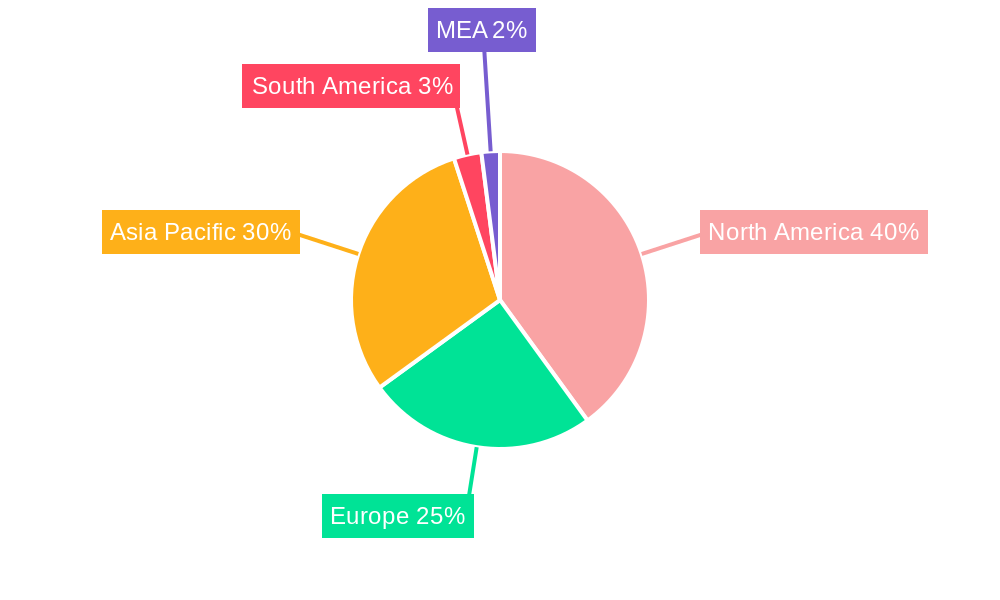
The semiconductor back-end equipment market, valued at $18.83 billion in 2025, is projected to experience robust growth, driven by the increasing demand for advanced semiconductor devices across various applications, including 5G infrastructure, artificial intelligence, and automotive electronics. The market's Compound Annual Growth Rate (CAGR) of 8.75% from 2025 to 2033 indicates a significant expansion in market size. Key drivers include advancements in miniaturization technologies, necessitating sophisticated equipment for precise processing, and the rising adoption of advanced packaging techniques like 3D stacking and system-in-package (SiP) solutions to enhance device performance and functionality. Furthermore, the increasing complexity of semiconductor manufacturing processes fuels demand for higher-precision metrology and inspection equipment. The market is segmented by type, including metrology and inspection, dicing, bonding, and assembly and packaging, each contributing to the overall growth, with metrology and inspection anticipated to hold a substantial market share due to stringent quality control requirements. Geographic regions such as North America and Asia-Pacific are expected to dominate the market due to the presence of major semiconductor manufacturers and substantial investments in research and development.
However, the market faces some restraints. The high cost of advanced equipment and the complexities involved in its implementation could limit adoption by smaller players. Furthermore, potential supply chain disruptions and geopolitical uncertainties pose risks to market growth. Despite these challenges, the long-term outlook for the semiconductor back-end equipment market remains positive, driven by the unrelenting demand for high-performance semiconductors and continuous advancements in semiconductor technology. Companies like Advantest, KLA, Teradyne, and Applied Materials are key players shaping this dynamic market landscape through innovation and strategic partnerships. The sustained focus on miniaturization, improved performance, and enhanced device reliability will continue to fuel demand for sophisticated back-end equipment solutions well into the forecast period.
This comprehensive report provides a detailed analysis of the Semiconductor Back-End Equipment Market, offering invaluable insights for stakeholders seeking to navigate this dynamic landscape. Covering the period 2019-2033, with a focus on 2025, this study unveils crucial market trends, technological advancements, and future opportunities.
Semiconductor Back-End Equipment Market Market Composition & Trends
The Semiconductor Back-End Equipment Market is characterized by a moderately concentrated landscape, with a few key players holding significant market share. The market is witnessing robust growth driven by the increasing demand for advanced semiconductor devices in various end-user sectors, including consumer electronics, automotive, and data centers. Innovation is a critical catalyst, with continuous advancements in packaging technologies, such as 3D integration and advanced packaging solutions, driving market expansion. The regulatory landscape, while generally supportive of technological advancements, faces complexities related to export controls and intellectual property protection. Substitute products are limited, given the specialized nature of back-end equipment. The market is primarily driven by the end-user demand for high-performance, energy-efficient chips. Mergers and acquisitions (M&A) activity has been significant, with larger players acquiring smaller companies to expand their product portfolios and market reach. In 2024, the total M&A deal value in the semiconductor equipment sector was estimated to be approximately $XX Million, showcasing the industry's consolidation trend. Market share distribution reflects this trend, with the top five players holding approximately XX% of the global market.
- Market Concentration: Moderately concentrated, with top 5 players holding approximately XX% market share.
- Innovation Catalysts: Advancements in 3D integration, advanced packaging, and AI-driven automation.
- Regulatory Landscape: Complexities related to export controls and intellectual property protection.
- Substitute Products: Limited due to specialized nature of back-end equipment.
- End-User Profiles: Consumer electronics, automotive, data centers, and industrial automation.
- M&A Activity: Significant, with total deal value estimated at $XX Million in 2024.
Semiconductor Back-End Equipment Market Industry Evolution
The Semiconductor Back-End Equipment Market has experienced significant growth over the historical period (2019-2024), with a Compound Annual Growth Rate (CAGR) of approximately XX%. This growth is projected to continue during the forecast period (2025-2033), albeit at a slightly moderated pace, with a projected CAGR of XX%. This moderation reflects the cyclical nature of the semiconductor industry and potential short-term fluctuations in demand. However, long-term growth drivers, such as the increasing adoption of 5G technology, the proliferation of IoT devices, and the expansion of high-performance computing, are expected to fuel sustained market expansion. Technological advancements, particularly in areas like advanced packaging and AI-driven automation, are significantly impacting market growth trajectories. Consumer demands for smaller, faster, and more energy-efficient devices are pushing the industry towards innovative solutions, which in turn drive the demand for sophisticated back-end equipment. The adoption rate of advanced packaging technologies is increasing steadily, with an estimated XX% market penetration in 2025, projected to rise to XX% by 2033.
Leading Regions, Countries, or Segments in Semiconductor Back-End Equipment Market
The Asia-Pacific region, particularly Taiwan, South Korea, and China, currently dominates the Semiconductor Back-End Equipment Market, driven by a high concentration of semiconductor fabrication facilities and significant government investments in the industry.
- Key Drivers in Asia-Pacific:
- Massive investments in semiconductor manufacturing capacity.
- Strong government support and incentives for technological advancements.
- High concentration of leading semiconductor companies.
- Robust domestic demand for consumer electronics and other semiconductor-based products.
The dominance of the Asia-Pacific region is further amplified by the strong growth in the Metrology and Inspection segment. This segment's growth is fueled by the need for precise and efficient quality control measures in high-volume manufacturing environments. The increasing complexity of semiconductor devices necessitates advanced metrology techniques for defect detection and yield improvement, driving continuous demand for sophisticated inspection equipment.
- Dominance Factors:
- Growing demand for high-precision inspection and measurement tools.
- Stringent quality control requirements in advanced semiconductor manufacturing.
- Continuous advancements in metrology technologies, such as AI-powered defect detection.
Other segments, such as Dicing, Bonding, and Assembly & Packaging, also contribute significantly to the market's overall growth, with regional variations in adoption rates and growth potential.
Semiconductor Back-End Equipment Market Product Innovations
Recent years have witnessed significant product innovations in the Semiconductor Back-End Equipment Market, characterized by improved precision, higher throughput, and increased automation capabilities. Manufacturers are incorporating advanced technologies such as artificial intelligence (AI) and machine learning (ML) to enhance equipment performance, optimize processes, and minimize defects. For instance, the introduction of laser-based lift-off technologies for 3D packaging represents a key advancement, enabling the creation of more complex and efficient integrated circuits. These innovations are driven by the demand for higher performance, smaller form factor, and lower power consumption in various electronic devices. Unique selling propositions include higher throughput, reduced processing times, improved yield rates, and advanced process control capabilities. These advancements directly translate to improved efficiency and profitability for semiconductor manufacturers.
Propelling Factors for Semiconductor Back-End Equipment Market Growth
The growth of the Semiconductor Back-End Equipment Market is fueled by several key factors: The increasing demand for advanced semiconductor devices in various applications, such as 5G, AI, and IoT, is a major driver. Technological advancements, including 3D packaging and advanced process control techniques, enhance manufacturing efficiency and enable the production of more complex chips. Government initiatives and financial incentives aimed at boosting domestic semiconductor manufacturing capacity further contribute to market growth. The ongoing trend toward miniaturization and increased performance requirements also fuels the demand for sophisticated back-end equipment.
Obstacles in the Semiconductor Back-End Equipment Market Market
The Semiconductor Back-End Equipment Market faces several challenges, including the cyclical nature of the semiconductor industry, which leads to fluctuating demand. Supply chain disruptions, caused by geopolitical events or natural disasters, can impact the availability of critical components and materials. Intense competition among established players and the emergence of new entrants create pressure on pricing and profitability. Strict regulatory requirements related to environmental compliance and safety standards add to the operational costs. The increasing complexity of semiconductor devices and the need for highly specialized equipment pose further challenges for manufacturers.
Future Opportunities in Semiconductor Back-End Equipment Market
The Semiconductor Back-End Equipment Market presents significant future opportunities. The growing demand for advanced packaging technologies, such as 3D integration and heterogeneous integration, will drive innovation and market expansion. The emergence of new applications in areas like automotive electronics, wearable devices, and medical implants creates new market segments. The development and adoption of AI-powered automation solutions will enhance efficiency and improve productivity. Focusing on sustainable manufacturing practices and environmentally friendly materials will attract environmentally conscious customers.
Major Players in the Semiconductor Back-End Equipment Market Ecosystem
- Advantest Corporation
- KLA Corporation
- Teradyne Inc
- Nordson Corporation
- Applied Materials Inc
- ASML Holding N V
- Screen Holdings Co Ltd
- Onto Innovation Inc
- Tokyo Electron Limited
- LAM Research Corporation
Key Developments in Semiconductor Back-End Equipment Market Industry
- December 2023: Tokyo Electron announced the development of Extreme Laser Lift Off (XLO) technology for 3D integration of advanced semiconductor devices. This innovation significantly advances 3D packaging capabilities.
- December 2023: Advantest Corporation unveiled the HA1200 die-level handler and a 2-kW active thermal control option for the M487x handler series, addressing the needs of the AI and HPC markets. These products improve testing efficiency and yield for advanced packaging technologies.
Strategic Semiconductor Back-End Equipment Market Market Forecast
The Semiconductor Back-End Equipment Market is poised for continued growth, driven by the relentless demand for advanced semiconductor devices and ongoing technological advancements. The increasing adoption of advanced packaging techniques, coupled with the expansion of high-growth sectors like AI and 5G, will fuel market expansion. Emerging opportunities in new applications and the development of sustainable manufacturing practices will further contribute to the market's positive outlook. The market's robust growth trajectory indicates significant potential for stakeholders willing to embrace innovation and adapt to evolving industry dynamics.
Semiconductor Back-End Equipment Market Segmentation
-
1. Type
- 1.1. Metrology and Inspection
- 1.2. Dicing
- 1.3. Bonding
- 1.4. Assembly and Packaging
-
2. End-Use Industry
- 2.1. Semiconductors
- 2.2. Electronics
- 2.3. Automotive
- 2.4. Medical
- 2.5. Defense
Semiconductor Back-End Equipment Market Segmentation By Geography
- 1. United States
- 2. Europe
- 3. China
- 4. South Korea
- 5. Taiwan
- 6. Japan
- 7. Rest of the Asia Pacific
- 8. Rest of the World
Semiconductor Back-End Equipment Market REPORT HIGHLIGHTS
| Aspects | Details |
|---|---|
| Study Period | 2019-2033 |
| Base Year | 2024 |
| Estimated Year | 2025 |
| Forecast Period | 2025-2033 |
| Historical Period | 2019-2024 |
| Growth Rate | CAGR of 8.75% from 2019-2033 |
| Segmentation |
|
Table of Contents
- 1. Introduction
- 1.1. Research Scope
- 1.2. Market Segmentation
- 1.3. Research Methodology
- 1.4. Definitions and Assumptions
- 2. Executive Summary
- 2.1. Introduction
- 3. Market Dynamics
- 3.1. Introduction
- 3.2. Market Drivers
- 3.2.1. Increasing Demand for Semiconductors in Electric and Hybrid Vehicles; Demand for Setting Up New Foundries (International Chip Shortage)
- 3.3. Market Restrains
- 3.3.1. High Setup Costs; Constant Evolution of Products Influencing Demand
- 3.4. Market Trends
- 3.4.1. Assembly and Packaging Segment is Expected to Witness Significant Growth
- 4. Market Factor Analysis
- 4.1. Porters Five Forces
- 4.2. Supply/Value Chain
- 4.3. PESTEL analysis
- 4.4. Market Entropy
- 4.5. Patent/Trademark Analysis
- 5. Global Semiconductor Back-End Equipment Market Analysis, Insights and Forecast, 2019-2031
- 5.1. Market Analysis, Insights and Forecast - by Type
- 5.1.1. Metrology and Inspection
- 5.1.2. Dicing
- 5.1.3. Bonding
- 5.1.4. Assembly and Packaging
- 5.2. Market Analysis, Insights and Forecast - by End-Use Industry
- 5.2.1. Semiconductors
- 5.2.2. Electronics
- 5.2.3. Automotive
- 5.2.4. Medical
- 5.2.5. Defense
- 5.3. Market Analysis, Insights and Forecast - by Region
- 5.3.1. United States
- 5.3.2. Europe
- 5.3.3. China
- 5.3.4. South Korea
- 5.3.5. Taiwan
- 5.3.6. Japan
- 5.3.7. Rest of the Asia Pacific
- 5.3.8. Rest of the World
- 5.1. Market Analysis, Insights and Forecast - by Type
- 6. United States Semiconductor Back-End Equipment Market Analysis, Insights and Forecast, 2019-2031
- 6.1. Market Analysis, Insights and Forecast - by Type
- 6.1.1. Metrology and Inspection
- 6.1.2. Dicing
- 6.1.3. Bonding
- 6.1.4. Assembly and Packaging
- 6.2. Market Analysis, Insights and Forecast - by End-Use Industry
- 6.2.1. Semiconductors
- 6.2.2. Electronics
- 6.2.3. Automotive
- 6.2.4. Medical
- 6.2.5. Defense
- 6.1. Market Analysis, Insights and Forecast - by Type
- 7. Europe Semiconductor Back-End Equipment Market Analysis, Insights and Forecast, 2019-2031
- 7.1. Market Analysis, Insights and Forecast - by Type
- 7.1.1. Metrology and Inspection
- 7.1.2. Dicing
- 7.1.3. Bonding
- 7.1.4. Assembly and Packaging
- 7.2. Market Analysis, Insights and Forecast - by End-Use Industry
- 7.2.1. Semiconductors
- 7.2.2. Electronics
- 7.2.3. Automotive
- 7.2.4. Medical
- 7.2.5. Defense
- 7.1. Market Analysis, Insights and Forecast - by Type
- 8. China Semiconductor Back-End Equipment Market Analysis, Insights and Forecast, 2019-2031
- 8.1. Market Analysis, Insights and Forecast - by Type
- 8.1.1. Metrology and Inspection
- 8.1.2. Dicing
- 8.1.3. Bonding
- 8.1.4. Assembly and Packaging
- 8.2. Market Analysis, Insights and Forecast - by End-Use Industry
- 8.2.1. Semiconductors
- 8.2.2. Electronics
- 8.2.3. Automotive
- 8.2.4. Medical
- 8.2.5. Defense
- 8.1. Market Analysis, Insights and Forecast - by Type
- 9. South Korea Semiconductor Back-End Equipment Market Analysis, Insights and Forecast, 2019-2031
- 9.1. Market Analysis, Insights and Forecast - by Type
- 9.1.1. Metrology and Inspection
- 9.1.2. Dicing
- 9.1.3. Bonding
- 9.1.4. Assembly and Packaging
- 9.2. Market Analysis, Insights and Forecast - by End-Use Industry
- 9.2.1. Semiconductors
- 9.2.2. Electronics
- 9.2.3. Automotive
- 9.2.4. Medical
- 9.2.5. Defense
- 9.1. Market Analysis, Insights and Forecast - by Type
- 10. Taiwan Semiconductor Back-End Equipment Market Analysis, Insights and Forecast, 2019-2031
- 10.1. Market Analysis, Insights and Forecast - by Type
- 10.1.1. Metrology and Inspection
- 10.1.2. Dicing
- 10.1.3. Bonding
- 10.1.4. Assembly and Packaging
- 10.2. Market Analysis, Insights and Forecast - by End-Use Industry
- 10.2.1. Semiconductors
- 10.2.2. Electronics
- 10.2.3. Automotive
- 10.2.4. Medical
- 10.2.5. Defense
- 10.1. Market Analysis, Insights and Forecast - by Type
- 11. Japan Semiconductor Back-End Equipment Market Analysis, Insights and Forecast, 2019-2031
- 11.1. Market Analysis, Insights and Forecast - by Type
- 11.1.1. Metrology and Inspection
- 11.1.2. Dicing
- 11.1.3. Bonding
- 11.1.4. Assembly and Packaging
- 11.2. Market Analysis, Insights and Forecast - by End-Use Industry
- 11.2.1. Semiconductors
- 11.2.2. Electronics
- 11.2.3. Automotive
- 11.2.4. Medical
- 11.2.5. Defense
- 11.1. Market Analysis, Insights and Forecast - by Type
- 12. Rest of the Asia Pacific Semiconductor Back-End Equipment Market Analysis, Insights and Forecast, 2019-2031
- 12.1. Market Analysis, Insights and Forecast - by Type
- 12.1.1. Metrology and Inspection
- 12.1.2. Dicing
- 12.1.3. Bonding
- 12.1.4. Assembly and Packaging
- 12.2. Market Analysis, Insights and Forecast - by End-Use Industry
- 12.2.1. Semiconductors
- 12.2.2. Electronics
- 12.2.3. Automotive
- 12.2.4. Medical
- 12.2.5. Defense
- 12.1. Market Analysis, Insights and Forecast - by Type
- 13. Rest of the World Semiconductor Back-End Equipment Market Analysis, Insights and Forecast, 2019-2031
- 13.1. Market Analysis, Insights and Forecast - by Type
- 13.1.1. Metrology and Inspection
- 13.1.2. Dicing
- 13.1.3. Bonding
- 13.1.4. Assembly and Packaging
- 13.2. Market Analysis, Insights and Forecast - by End-Use Industry
- 13.2.1. Semiconductors
- 13.2.2. Electronics
- 13.2.3. Automotive
- 13.2.4. Medical
- 13.2.5. Defense
- 13.1. Market Analysis, Insights and Forecast - by Type
- 14. North America Semiconductor Back-End Equipment Market Analysis, Insights and Forecast, 2019-2031
- 14.1. Market Analysis, Insights and Forecast - By Country/Sub-region
- 14.1.1 United States
- 14.1.2 Canada
- 14.1.3 Mexico
- 15. Europe Semiconductor Back-End Equipment Market Analysis, Insights and Forecast, 2019-2031
- 15.1. Market Analysis, Insights and Forecast - By Country/Sub-region
- 15.1.1 Germany
- 15.1.2 United Kingdom
- 15.1.3 France
- 15.1.4 Spain
- 15.1.5 Italy
- 15.1.6 Spain
- 15.1.7 Belgium
- 15.1.8 Netherland
- 15.1.9 Nordics
- 15.1.10 Rest of Europe
- 16. Asia Pacific Semiconductor Back-End Equipment Market Analysis, Insights and Forecast, 2019-2031
- 16.1. Market Analysis, Insights and Forecast - By Country/Sub-region
- 16.1.1 China
- 16.1.2 Japan
- 16.1.3 India
- 16.1.4 South Korea
- 16.1.5 Southeast Asia
- 16.1.6 Australia
- 16.1.7 Indonesia
- 16.1.8 Phillipes
- 16.1.9 Singapore
- 16.1.10 Thailandc
- 16.1.11 Rest of Asia Pacific
- 17. South America Semiconductor Back-End Equipment Market Analysis, Insights and Forecast, 2019-2031
- 17.1. Market Analysis, Insights and Forecast - By Country/Sub-region
- 17.1.1 Brazil
- 17.1.2 Argentina
- 17.1.3 Peru
- 17.1.4 Chile
- 17.1.5 Colombia
- 17.1.6 Ecuador
- 17.1.7 Venezuela
- 17.1.8 Rest of South America
- 18. North America Semiconductor Back-End Equipment Market Analysis, Insights and Forecast, 2019-2031
- 18.1. Market Analysis, Insights and Forecast - By Country/Sub-region
- 18.1.1 United States
- 18.1.2 Canada
- 18.1.3 Mexico
- 19. MEA Semiconductor Back-End Equipment Market Analysis, Insights and Forecast, 2019-2031
- 19.1. Market Analysis, Insights and Forecast - By Country/Sub-region
- 19.1.1 United Arab Emirates
- 19.1.2 Saudi Arabia
- 19.1.3 South Africa
- 19.1.4 Rest of Middle East and Africa
- 20. Competitive Analysis
- 20.1. Global Market Share Analysis 2024
- 20.2. Company Profiles
- 20.2.1 Advantest Corporation
- 20.2.1.1. Overview
- 20.2.1.2. Products
- 20.2.1.3. SWOT Analysis
- 20.2.1.4. Recent Developments
- 20.2.1.5. Financials (Based on Availability)
- 20.2.2 KLA Corporation
- 20.2.2.1. Overview
- 20.2.2.2. Products
- 20.2.2.3. SWOT Analysis
- 20.2.2.4. Recent Developments
- 20.2.2.5. Financials (Based on Availability)
- 20.2.3 Teradyne Inc
- 20.2.3.1. Overview
- 20.2.3.2. Products
- 20.2.3.3. SWOT Analysis
- 20.2.3.4. Recent Developments
- 20.2.3.5. Financials (Based on Availability)
- 20.2.4 Nordson Corporatio
- 20.2.4.1. Overview
- 20.2.4.2. Products
- 20.2.4.3. SWOT Analysis
- 20.2.4.4. Recent Developments
- 20.2.4.5. Financials (Based on Availability)
- 20.2.5 Applied Materials Inc
- 20.2.5.1. Overview
- 20.2.5.2. Products
- 20.2.5.3. SWOT Analysis
- 20.2.5.4. Recent Developments
- 20.2.5.5. Financials (Based on Availability)
- 20.2.6 ASML Holding N V
- 20.2.6.1. Overview
- 20.2.6.2. Products
- 20.2.6.3. SWOT Analysis
- 20.2.6.4. Recent Developments
- 20.2.6.5. Financials (Based on Availability)
- 20.2.7 Screen Holdings Co Ltd
- 20.2.7.1. Overview
- 20.2.7.2. Products
- 20.2.7.3. SWOT Analysis
- 20.2.7.4. Recent Developments
- 20.2.7.5. Financials (Based on Availability)
- 20.2.8 Onto Innovation Inc
- 20.2.8.1. Overview
- 20.2.8.2. Products
- 20.2.8.3. SWOT Analysis
- 20.2.8.4. Recent Developments
- 20.2.8.5. Financials (Based on Availability)
- 20.2.9 Tokyo Electron Limited
- 20.2.9.1. Overview
- 20.2.9.2. Products
- 20.2.9.3. SWOT Analysis
- 20.2.9.4. Recent Developments
- 20.2.9.5. Financials (Based on Availability)
- 20.2.10 LAM Research Corporation
- 20.2.10.1. Overview
- 20.2.10.2. Products
- 20.2.10.3. SWOT Analysis
- 20.2.10.4. Recent Developments
- 20.2.10.5. Financials (Based on Availability)
- 20.2.1 Advantest Corporation
List of Figures
- Figure 1: Global Semiconductor Back-End Equipment Market Revenue Breakdown (Million, %) by Region 2024 & 2032
- Figure 2: Global Semiconductor Back-End Equipment Market Volume Breakdown (K Unit, %) by Region 2024 & 2032
- Figure 3: North America Semiconductor Back-End Equipment Market Revenue (Million), by Country 2024 & 2032
- Figure 4: North America Semiconductor Back-End Equipment Market Volume (K Unit), by Country 2024 & 2032
- Figure 5: North America Semiconductor Back-End Equipment Market Revenue Share (%), by Country 2024 & 2032
- Figure 6: North America Semiconductor Back-End Equipment Market Volume Share (%), by Country 2024 & 2032
- Figure 7: Europe Semiconductor Back-End Equipment Market Revenue (Million), by Country 2024 & 2032
- Figure 8: Europe Semiconductor Back-End Equipment Market Volume (K Unit), by Country 2024 & 2032
- Figure 9: Europe Semiconductor Back-End Equipment Market Revenue Share (%), by Country 2024 & 2032
- Figure 10: Europe Semiconductor Back-End Equipment Market Volume Share (%), by Country 2024 & 2032
- Figure 11: Asia Pacific Semiconductor Back-End Equipment Market Revenue (Million), by Country 2024 & 2032
- Figure 12: Asia Pacific Semiconductor Back-End Equipment Market Volume (K Unit), by Country 2024 & 2032
- Figure 13: Asia Pacific Semiconductor Back-End Equipment Market Revenue Share (%), by Country 2024 & 2032
- Figure 14: Asia Pacific Semiconductor Back-End Equipment Market Volume Share (%), by Country 2024 & 2032
- Figure 15: South America Semiconductor Back-End Equipment Market Revenue (Million), by Country 2024 & 2032
- Figure 16: South America Semiconductor Back-End Equipment Market Volume (K Unit), by Country 2024 & 2032
- Figure 17: South America Semiconductor Back-End Equipment Market Revenue Share (%), by Country 2024 & 2032
- Figure 18: South America Semiconductor Back-End Equipment Market Volume Share (%), by Country 2024 & 2032
- Figure 19: North America Semiconductor Back-End Equipment Market Revenue (Million), by Country 2024 & 2032
- Figure 20: North America Semiconductor Back-End Equipment Market Volume (K Unit), by Country 2024 & 2032
- Figure 21: North America Semiconductor Back-End Equipment Market Revenue Share (%), by Country 2024 & 2032
- Figure 22: North America Semiconductor Back-End Equipment Market Volume Share (%), by Country 2024 & 2032
- Figure 23: MEA Semiconductor Back-End Equipment Market Revenue (Million), by Country 2024 & 2032
- Figure 24: MEA Semiconductor Back-End Equipment Market Volume (K Unit), by Country 2024 & 2032
- Figure 25: MEA Semiconductor Back-End Equipment Market Revenue Share (%), by Country 2024 & 2032
- Figure 26: MEA Semiconductor Back-End Equipment Market Volume Share (%), by Country 2024 & 2032
- Figure 27: United States Semiconductor Back-End Equipment Market Revenue (Million), by Type 2024 & 2032
- Figure 28: United States Semiconductor Back-End Equipment Market Volume (K Unit), by Type 2024 & 2032
- Figure 29: United States Semiconductor Back-End Equipment Market Revenue Share (%), by Type 2024 & 2032
- Figure 30: United States Semiconductor Back-End Equipment Market Volume Share (%), by Type 2024 & 2032
- Figure 31: United States Semiconductor Back-End Equipment Market Revenue (Million), by End-Use Industry 2024 & 2032
- Figure 32: United States Semiconductor Back-End Equipment Market Volume (K Unit), by End-Use Industry 2024 & 2032
- Figure 33: United States Semiconductor Back-End Equipment Market Revenue Share (%), by End-Use Industry 2024 & 2032
- Figure 34: United States Semiconductor Back-End Equipment Market Volume Share (%), by End-Use Industry 2024 & 2032
- Figure 35: United States Semiconductor Back-End Equipment Market Revenue (Million), by Country 2024 & 2032
- Figure 36: United States Semiconductor Back-End Equipment Market Volume (K Unit), by Country 2024 & 2032
- Figure 37: United States Semiconductor Back-End Equipment Market Revenue Share (%), by Country 2024 & 2032
- Figure 38: United States Semiconductor Back-End Equipment Market Volume Share (%), by Country 2024 & 2032
- Figure 39: Europe Semiconductor Back-End Equipment Market Revenue (Million), by Type 2024 & 2032
- Figure 40: Europe Semiconductor Back-End Equipment Market Volume (K Unit), by Type 2024 & 2032
- Figure 41: Europe Semiconductor Back-End Equipment Market Revenue Share (%), by Type 2024 & 2032
- Figure 42: Europe Semiconductor Back-End Equipment Market Volume Share (%), by Type 2024 & 2032
- Figure 43: Europe Semiconductor Back-End Equipment Market Revenue (Million), by End-Use Industry 2024 & 2032
- Figure 44: Europe Semiconductor Back-End Equipment Market Volume (K Unit), by End-Use Industry 2024 & 2032
- Figure 45: Europe Semiconductor Back-End Equipment Market Revenue Share (%), by End-Use Industry 2024 & 2032
- Figure 46: Europe Semiconductor Back-End Equipment Market Volume Share (%), by End-Use Industry 2024 & 2032
- Figure 47: Europe Semiconductor Back-End Equipment Market Revenue (Million), by Country 2024 & 2032
- Figure 48: Europe Semiconductor Back-End Equipment Market Volume (K Unit), by Country 2024 & 2032
- Figure 49: Europe Semiconductor Back-End Equipment Market Revenue Share (%), by Country 2024 & 2032
- Figure 50: Europe Semiconductor Back-End Equipment Market Volume Share (%), by Country 2024 & 2032
- Figure 51: China Semiconductor Back-End Equipment Market Revenue (Million), by Type 2024 & 2032
- Figure 52: China Semiconductor Back-End Equipment Market Volume (K Unit), by Type 2024 & 2032
- Figure 53: China Semiconductor Back-End Equipment Market Revenue Share (%), by Type 2024 & 2032
- Figure 54: China Semiconductor Back-End Equipment Market Volume Share (%), by Type 2024 & 2032
- Figure 55: China Semiconductor Back-End Equipment Market Revenue (Million), by End-Use Industry 2024 & 2032
- Figure 56: China Semiconductor Back-End Equipment Market Volume (K Unit), by End-Use Industry 2024 & 2032
- Figure 57: China Semiconductor Back-End Equipment Market Revenue Share (%), by End-Use Industry 2024 & 2032
- Figure 58: China Semiconductor Back-End Equipment Market Volume Share (%), by End-Use Industry 2024 & 2032
- Figure 59: China Semiconductor Back-End Equipment Market Revenue (Million), by Country 2024 & 2032
- Figure 60: China Semiconductor Back-End Equipment Market Volume (K Unit), by Country 2024 & 2032
- Figure 61: China Semiconductor Back-End Equipment Market Revenue Share (%), by Country 2024 & 2032
- Figure 62: China Semiconductor Back-End Equipment Market Volume Share (%), by Country 2024 & 2032
- Figure 63: South Korea Semiconductor Back-End Equipment Market Revenue (Million), by Type 2024 & 2032
- Figure 64: South Korea Semiconductor Back-End Equipment Market Volume (K Unit), by Type 2024 & 2032
- Figure 65: South Korea Semiconductor Back-End Equipment Market Revenue Share (%), by Type 2024 & 2032
- Figure 66: South Korea Semiconductor Back-End Equipment Market Volume Share (%), by Type 2024 & 2032
- Figure 67: South Korea Semiconductor Back-End Equipment Market Revenue (Million), by End-Use Industry 2024 & 2032
- Figure 68: South Korea Semiconductor Back-End Equipment Market Volume (K Unit), by End-Use Industry 2024 & 2032
- Figure 69: South Korea Semiconductor Back-End Equipment Market Revenue Share (%), by End-Use Industry 2024 & 2032
- Figure 70: South Korea Semiconductor Back-End Equipment Market Volume Share (%), by End-Use Industry 2024 & 2032
- Figure 71: South Korea Semiconductor Back-End Equipment Market Revenue (Million), by Country 2024 & 2032
- Figure 72: South Korea Semiconductor Back-End Equipment Market Volume (K Unit), by Country 2024 & 2032
- Figure 73: South Korea Semiconductor Back-End Equipment Market Revenue Share (%), by Country 2024 & 2032
- Figure 74: South Korea Semiconductor Back-End Equipment Market Volume Share (%), by Country 2024 & 2032
- Figure 75: Taiwan Semiconductor Back-End Equipment Market Revenue (Million), by Type 2024 & 2032
- Figure 76: Taiwan Semiconductor Back-End Equipment Market Volume (K Unit), by Type 2024 & 2032
- Figure 77: Taiwan Semiconductor Back-End Equipment Market Revenue Share (%), by Type 2024 & 2032
- Figure 78: Taiwan Semiconductor Back-End Equipment Market Volume Share (%), by Type 2024 & 2032
- Figure 79: Taiwan Semiconductor Back-End Equipment Market Revenue (Million), by End-Use Industry 2024 & 2032
- Figure 80: Taiwan Semiconductor Back-End Equipment Market Volume (K Unit), by End-Use Industry 2024 & 2032
- Figure 81: Taiwan Semiconductor Back-End Equipment Market Revenue Share (%), by End-Use Industry 2024 & 2032
- Figure 82: Taiwan Semiconductor Back-End Equipment Market Volume Share (%), by End-Use Industry 2024 & 2032
- Figure 83: Taiwan Semiconductor Back-End Equipment Market Revenue (Million), by Country 2024 & 2032
- Figure 84: Taiwan Semiconductor Back-End Equipment Market Volume (K Unit), by Country 2024 & 2032
- Figure 85: Taiwan Semiconductor Back-End Equipment Market Revenue Share (%), by Country 2024 & 2032
- Figure 86: Taiwan Semiconductor Back-End Equipment Market Volume Share (%), by Country 2024 & 2032
- Figure 87: Japan Semiconductor Back-End Equipment Market Revenue (Million), by Type 2024 & 2032
- Figure 88: Japan Semiconductor Back-End Equipment Market Volume (K Unit), by Type 2024 & 2032
- Figure 89: Japan Semiconductor Back-End Equipment Market Revenue Share (%), by Type 2024 & 2032
- Figure 90: Japan Semiconductor Back-End Equipment Market Volume Share (%), by Type 2024 & 2032
- Figure 91: Japan Semiconductor Back-End Equipment Market Revenue (Million), by End-Use Industry 2024 & 2032
- Figure 92: Japan Semiconductor Back-End Equipment Market Volume (K Unit), by End-Use Industry 2024 & 2032
- Figure 93: Japan Semiconductor Back-End Equipment Market Revenue Share (%), by End-Use Industry 2024 & 2032
- Figure 94: Japan Semiconductor Back-End Equipment Market Volume Share (%), by End-Use Industry 2024 & 2032
- Figure 95: Japan Semiconductor Back-End Equipment Market Revenue (Million), by Country 2024 & 2032
- Figure 96: Japan Semiconductor Back-End Equipment Market Volume (K Unit), by Country 2024 & 2032
- Figure 97: Japan Semiconductor Back-End Equipment Market Revenue Share (%), by Country 2024 & 2032
- Figure 98: Japan Semiconductor Back-End Equipment Market Volume Share (%), by Country 2024 & 2032
- Figure 99: Rest of the Asia Pacific Semiconductor Back-End Equipment Market Revenue (Million), by Type 2024 & 2032
- Figure 100: Rest of the Asia Pacific Semiconductor Back-End Equipment Market Volume (K Unit), by Type 2024 & 2032
- Figure 101: Rest of the Asia Pacific Semiconductor Back-End Equipment Market Revenue Share (%), by Type 2024 & 2032
- Figure 102: Rest of the Asia Pacific Semiconductor Back-End Equipment Market Volume Share (%), by Type 2024 & 2032
- Figure 103: Rest of the Asia Pacific Semiconductor Back-End Equipment Market Revenue (Million), by End-Use Industry 2024 & 2032
- Figure 104: Rest of the Asia Pacific Semiconductor Back-End Equipment Market Volume (K Unit), by End-Use Industry 2024 & 2032
- Figure 105: Rest of the Asia Pacific Semiconductor Back-End Equipment Market Revenue Share (%), by End-Use Industry 2024 & 2032
- Figure 106: Rest of the Asia Pacific Semiconductor Back-End Equipment Market Volume Share (%), by End-Use Industry 2024 & 2032
- Figure 107: Rest of the Asia Pacific Semiconductor Back-End Equipment Market Revenue (Million), by Country 2024 & 2032
- Figure 108: Rest of the Asia Pacific Semiconductor Back-End Equipment Market Volume (K Unit), by Country 2024 & 2032
- Figure 109: Rest of the Asia Pacific Semiconductor Back-End Equipment Market Revenue Share (%), by Country 2024 & 2032
- Figure 110: Rest of the Asia Pacific Semiconductor Back-End Equipment Market Volume Share (%), by Country 2024 & 2032
- Figure 111: Rest of the World Semiconductor Back-End Equipment Market Revenue (Million), by Type 2024 & 2032
- Figure 112: Rest of the World Semiconductor Back-End Equipment Market Volume (K Unit), by Type 2024 & 2032
- Figure 113: Rest of the World Semiconductor Back-End Equipment Market Revenue Share (%), by Type 2024 & 2032
- Figure 114: Rest of the World Semiconductor Back-End Equipment Market Volume Share (%), by Type 2024 & 2032
- Figure 115: Rest of the World Semiconductor Back-End Equipment Market Revenue (Million), by End-Use Industry 2024 & 2032
- Figure 116: Rest of the World Semiconductor Back-End Equipment Market Volume (K Unit), by End-Use Industry 2024 & 2032
- Figure 117: Rest of the World Semiconductor Back-End Equipment Market Revenue Share (%), by End-Use Industry 2024 & 2032
- Figure 118: Rest of the World Semiconductor Back-End Equipment Market Volume Share (%), by End-Use Industry 2024 & 2032
- Figure 119: Rest of the World Semiconductor Back-End Equipment Market Revenue (Million), by Country 2024 & 2032
- Figure 120: Rest of the World Semiconductor Back-End Equipment Market Volume (K Unit), by Country 2024 & 2032
- Figure 121: Rest of the World Semiconductor Back-End Equipment Market Revenue Share (%), by Country 2024 & 2032
- Figure 122: Rest of the World Semiconductor Back-End Equipment Market Volume Share (%), by Country 2024 & 2032
List of Tables
- Table 1: Global Semiconductor Back-End Equipment Market Revenue Million Forecast, by Region 2019 & 2032
- Table 2: Global Semiconductor Back-End Equipment Market Volume K Unit Forecast, by Region 2019 & 2032
- Table 3: Global Semiconductor Back-End Equipment Market Revenue Million Forecast, by Type 2019 & 2032
- Table 4: Global Semiconductor Back-End Equipment Market Volume K Unit Forecast, by Type 2019 & 2032
- Table 5: Global Semiconductor Back-End Equipment Market Revenue Million Forecast, by End-Use Industry 2019 & 2032
- Table 6: Global Semiconductor Back-End Equipment Market Volume K Unit Forecast, by End-Use Industry 2019 & 2032
- Table 7: Global Semiconductor Back-End Equipment Market Revenue Million Forecast, by Region 2019 & 2032
- Table 8: Global Semiconductor Back-End Equipment Market Volume K Unit Forecast, by Region 2019 & 2032
- Table 9: Global Semiconductor Back-End Equipment Market Revenue Million Forecast, by Country 2019 & 2032
- Table 10: Global Semiconductor Back-End Equipment Market Volume K Unit Forecast, by Country 2019 & 2032
- Table 11: United States Semiconductor Back-End Equipment Market Revenue (Million) Forecast, by Application 2019 & 2032
- Table 12: United States Semiconductor Back-End Equipment Market Volume (K Unit) Forecast, by Application 2019 & 2032
- Table 13: Canada Semiconductor Back-End Equipment Market Revenue (Million) Forecast, by Application 2019 & 2032
- Table 14: Canada Semiconductor Back-End Equipment Market Volume (K Unit) Forecast, by Application 2019 & 2032
- Table 15: Mexico Semiconductor Back-End Equipment Market Revenue (Million) Forecast, by Application 2019 & 2032
- Table 16: Mexico Semiconductor Back-End Equipment Market Volume (K Unit) Forecast, by Application 2019 & 2032
- Table 17: Global Semiconductor Back-End Equipment Market Revenue Million Forecast, by Country 2019 & 2032
- Table 18: Global Semiconductor Back-End Equipment Market Volume K Unit Forecast, by Country 2019 & 2032
- Table 19: Germany Semiconductor Back-End Equipment Market Revenue (Million) Forecast, by Application 2019 & 2032
- Table 20: Germany Semiconductor Back-End Equipment Market Volume (K Unit) Forecast, by Application 2019 & 2032
- Table 21: United Kingdom Semiconductor Back-End Equipment Market Revenue (Million) Forecast, by Application 2019 & 2032
- Table 22: United Kingdom Semiconductor Back-End Equipment Market Volume (K Unit) Forecast, by Application 2019 & 2032
- Table 23: France Semiconductor Back-End Equipment Market Revenue (Million) Forecast, by Application 2019 & 2032
- Table 24: France Semiconductor Back-End Equipment Market Volume (K Unit) Forecast, by Application 2019 & 2032
- Table 25: Spain Semiconductor Back-End Equipment Market Revenue (Million) Forecast, by Application 2019 & 2032
- Table 26: Spain Semiconductor Back-End Equipment Market Volume (K Unit) Forecast, by Application 2019 & 2032
- Table 27: Italy Semiconductor Back-End Equipment Market Revenue (Million) Forecast, by Application 2019 & 2032
- Table 28: Italy Semiconductor Back-End Equipment Market Volume (K Unit) Forecast, by Application 2019 & 2032
- Table 29: Spain Semiconductor Back-End Equipment Market Revenue (Million) Forecast, by Application 2019 & 2032
- Table 30: Spain Semiconductor Back-End Equipment Market Volume (K Unit) Forecast, by Application 2019 & 2032
- Table 31: Belgium Semiconductor Back-End Equipment Market Revenue (Million) Forecast, by Application 2019 & 2032
- Table 32: Belgium Semiconductor Back-End Equipment Market Volume (K Unit) Forecast, by Application 2019 & 2032
- Table 33: Netherland Semiconductor Back-End Equipment Market Revenue (Million) Forecast, by Application 2019 & 2032
- Table 34: Netherland Semiconductor Back-End Equipment Market Volume (K Unit) Forecast, by Application 2019 & 2032
- Table 35: Nordics Semiconductor Back-End Equipment Market Revenue (Million) Forecast, by Application 2019 & 2032
- Table 36: Nordics Semiconductor Back-End Equipment Market Volume (K Unit) Forecast, by Application 2019 & 2032
- Table 37: Rest of Europe Semiconductor Back-End Equipment Market Revenue (Million) Forecast, by Application 2019 & 2032
- Table 38: Rest of Europe Semiconductor Back-End Equipment Market Volume (K Unit) Forecast, by Application 2019 & 2032
- Table 39: Global Semiconductor Back-End Equipment Market Revenue Million Forecast, by Country 2019 & 2032
- Table 40: Global Semiconductor Back-End Equipment Market Volume K Unit Forecast, by Country 2019 & 2032
- Table 41: China Semiconductor Back-End Equipment Market Revenue (Million) Forecast, by Application 2019 & 2032
- Table 42: China Semiconductor Back-End Equipment Market Volume (K Unit) Forecast, by Application 2019 & 2032
- Table 43: Japan Semiconductor Back-End Equipment Market Revenue (Million) Forecast, by Application 2019 & 2032
- Table 44: Japan Semiconductor Back-End Equipment Market Volume (K Unit) Forecast, by Application 2019 & 2032
- Table 45: India Semiconductor Back-End Equipment Market Revenue (Million) Forecast, by Application 2019 & 2032
- Table 46: India Semiconductor Back-End Equipment Market Volume (K Unit) Forecast, by Application 2019 & 2032
- Table 47: South Korea Semiconductor Back-End Equipment Market Revenue (Million) Forecast, by Application 2019 & 2032
- Table 48: South Korea Semiconductor Back-End Equipment Market Volume (K Unit) Forecast, by Application 2019 & 2032
- Table 49: Southeast Asia Semiconductor Back-End Equipment Market Revenue (Million) Forecast, by Application 2019 & 2032
- Table 50: Southeast Asia Semiconductor Back-End Equipment Market Volume (K Unit) Forecast, by Application 2019 & 2032
- Table 51: Australia Semiconductor Back-End Equipment Market Revenue (Million) Forecast, by Application 2019 & 2032
- Table 52: Australia Semiconductor Back-End Equipment Market Volume (K Unit) Forecast, by Application 2019 & 2032
- Table 53: Indonesia Semiconductor Back-End Equipment Market Revenue (Million) Forecast, by Application 2019 & 2032
- Table 54: Indonesia Semiconductor Back-End Equipment Market Volume (K Unit) Forecast, by Application 2019 & 2032
- Table 55: Phillipes Semiconductor Back-End Equipment Market Revenue (Million) Forecast, by Application 2019 & 2032
- Table 56: Phillipes Semiconductor Back-End Equipment Market Volume (K Unit) Forecast, by Application 2019 & 2032
- Table 57: Singapore Semiconductor Back-End Equipment Market Revenue (Million) Forecast, by Application 2019 & 2032
- Table 58: Singapore Semiconductor Back-End Equipment Market Volume (K Unit) Forecast, by Application 2019 & 2032
- Table 59: Thailandc Semiconductor Back-End Equipment Market Revenue (Million) Forecast, by Application 2019 & 2032
- Table 60: Thailandc Semiconductor Back-End Equipment Market Volume (K Unit) Forecast, by Application 2019 & 2032
- Table 61: Rest of Asia Pacific Semiconductor Back-End Equipment Market Revenue (Million) Forecast, by Application 2019 & 2032
- Table 62: Rest of Asia Pacific Semiconductor Back-End Equipment Market Volume (K Unit) Forecast, by Application 2019 & 2032
- Table 63: Global Semiconductor Back-End Equipment Market Revenue Million Forecast, by Country 2019 & 2032
- Table 64: Global Semiconductor Back-End Equipment Market Volume K Unit Forecast, by Country 2019 & 2032
- Table 65: Brazil Semiconductor Back-End Equipment Market Revenue (Million) Forecast, by Application 2019 & 2032
- Table 66: Brazil Semiconductor Back-End Equipment Market Volume (K Unit) Forecast, by Application 2019 & 2032
- Table 67: Argentina Semiconductor Back-End Equipment Market Revenue (Million) Forecast, by Application 2019 & 2032
- Table 68: Argentina Semiconductor Back-End Equipment Market Volume (K Unit) Forecast, by Application 2019 & 2032
- Table 69: Peru Semiconductor Back-End Equipment Market Revenue (Million) Forecast, by Application 2019 & 2032
- Table 70: Peru Semiconductor Back-End Equipment Market Volume (K Unit) Forecast, by Application 2019 & 2032
- Table 71: Chile Semiconductor Back-End Equipment Market Revenue (Million) Forecast, by Application 2019 & 2032
- Table 72: Chile Semiconductor Back-End Equipment Market Volume (K Unit) Forecast, by Application 2019 & 2032
- Table 73: Colombia Semiconductor Back-End Equipment Market Revenue (Million) Forecast, by Application 2019 & 2032
- Table 74: Colombia Semiconductor Back-End Equipment Market Volume (K Unit) Forecast, by Application 2019 & 2032
- Table 75: Ecuador Semiconductor Back-End Equipment Market Revenue (Million) Forecast, by Application 2019 & 2032
- Table 76: Ecuador Semiconductor Back-End Equipment Market Volume (K Unit) Forecast, by Application 2019 & 2032
- Table 77: Venezuela Semiconductor Back-End Equipment Market Revenue (Million) Forecast, by Application 2019 & 2032
- Table 78: Venezuela Semiconductor Back-End Equipment Market Volume (K Unit) Forecast, by Application 2019 & 2032
- Table 79: Rest of South America Semiconductor Back-End Equipment Market Revenue (Million) Forecast, by Application 2019 & 2032
- Table 80: Rest of South America Semiconductor Back-End Equipment Market Volume (K Unit) Forecast, by Application 2019 & 2032
- Table 81: Global Semiconductor Back-End Equipment Market Revenue Million Forecast, by Country 2019 & 2032
- Table 82: Global Semiconductor Back-End Equipment Market Volume K Unit Forecast, by Country 2019 & 2032
- Table 83: United States Semiconductor Back-End Equipment Market Revenue (Million) Forecast, by Application 2019 & 2032
- Table 84: United States Semiconductor Back-End Equipment Market Volume (K Unit) Forecast, by Application 2019 & 2032
- Table 85: Canada Semiconductor Back-End Equipment Market Revenue (Million) Forecast, by Application 2019 & 2032
- Table 86: Canada Semiconductor Back-End Equipment Market Volume (K Unit) Forecast, by Application 2019 & 2032
- Table 87: Mexico Semiconductor Back-End Equipment Market Revenue (Million) Forecast, by Application 2019 & 2032
- Table 88: Mexico Semiconductor Back-End Equipment Market Volume (K Unit) Forecast, by Application 2019 & 2032
- Table 89: Global Semiconductor Back-End Equipment Market Revenue Million Forecast, by Country 2019 & 2032
- Table 90: Global Semiconductor Back-End Equipment Market Volume K Unit Forecast, by Country 2019 & 2032
- Table 91: United Arab Emirates Semiconductor Back-End Equipment Market Revenue (Million) Forecast, by Application 2019 & 2032
- Table 92: United Arab Emirates Semiconductor Back-End Equipment Market Volume (K Unit) Forecast, by Application 2019 & 2032
- Table 93: Saudi Arabia Semiconductor Back-End Equipment Market Revenue (Million) Forecast, by Application 2019 & 2032
- Table 94: Saudi Arabia Semiconductor Back-End Equipment Market Volume (K Unit) Forecast, by Application 2019 & 2032
- Table 95: South Africa Semiconductor Back-End Equipment Market Revenue (Million) Forecast, by Application 2019 & 2032
- Table 96: South Africa Semiconductor Back-End Equipment Market Volume (K Unit) Forecast, by Application 2019 & 2032
- Table 97: Rest of Middle East and Africa Semiconductor Back-End Equipment Market Revenue (Million) Forecast, by Application 2019 & 2032
- Table 98: Rest of Middle East and Africa Semiconductor Back-End Equipment Market Volume (K Unit) Forecast, by Application 2019 & 2032
- Table 99: Global Semiconductor Back-End Equipment Market Revenue Million Forecast, by Type 2019 & 2032
- Table 100: Global Semiconductor Back-End Equipment Market Volume K Unit Forecast, by Type 2019 & 2032
- Table 101: Global Semiconductor Back-End Equipment Market Revenue Million Forecast, by End-Use Industry 2019 & 2032
- Table 102: Global Semiconductor Back-End Equipment Market Volume K Unit Forecast, by End-Use Industry 2019 & 2032
- Table 103: Global Semiconductor Back-End Equipment Market Revenue Million Forecast, by Country 2019 & 2032
- Table 104: Global Semiconductor Back-End Equipment Market Volume K Unit Forecast, by Country 2019 & 2032
- Table 105: Global Semiconductor Back-End Equipment Market Revenue Million Forecast, by Type 2019 & 2032
- Table 106: Global Semiconductor Back-End Equipment Market Volume K Unit Forecast, by Type 2019 & 2032
- Table 107: Global Semiconductor Back-End Equipment Market Revenue Million Forecast, by End-Use Industry 2019 & 2032
- Table 108: Global Semiconductor Back-End Equipment Market Volume K Unit Forecast, by End-Use Industry 2019 & 2032
- Table 109: Global Semiconductor Back-End Equipment Market Revenue Million Forecast, by Country 2019 & 2032
- Table 110: Global Semiconductor Back-End Equipment Market Volume K Unit Forecast, by Country 2019 & 2032
- Table 111: Global Semiconductor Back-End Equipment Market Revenue Million Forecast, by Type 2019 & 2032
- Table 112: Global Semiconductor Back-End Equipment Market Volume K Unit Forecast, by Type 2019 & 2032
- Table 113: Global Semiconductor Back-End Equipment Market Revenue Million Forecast, by End-Use Industry 2019 & 2032
- Table 114: Global Semiconductor Back-End Equipment Market Volume K Unit Forecast, by End-Use Industry 2019 & 2032
- Table 115: Global Semiconductor Back-End Equipment Market Revenue Million Forecast, by Country 2019 & 2032
- Table 116: Global Semiconductor Back-End Equipment Market Volume K Unit Forecast, by Country 2019 & 2032
- Table 117: Global Semiconductor Back-End Equipment Market Revenue Million Forecast, by Type 2019 & 2032
- Table 118: Global Semiconductor Back-End Equipment Market Volume K Unit Forecast, by Type 2019 & 2032
- Table 119: Global Semiconductor Back-End Equipment Market Revenue Million Forecast, by End-Use Industry 2019 & 2032
- Table 120: Global Semiconductor Back-End Equipment Market Volume K Unit Forecast, by End-Use Industry 2019 & 2032
- Table 121: Global Semiconductor Back-End Equipment Market Revenue Million Forecast, by Country 2019 & 2032
- Table 122: Global Semiconductor Back-End Equipment Market Volume K Unit Forecast, by Country 2019 & 2032
- Table 123: Global Semiconductor Back-End Equipment Market Revenue Million Forecast, by Type 2019 & 2032
- Table 124: Global Semiconductor Back-End Equipment Market Volume K Unit Forecast, by Type 2019 & 2032
- Table 125: Global Semiconductor Back-End Equipment Market Revenue Million Forecast, by End-Use Industry 2019 & 2032
- Table 126: Global Semiconductor Back-End Equipment Market Volume K Unit Forecast, by End-Use Industry 2019 & 2032
- Table 127: Global Semiconductor Back-End Equipment Market Revenue Million Forecast, by Country 2019 & 2032
- Table 128: Global Semiconductor Back-End Equipment Market Volume K Unit Forecast, by Country 2019 & 2032
- Table 129: Global Semiconductor Back-End Equipment Market Revenue Million Forecast, by Type 2019 & 2032
- Table 130: Global Semiconductor Back-End Equipment Market Volume K Unit Forecast, by Type 2019 & 2032
- Table 131: Global Semiconductor Back-End Equipment Market Revenue Million Forecast, by End-Use Industry 2019 & 2032
- Table 132: Global Semiconductor Back-End Equipment Market Volume K Unit Forecast, by End-Use Industry 2019 & 2032
- Table 133: Global Semiconductor Back-End Equipment Market Revenue Million Forecast, by Country 2019 & 2032
- Table 134: Global Semiconductor Back-End Equipment Market Volume K Unit Forecast, by Country 2019 & 2032
- Table 135: Global Semiconductor Back-End Equipment Market Revenue Million Forecast, by Type 2019 & 2032
- Table 136: Global Semiconductor Back-End Equipment Market Volume K Unit Forecast, by Type 2019 & 2032
- Table 137: Global Semiconductor Back-End Equipment Market Revenue Million Forecast, by End-Use Industry 2019 & 2032
- Table 138: Global Semiconductor Back-End Equipment Market Volume K Unit Forecast, by End-Use Industry 2019 & 2032
- Table 139: Global Semiconductor Back-End Equipment Market Revenue Million Forecast, by Country 2019 & 2032
- Table 140: Global Semiconductor Back-End Equipment Market Volume K Unit Forecast, by Country 2019 & 2032
- Table 141: Global Semiconductor Back-End Equipment Market Revenue Million Forecast, by Type 2019 & 2032
- Table 142: Global Semiconductor Back-End Equipment Market Volume K Unit Forecast, by Type 2019 & 2032
- Table 143: Global Semiconductor Back-End Equipment Market Revenue Million Forecast, by End-Use Industry 2019 & 2032
- Table 144: Global Semiconductor Back-End Equipment Market Volume K Unit Forecast, by End-Use Industry 2019 & 2032
- Table 145: Global Semiconductor Back-End Equipment Market Revenue Million Forecast, by Country 2019 & 2032
- Table 146: Global Semiconductor Back-End Equipment Market Volume K Unit Forecast, by Country 2019 & 2032
Frequently Asked Questions
1. What is the projected Compound Annual Growth Rate (CAGR) of the Semiconductor Back-End Equipment Market?
The projected CAGR is approximately 8.75%.
2. Which companies are prominent players in the Semiconductor Back-End Equipment Market?
Key companies in the market include Advantest Corporation, KLA Corporation, Teradyne Inc, Nordson Corporatio, Applied Materials Inc, ASML Holding N V, Screen Holdings Co Ltd, Onto Innovation Inc, Tokyo Electron Limited, LAM Research Corporation.
3. What are the main segments of the Semiconductor Back-End Equipment Market?
The market segments include Type, End-Use Industry.
4. Can you provide details about the market size?
The market size is estimated to be USD 18.83 Million as of 2022.
5. What are some drivers contributing to market growth?
Increasing Demand for Semiconductors in Electric and Hybrid Vehicles; Demand for Setting Up New Foundries (International Chip Shortage).
6. What are the notable trends driving market growth?
Assembly and Packaging Segment is Expected to Witness Significant Growth.
7. Are there any restraints impacting market growth?
High Setup Costs; Constant Evolution of Products Influencing Demand.
8. Can you provide examples of recent developments in the market?
December 2023: Tokyo Electron announced that it has developed an Extreme Laser Lift Off (XLO) technology that contributes to innovations in 3D integration of advanced semiconductor devices adopting permanent wafer bonding. This new technology for two permanently bonded silicon wafers uses a laser to separate the top silicon substrate from the bottom substrate with an integrated circuit layer.
9. What pricing options are available for accessing the report?
Pricing options include single-user, multi-user, and enterprise licenses priced at USD 4750, USD 5250, and USD 8750 respectively.
10. Is the market size provided in terms of value or volume?
The market size is provided in terms of value, measured in Million and volume, measured in K Unit.
11. Are there any specific market keywords associated with the report?
Yes, the market keyword associated with the report is "Semiconductor Back-End Equipment Market," which aids in identifying and referencing the specific market segment covered.
12. How do I determine which pricing option suits my needs best?
The pricing options vary based on user requirements and access needs. Individual users may opt for single-user licenses, while businesses requiring broader access may choose multi-user or enterprise licenses for cost-effective access to the report.
13. Are there any additional resources or data provided in the Semiconductor Back-End Equipment Market report?
While the report offers comprehensive insights, it's advisable to review the specific contents or supplementary materials provided to ascertain if additional resources or data are available.
14. How can I stay updated on further developments or reports in the Semiconductor Back-End Equipment Market?
To stay informed about further developments, trends, and reports in the Semiconductor Back-End Equipment Market, consider subscribing to industry newsletters, following relevant companies and organizations, or regularly checking reputable industry news sources and publications.
Methodology
Step 1 - Identification of Relevant Samples Size from Population Database


Step 2 - Approaches for Defining Global Market Size (Value, Volume* & Price*)

Note*: In applicable scenarios
Step 3 - Data Sources
Primary Research
- Web Analytics
- Survey Reports
- Research Institute
- Latest Research Reports
- Opinion Leaders
Secondary Research
- Annual Reports
- White Paper
- Latest Press Release
- Industry Association
- Paid Database
- Investor Presentations

Step 4 - Data Triangulation
Involves using different sources of information in order to increase the validity of a study
These sources are likely to be stakeholders in a program - participants, other researchers, program staff, other community members, and so on.
Then we put all data in single framework & apply various statistical tools to find out the dynamic on the market.
During the analysis stage, feedback from the stakeholder groups would be compared to determine areas of agreement as well as areas of divergence
