

Key Insights
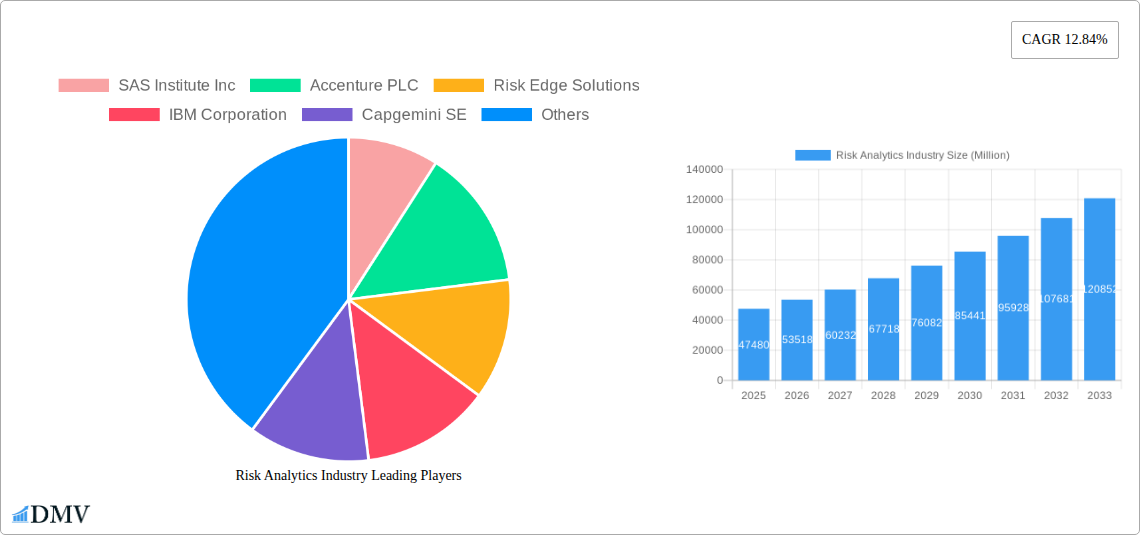
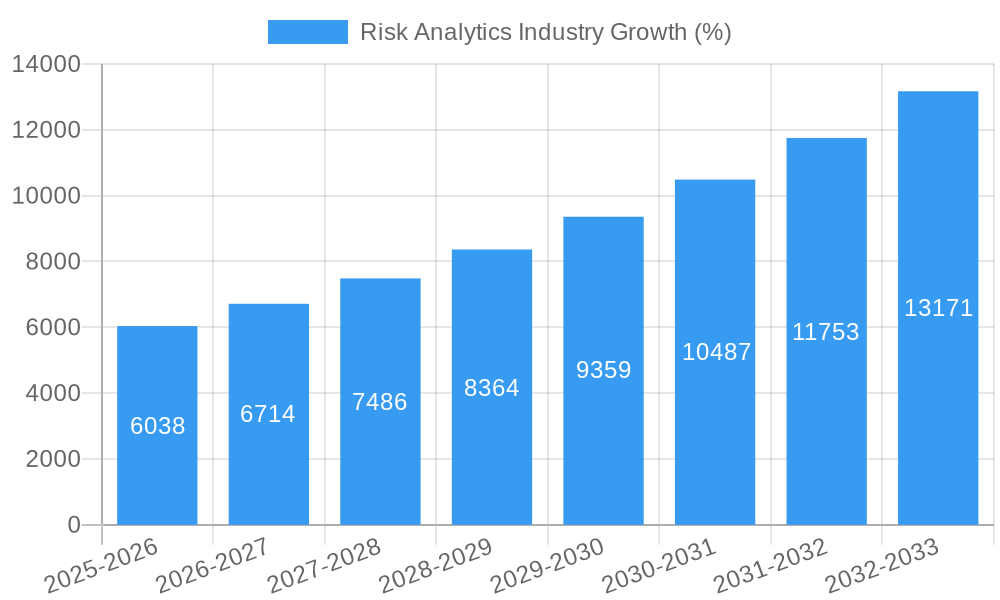
The global risk analytics market, currently valued at $47.48 billion in 2025, is projected to experience robust growth, exhibiting a Compound Annual Growth Rate (CAGR) of 12.84% from 2025 to 2033. This expansion is fueled by several key drivers. Increasing regulatory scrutiny across various sectors, particularly BFSI (Banking, Financial Services, and Insurance), necessitates sophisticated risk management solutions. The rising adoption of cloud-based solutions offers enhanced scalability, flexibility, and cost-effectiveness, further propelling market growth. Furthermore, the growing prevalence of data breaches and cyber threats is driving demand for advanced risk analytics tools capable of detecting and mitigating potential risks proactively. The market is segmented by component (solution and service), deployment (on-premise and cloud), and end-user vertical (BFSI, healthcare, retail, manufacturing, and others). The BFSI sector currently dominates market share due to stringent regulatory compliance requirements and the inherent risks associated with financial transactions. However, the healthcare and retail sectors are witnessing significant growth, driven by the increasing need for fraud detection and patient data security.
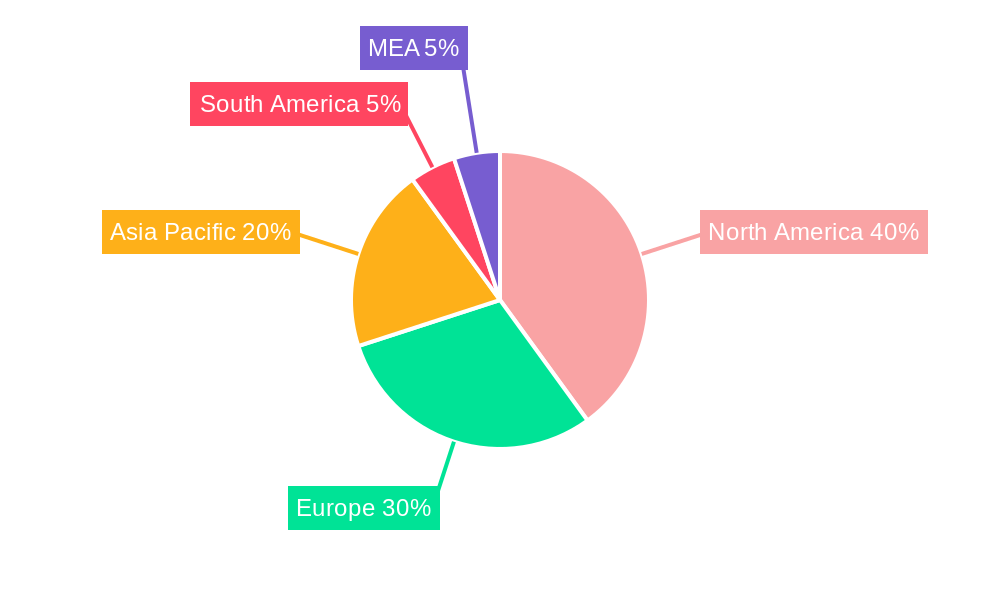
The competitive landscape is characterized by a mix of established players like SAS Institute Inc., Accenture PLC, and IBM Corporation, alongside emerging specialized firms like Risk Edge Solutions and Provenir Inc. These companies are constantly innovating to offer advanced functionalities such as predictive modeling, machine learning, and AI-powered risk assessment. Geographic growth is expected to be widespread, with North America and Europe maintaining substantial market share due to early adoption and advanced technological infrastructure. However, the Asia-Pacific region is anticipated to witness the fastest growth due to rapid economic development and increasing digitalization across various industries. The market's continued expansion hinges on factors such as technological advancements, regulatory changes, and the evolving risk landscape. Companies are focusing on strategic partnerships, acquisitions, and product development to solidify their market positions and capitalize on emerging opportunities.
Risk Analytics Industry Market Report: 2019-2033
This comprehensive report delivers an in-depth analysis of the Risk Analytics Industry, projecting a market valuation exceeding $XX Million by 2033. We examine market composition, technological advancements, key players, and future opportunities, providing actionable insights for stakeholders across the value chain. The report covers the period 2019-2033, with a base year of 2025 and a forecast period of 2025-2033.
Risk Analytics Industry Market Composition & Trends
The Risk Analytics market, valued at $XX Million in 2025, is experiencing robust growth driven by increasing regulatory scrutiny, heightened awareness of potential risks, and the proliferation of data analytics technologies. Market concentration is moderate, with several major players holding significant shares, while a large number of niche players cater to specialized segments. Innovation is predominantly driven by advancements in AI, machine learning, and big data analytics, enabling more sophisticated risk modeling and prediction capabilities.
Key Market Trends:
- Market Share Distribution: The top 5 players (SAS Institute Inc, Accenture PLC, IBM Corporation, Moody's Analytics Inc, and SAP SE) collectively hold an estimated XX% market share in 2025, with SAS Institute Inc leading at approximately XX%. The remaining market share is distributed amongst numerous smaller players and niche providers.
- M&A Activity: The industry witnessed significant M&A activity in recent years, with deal values exceeding $XX Million in the last 5 years. Strategic acquisitions are primarily focused on expanding product portfolios, technological capabilities, and market reach. Examples include the SimCorp-Axioma merger (November 2023) and the Kearney-Everstream Analytics partnership (August 2023).
- Regulatory Landscape: Stringent regulatory compliance requirements (e.g., GDPR, CCPA) are driving demand for robust risk analytics solutions, particularly within BFSI and healthcare sectors.
- Substitute Products: While specialized solutions exist, the core functionality of risk analytics remains largely irreplaceable, ensuring stable demand even in the face of emerging technologies.
- End-User Profiles: The BFSI sector remains the largest end-user vertical, accounting for approximately XX% of the market. However, growth is also evident in healthcare, retail, and manufacturing, driven by increasing adoption of risk management practices.
Risk Analytics Industry Evolution
The Risk Analytics industry has witnessed exponential growth since 2019, driven by a confluence of factors. Technological advancements, such as the rise of AI and cloud computing, have fueled the development of more sophisticated and user-friendly risk analytics solutions. Simultaneously, increased regulatory pressure and heightened awareness of various risks (financial, operational, cyber) are pushing organizations to adopt advanced risk management strategies. The market's compound annual growth rate (CAGR) during the historical period (2019-2024) is estimated at XX%, and is projected to reach XX% during the forecast period (2025-2033), exceeding $XX Million by 2033. This growth is fueled by rising adoption rates, particularly within cloud-based deployment models. Adoption rates among SMEs are also increasing, further driving market expansion. Consumer demand is shifting toward integrated, AI-powered solutions that provide real-time insights and predictive capabilities, transforming risk management from a reactive to a proactive function.
Leading Regions, Countries, or Segments in Risk Analytics Industry
North America currently dominates the Risk Analytics market, driven by high technological adoption rates, stringent regulatory frameworks, and a large concentration of key players. However, the Asia-Pacific region is exhibiting significant growth potential, particularly in countries like India and China, fueled by rising investments in digital infrastructure and increasing regulatory pressure.
Key Drivers of Regional Dominance:
- North America: High adoption of advanced technologies, strong regulatory environment, significant presence of major players.
- Europe: Robust regulatory environment (GDPR), high technological maturity, strong presence of financial institutions.
- Asia-Pacific: Rapid digitalization, rising investments in technology infrastructure, and growing awareness of risk management.
Leading Segments:
- By Component: The Solution segment currently holds the largest market share due to the wide range of software and applications available. The Service segment is projected to see substantial growth driven by the demand for consulting and implementation support.
- By Deployment: The Cloud deployment model is gaining significant traction, owing to its scalability, cost-effectiveness, and ease of access.
- By End-user Vertical: The BFSI sector remains the largest end-user, followed by Healthcare and Manufacturing. These verticals face significant regulatory compliance challenges and have substantial datasets requiring analytical solutions.
Risk Analytics Industry Product Innovations
Recent product innovations focus on enhancing predictive capabilities, improving data visualization, and integrating AI/ML algorithms to provide more actionable insights. Key improvements include advanced scenario planning, real-time risk monitoring, and automated reporting. Unique selling propositions center around user-friendly interfaces, advanced analytical capabilities, and seamless integration with existing enterprise systems. This is complemented by the increasing adoption of cloud-based platforms that enhance scalability and accessibility.
Propelling Factors for Risk Analytics Industry Growth
Several factors are driving growth in the Risk Analytics industry:
- Technological Advancements: AI, Machine Learning, and Big Data analytics are enhancing the accuracy and efficiency of risk assessment.
- Increased Regulatory Scrutiny: Stringent compliance requirements across various sectors necessitate sophisticated risk management practices.
- Rising Cyber Threats: The increasing frequency and severity of cyberattacks are driving demand for advanced cyber risk analytics solutions.
- Economic Uncertainty: Global economic fluctuations increase the need for robust risk assessment and mitigation strategies.
Obstacles in the Risk Analytics Industry Market
Despite the positive outlook, several challenges hinder market growth:
- Data Security Concerns: Handling sensitive data requires robust security measures, adding complexity and cost.
- Integration Challenges: Integrating risk analytics solutions with existing IT infrastructure can be complex and time-consuming.
- Lack of Skilled Professionals: A shortage of professionals skilled in data science and risk analytics limits the adoption of advanced solutions.
- High Implementation Costs: Implementing and maintaining sophisticated risk analytics systems can be expensive.
Future Opportunities in Risk Analytics Industry
Future opportunities lie in:
- Expansion into Emerging Markets: Developing economies offer significant untapped potential for risk analytics solutions.
- Integration of ESG Factors: Growing focus on environmental, social, and governance (ESG) factors presents new market opportunities.
- Development of Specialized Solutions: Tailored solutions for specific industries (e.g., supply chain risk management) are in high demand.
- Advancements in Quantum Computing: Future adoption of Quantum Computing holds potential for dramatically improving risk modelling speed and accuracy.
Major Players in the Risk Analytics Industry Ecosystem
- SAS Institute Inc
- Accenture PLC
- Risk Edge Solutions
- IBM Corporation
- Capgemini SE
- Adenza Group Inc (AxiomSL Ltd )
- Provenir Inc
- OneSpan Inc
- Oracle Corporation
- Moody's Analytics Inc
- SAP SE
Key Developments in Risk Analytics Industry Industry
- November 2023: SimCorp's merger with Axioma strengthens its North American market position, creating a leading enterprise risk solution provider.
- August 2023: Kearney and Everstream Analytics partnership expands AI-powered supply chain risk analytics offerings.
- November 2022: Elpha Secure and CyberCube collaboration enhances cyber risk analytics for the ILS market.
- November 2022: Synspective and GCRS partnership delivers SAR-based risk analysis solutions for critical infrastructure and mining in South Asia.
Strategic Risk Analytics Industry Market Forecast
The Risk Analytics market is poised for sustained growth, driven by technological advancements, increasing regulatory pressure, and rising awareness of risk management's importance. The convergence of AI, cloud computing, and big data will further enhance the capabilities of risk analytics solutions, leading to improved decision-making and enhanced risk mitigation strategies. Expanding into new markets and developing specialized solutions will unlock significant growth opportunities. The market is expected to exceed $XX Million by 2033, creating significant opportunities for established players and new entrants.
Risk Analytics Industry Segmentation
-
1. Component
- 1.1. Solution
- 1.2. Service
-
2. Deployment
- 2.1. On-premise
- 2.2. Cloud
-
3. End-user Vertical
- 3.1. BFSI
- 3.2. Healthcare
- 3.3. Retail
- 3.4. Manufacturing
- 3.5. Other End-user Verticals (IT and Telecom)
Risk Analytics Industry Segmentation By Geography
-
1. North America
- 1.1. United States
- 1.2. Canada
-
2. Europe
- 2.1. Germany
- 2.2. United Kingdom
- 2.3. France
- 2.4. Spain
-
3. Asia
- 3.1. China
- 3.2. Japan
- 3.3. India
- 3.4. Australia and New Zealand
-
4. Latin America
- 4.1. Brazil
- 4.2. Mexico
- 4.3. Argentina
-
5. Middle East and Africa
- 5.1. United Arab Emirates
- 5.2. Saudi Arabia
- 5.3. South Africa
Risk Analytics Industry REPORT HIGHLIGHTS
| Aspects | Details |
|---|---|
| Study Period | 2019-2033 |
| Base Year | 2024 |
| Estimated Year | 2025 |
| Forecast Period | 2025-2033 |
| Historical Period | 2019-2024 |
| Growth Rate | CAGR of 12.84% from 2019-2033 |
| Segmentation |
|
Table of Contents
- 1. Introduction
- 1.1. Research Scope
- 1.2. Market Segmentation
- 1.3. Research Methodology
- 1.4. Definitions and Assumptions
- 2. Executive Summary
- 2.1. Introduction
- 3. Market Dynamics
- 3.1. Introduction
- 3.2. Market Drivers
- 3.2.1. Growing Complexities across Business Processes; Global Regulatory Frameworks and Government Policies
- 3.3. Market Restrains
- 3.3.1. High Installation and Operational Costs; Complicated Regulatory Compliance might hinder the Market Growth
- 3.4. Market Trends
- 3.4.1. BFSI is Expected to Witness Huge Adoption of Risk Analytics Solutions
- 4. Market Factor Analysis
- 4.1. Porters Five Forces
- 4.2. Supply/Value Chain
- 4.3. PESTEL analysis
- 4.4. Market Entropy
- 4.5. Patent/Trademark Analysis
- 5. Global Risk Analytics Industry Analysis, Insights and Forecast, 2019-2031
- 5.1. Market Analysis, Insights and Forecast - by Component
- 5.1.1. Solution
- 5.1.2. Service
- 5.2. Market Analysis, Insights and Forecast - by Deployment
- 5.2.1. On-premise
- 5.2.2. Cloud
- 5.3. Market Analysis, Insights and Forecast - by End-user Vertical
- 5.3.1. BFSI
- 5.3.2. Healthcare
- 5.3.3. Retail
- 5.3.4. Manufacturing
- 5.3.5. Other End-user Verticals (IT and Telecom)
- 5.4. Market Analysis, Insights and Forecast - by Region
- 5.4.1. North America
- 5.4.2. Europe
- 5.4.3. Asia
- 5.4.4. Latin America
- 5.4.5. Middle East and Africa
- 5.1. Market Analysis, Insights and Forecast - by Component
- 6. North America Risk Analytics Industry Analysis, Insights and Forecast, 2019-2031
- 6.1. Market Analysis, Insights and Forecast - by Component
- 6.1.1. Solution
- 6.1.2. Service
- 6.2. Market Analysis, Insights and Forecast - by Deployment
- 6.2.1. On-premise
- 6.2.2. Cloud
- 6.3. Market Analysis, Insights and Forecast - by End-user Vertical
- 6.3.1. BFSI
- 6.3.2. Healthcare
- 6.3.3. Retail
- 6.3.4. Manufacturing
- 6.3.5. Other End-user Verticals (IT and Telecom)
- 6.1. Market Analysis, Insights and Forecast - by Component
- 7. Europe Risk Analytics Industry Analysis, Insights and Forecast, 2019-2031
- 7.1. Market Analysis, Insights and Forecast - by Component
- 7.1.1. Solution
- 7.1.2. Service
- 7.2. Market Analysis, Insights and Forecast - by Deployment
- 7.2.1. On-premise
- 7.2.2. Cloud
- 7.3. Market Analysis, Insights and Forecast - by End-user Vertical
- 7.3.1. BFSI
- 7.3.2. Healthcare
- 7.3.3. Retail
- 7.3.4. Manufacturing
- 7.3.5. Other End-user Verticals (IT and Telecom)
- 7.1. Market Analysis, Insights and Forecast - by Component
- 8. Asia Risk Analytics Industry Analysis, Insights and Forecast, 2019-2031
- 8.1. Market Analysis, Insights and Forecast - by Component
- 8.1.1. Solution
- 8.1.2. Service
- 8.2. Market Analysis, Insights and Forecast - by Deployment
- 8.2.1. On-premise
- 8.2.2. Cloud
- 8.3. Market Analysis, Insights and Forecast - by End-user Vertical
- 8.3.1. BFSI
- 8.3.2. Healthcare
- 8.3.3. Retail
- 8.3.4. Manufacturing
- 8.3.5. Other End-user Verticals (IT and Telecom)
- 8.1. Market Analysis, Insights and Forecast - by Component
- 9. Latin America Risk Analytics Industry Analysis, Insights and Forecast, 2019-2031
- 9.1. Market Analysis, Insights and Forecast - by Component
- 9.1.1. Solution
- 9.1.2. Service
- 9.2. Market Analysis, Insights and Forecast - by Deployment
- 9.2.1. On-premise
- 9.2.2. Cloud
- 9.3. Market Analysis, Insights and Forecast - by End-user Vertical
- 9.3.1. BFSI
- 9.3.2. Healthcare
- 9.3.3. Retail
- 9.3.4. Manufacturing
- 9.3.5. Other End-user Verticals (IT and Telecom)
- 9.1. Market Analysis, Insights and Forecast - by Component
- 10. Middle East and Africa Risk Analytics Industry Analysis, Insights and Forecast, 2019-2031
- 10.1. Market Analysis, Insights and Forecast - by Component
- 10.1.1. Solution
- 10.1.2. Service
- 10.2. Market Analysis, Insights and Forecast - by Deployment
- 10.2.1. On-premise
- 10.2.2. Cloud
- 10.3. Market Analysis, Insights and Forecast - by End-user Vertical
- 10.3.1. BFSI
- 10.3.2. Healthcare
- 10.3.3. Retail
- 10.3.4. Manufacturing
- 10.3.5. Other End-user Verticals (IT and Telecom)
- 10.1. Market Analysis, Insights and Forecast - by Component
- 11. North America Risk Analytics Industry Analysis, Insights and Forecast, 2019-2031
- 11.1. Market Analysis, Insights and Forecast - By Country/Sub-region
- 11.1.1 United States
- 11.1.2 Canada
- 11.1.3 Mexico
- 12. Europe Risk Analytics Industry Analysis, Insights and Forecast, 2019-2031
- 12.1. Market Analysis, Insights and Forecast - By Country/Sub-region
- 12.1.1 Germany
- 12.1.2 United Kingdom
- 12.1.3 France
- 12.1.4 Spain
- 12.1.5 Italy
- 12.1.6 Spain
- 12.1.7 Belgium
- 12.1.8 Netherland
- 12.1.9 Nordics
- 12.1.10 Rest of Europe
- 13. Asia Pacific Risk Analytics Industry Analysis, Insights and Forecast, 2019-2031
- 13.1. Market Analysis, Insights and Forecast - By Country/Sub-region
- 13.1.1 China
- 13.1.2 Japan
- 13.1.3 India
- 13.1.4 South Korea
- 13.1.5 Southeast Asia
- 13.1.6 Australia
- 13.1.7 Indonesia
- 13.1.8 Phillipes
- 13.1.9 Singapore
- 13.1.10 Thailandc
- 13.1.11 Rest of Asia Pacific
- 14. South America Risk Analytics Industry Analysis, Insights and Forecast, 2019-2031
- 14.1. Market Analysis, Insights and Forecast - By Country/Sub-region
- 14.1.1 Brazil
- 14.1.2 Argentina
- 14.1.3 Peru
- 14.1.4 Chile
- 14.1.5 Colombia
- 14.1.6 Ecuador
- 14.1.7 Venezuela
- 14.1.8 Rest of South America
- 15. North America Risk Analytics Industry Analysis, Insights and Forecast, 2019-2031
- 15.1. Market Analysis, Insights and Forecast - By Country/Sub-region
- 15.1.1 United States
- 15.1.2 Canada
- 15.1.3 Mexico
- 16. MEA Risk Analytics Industry Analysis, Insights and Forecast, 2019-2031
- 16.1. Market Analysis, Insights and Forecast - By Country/Sub-region
- 16.1.1 United Arab Emirates
- 16.1.2 Saudi Arabia
- 16.1.3 South Africa
- 16.1.4 Rest of Middle East and Africa
- 17. Competitive Analysis
- 17.1. Global Market Share Analysis 2024
- 17.2. Company Profiles
- 17.2.1 SAS Institute Inc
- 17.2.1.1. Overview
- 17.2.1.2. Products
- 17.2.1.3. SWOT Analysis
- 17.2.1.4. Recent Developments
- 17.2.1.5. Financials (Based on Availability)
- 17.2.2 Accenture PLC
- 17.2.2.1. Overview
- 17.2.2.2. Products
- 17.2.2.3. SWOT Analysis
- 17.2.2.4. Recent Developments
- 17.2.2.5. Financials (Based on Availability)
- 17.2.3 Risk Edge Solutions
- 17.2.3.1. Overview
- 17.2.3.2. Products
- 17.2.3.3. SWOT Analysis
- 17.2.3.4. Recent Developments
- 17.2.3.5. Financials (Based on Availability)
- 17.2.4 IBM Corporation
- 17.2.4.1. Overview
- 17.2.4.2. Products
- 17.2.4.3. SWOT Analysis
- 17.2.4.4. Recent Developments
- 17.2.4.5. Financials (Based on Availability)
- 17.2.5 Capgemini SE
- 17.2.5.1. Overview
- 17.2.5.2. Products
- 17.2.5.3. SWOT Analysis
- 17.2.5.4. Recent Developments
- 17.2.5.5. Financials (Based on Availability)
- 17.2.6 Adenza Group Inc (AxiomSL Ltd )
- 17.2.6.1. Overview
- 17.2.6.2. Products
- 17.2.6.3. SWOT Analysis
- 17.2.6.4. Recent Developments
- 17.2.6.5. Financials (Based on Availability)
- 17.2.7 Provenir Inc
- 17.2.7.1. Overview
- 17.2.7.2. Products
- 17.2.7.3. SWOT Analysis
- 17.2.7.4. Recent Developments
- 17.2.7.5. Financials (Based on Availability)
- 17.2.8 OneSpan Inc
- 17.2.8.1. Overview
- 17.2.8.2. Products
- 17.2.8.3. SWOT Analysis
- 17.2.8.4. Recent Developments
- 17.2.8.5. Financials (Based on Availability)
- 17.2.9 Oracle Corporation
- 17.2.9.1. Overview
- 17.2.9.2. Products
- 17.2.9.3. SWOT Analysis
- 17.2.9.4. Recent Developments
- 17.2.9.5. Financials (Based on Availability)
- 17.2.10 Moody's Analytics Inc
- 17.2.10.1. Overview
- 17.2.10.2. Products
- 17.2.10.3. SWOT Analysis
- 17.2.10.4. Recent Developments
- 17.2.10.5. Financials (Based on Availability)
- 17.2.11 SAP SE
- 17.2.11.1. Overview
- 17.2.11.2. Products
- 17.2.11.3. SWOT Analysis
- 17.2.11.4. Recent Developments
- 17.2.11.5. Financials (Based on Availability)
- 17.2.1 SAS Institute Inc
List of Figures
- Figure 1: Global Risk Analytics Industry Revenue Breakdown (Million, %) by Region 2024 & 2032
- Figure 2: North America Risk Analytics Industry Revenue (Million), by Country 2024 & 2032
- Figure 3: North America Risk Analytics Industry Revenue Share (%), by Country 2024 & 2032
- Figure 4: Europe Risk Analytics Industry Revenue (Million), by Country 2024 & 2032
- Figure 5: Europe Risk Analytics Industry Revenue Share (%), by Country 2024 & 2032
- Figure 6: Asia Pacific Risk Analytics Industry Revenue (Million), by Country 2024 & 2032
- Figure 7: Asia Pacific Risk Analytics Industry Revenue Share (%), by Country 2024 & 2032
- Figure 8: South America Risk Analytics Industry Revenue (Million), by Country 2024 & 2032
- Figure 9: South America Risk Analytics Industry Revenue Share (%), by Country 2024 & 2032
- Figure 10: North America Risk Analytics Industry Revenue (Million), by Country 2024 & 2032
- Figure 11: North America Risk Analytics Industry Revenue Share (%), by Country 2024 & 2032
- Figure 12: MEA Risk Analytics Industry Revenue (Million), by Country 2024 & 2032
- Figure 13: MEA Risk Analytics Industry Revenue Share (%), by Country 2024 & 2032
- Figure 14: North America Risk Analytics Industry Revenue (Million), by Component 2024 & 2032
- Figure 15: North America Risk Analytics Industry Revenue Share (%), by Component 2024 & 2032
- Figure 16: North America Risk Analytics Industry Revenue (Million), by Deployment 2024 & 2032
- Figure 17: North America Risk Analytics Industry Revenue Share (%), by Deployment 2024 & 2032
- Figure 18: North America Risk Analytics Industry Revenue (Million), by End-user Vertical 2024 & 2032
- Figure 19: North America Risk Analytics Industry Revenue Share (%), by End-user Vertical 2024 & 2032
- Figure 20: North America Risk Analytics Industry Revenue (Million), by Country 2024 & 2032
- Figure 21: North America Risk Analytics Industry Revenue Share (%), by Country 2024 & 2032
- Figure 22: Europe Risk Analytics Industry Revenue (Million), by Component 2024 & 2032
- Figure 23: Europe Risk Analytics Industry Revenue Share (%), by Component 2024 & 2032
- Figure 24: Europe Risk Analytics Industry Revenue (Million), by Deployment 2024 & 2032
- Figure 25: Europe Risk Analytics Industry Revenue Share (%), by Deployment 2024 & 2032
- Figure 26: Europe Risk Analytics Industry Revenue (Million), by End-user Vertical 2024 & 2032
- Figure 27: Europe Risk Analytics Industry Revenue Share (%), by End-user Vertical 2024 & 2032
- Figure 28: Europe Risk Analytics Industry Revenue (Million), by Country 2024 & 2032
- Figure 29: Europe Risk Analytics Industry Revenue Share (%), by Country 2024 & 2032
- Figure 30: Asia Risk Analytics Industry Revenue (Million), by Component 2024 & 2032
- Figure 31: Asia Risk Analytics Industry Revenue Share (%), by Component 2024 & 2032
- Figure 32: Asia Risk Analytics Industry Revenue (Million), by Deployment 2024 & 2032
- Figure 33: Asia Risk Analytics Industry Revenue Share (%), by Deployment 2024 & 2032
- Figure 34: Asia Risk Analytics Industry Revenue (Million), by End-user Vertical 2024 & 2032
- Figure 35: Asia Risk Analytics Industry Revenue Share (%), by End-user Vertical 2024 & 2032
- Figure 36: Asia Risk Analytics Industry Revenue (Million), by Country 2024 & 2032
- Figure 37: Asia Risk Analytics Industry Revenue Share (%), by Country 2024 & 2032
- Figure 38: Latin America Risk Analytics Industry Revenue (Million), by Component 2024 & 2032
- Figure 39: Latin America Risk Analytics Industry Revenue Share (%), by Component 2024 & 2032
- Figure 40: Latin America Risk Analytics Industry Revenue (Million), by Deployment 2024 & 2032
- Figure 41: Latin America Risk Analytics Industry Revenue Share (%), by Deployment 2024 & 2032
- Figure 42: Latin America Risk Analytics Industry Revenue (Million), by End-user Vertical 2024 & 2032
- Figure 43: Latin America Risk Analytics Industry Revenue Share (%), by End-user Vertical 2024 & 2032
- Figure 44: Latin America Risk Analytics Industry Revenue (Million), by Country 2024 & 2032
- Figure 45: Latin America Risk Analytics Industry Revenue Share (%), by Country 2024 & 2032
- Figure 46: Middle East and Africa Risk Analytics Industry Revenue (Million), by Component 2024 & 2032
- Figure 47: Middle East and Africa Risk Analytics Industry Revenue Share (%), by Component 2024 & 2032
- Figure 48: Middle East and Africa Risk Analytics Industry Revenue (Million), by Deployment 2024 & 2032
- Figure 49: Middle East and Africa Risk Analytics Industry Revenue Share (%), by Deployment 2024 & 2032
- Figure 50: Middle East and Africa Risk Analytics Industry Revenue (Million), by End-user Vertical 2024 & 2032
- Figure 51: Middle East and Africa Risk Analytics Industry Revenue Share (%), by End-user Vertical 2024 & 2032
- Figure 52: Middle East and Africa Risk Analytics Industry Revenue (Million), by Country 2024 & 2032
- Figure 53: Middle East and Africa Risk Analytics Industry Revenue Share (%), by Country 2024 & 2032
List of Tables
- Table 1: Global Risk Analytics Industry Revenue Million Forecast, by Region 2019 & 2032
- Table 2: Global Risk Analytics Industry Revenue Million Forecast, by Component 2019 & 2032
- Table 3: Global Risk Analytics Industry Revenue Million Forecast, by Deployment 2019 & 2032
- Table 4: Global Risk Analytics Industry Revenue Million Forecast, by End-user Vertical 2019 & 2032
- Table 5: Global Risk Analytics Industry Revenue Million Forecast, by Region 2019 & 2032
- Table 6: Global Risk Analytics Industry Revenue Million Forecast, by Country 2019 & 2032
- Table 7: United States Risk Analytics Industry Revenue (Million) Forecast, by Application 2019 & 2032
- Table 8: Canada Risk Analytics Industry Revenue (Million) Forecast, by Application 2019 & 2032
- Table 9: Mexico Risk Analytics Industry Revenue (Million) Forecast, by Application 2019 & 2032
- Table 10: Global Risk Analytics Industry Revenue Million Forecast, by Country 2019 & 2032
- Table 11: Germany Risk Analytics Industry Revenue (Million) Forecast, by Application 2019 & 2032
- Table 12: United Kingdom Risk Analytics Industry Revenue (Million) Forecast, by Application 2019 & 2032
- Table 13: France Risk Analytics Industry Revenue (Million) Forecast, by Application 2019 & 2032
- Table 14: Spain Risk Analytics Industry Revenue (Million) Forecast, by Application 2019 & 2032
- Table 15: Italy Risk Analytics Industry Revenue (Million) Forecast, by Application 2019 & 2032
- Table 16: Spain Risk Analytics Industry Revenue (Million) Forecast, by Application 2019 & 2032
- Table 17: Belgium Risk Analytics Industry Revenue (Million) Forecast, by Application 2019 & 2032
- Table 18: Netherland Risk Analytics Industry Revenue (Million) Forecast, by Application 2019 & 2032
- Table 19: Nordics Risk Analytics Industry Revenue (Million) Forecast, by Application 2019 & 2032
- Table 20: Rest of Europe Risk Analytics Industry Revenue (Million) Forecast, by Application 2019 & 2032
- Table 21: Global Risk Analytics Industry Revenue Million Forecast, by Country 2019 & 2032
- Table 22: China Risk Analytics Industry Revenue (Million) Forecast, by Application 2019 & 2032
- Table 23: Japan Risk Analytics Industry Revenue (Million) Forecast, by Application 2019 & 2032
- Table 24: India Risk Analytics Industry Revenue (Million) Forecast, by Application 2019 & 2032
- Table 25: South Korea Risk Analytics Industry Revenue (Million) Forecast, by Application 2019 & 2032
- Table 26: Southeast Asia Risk Analytics Industry Revenue (Million) Forecast, by Application 2019 & 2032
- Table 27: Australia Risk Analytics Industry Revenue (Million) Forecast, by Application 2019 & 2032
- Table 28: Indonesia Risk Analytics Industry Revenue (Million) Forecast, by Application 2019 & 2032
- Table 29: Phillipes Risk Analytics Industry Revenue (Million) Forecast, by Application 2019 & 2032
- Table 30: Singapore Risk Analytics Industry Revenue (Million) Forecast, by Application 2019 & 2032
- Table 31: Thailandc Risk Analytics Industry Revenue (Million) Forecast, by Application 2019 & 2032
- Table 32: Rest of Asia Pacific Risk Analytics Industry Revenue (Million) Forecast, by Application 2019 & 2032
- Table 33: Global Risk Analytics Industry Revenue Million Forecast, by Country 2019 & 2032
- Table 34: Brazil Risk Analytics Industry Revenue (Million) Forecast, by Application 2019 & 2032
- Table 35: Argentina Risk Analytics Industry Revenue (Million) Forecast, by Application 2019 & 2032
- Table 36: Peru Risk Analytics Industry Revenue (Million) Forecast, by Application 2019 & 2032
- Table 37: Chile Risk Analytics Industry Revenue (Million) Forecast, by Application 2019 & 2032
- Table 38: Colombia Risk Analytics Industry Revenue (Million) Forecast, by Application 2019 & 2032
- Table 39: Ecuador Risk Analytics Industry Revenue (Million) Forecast, by Application 2019 & 2032
- Table 40: Venezuela Risk Analytics Industry Revenue (Million) Forecast, by Application 2019 & 2032
- Table 41: Rest of South America Risk Analytics Industry Revenue (Million) Forecast, by Application 2019 & 2032
- Table 42: Global Risk Analytics Industry Revenue Million Forecast, by Country 2019 & 2032
- Table 43: United States Risk Analytics Industry Revenue (Million) Forecast, by Application 2019 & 2032
- Table 44: Canada Risk Analytics Industry Revenue (Million) Forecast, by Application 2019 & 2032
- Table 45: Mexico Risk Analytics Industry Revenue (Million) Forecast, by Application 2019 & 2032
- Table 46: Global Risk Analytics Industry Revenue Million Forecast, by Country 2019 & 2032
- Table 47: United Arab Emirates Risk Analytics Industry Revenue (Million) Forecast, by Application 2019 & 2032
- Table 48: Saudi Arabia Risk Analytics Industry Revenue (Million) Forecast, by Application 2019 & 2032
- Table 49: South Africa Risk Analytics Industry Revenue (Million) Forecast, by Application 2019 & 2032
- Table 50: Rest of Middle East and Africa Risk Analytics Industry Revenue (Million) Forecast, by Application 2019 & 2032
- Table 51: Global Risk Analytics Industry Revenue Million Forecast, by Component 2019 & 2032
- Table 52: Global Risk Analytics Industry Revenue Million Forecast, by Deployment 2019 & 2032
- Table 53: Global Risk Analytics Industry Revenue Million Forecast, by End-user Vertical 2019 & 2032
- Table 54: Global Risk Analytics Industry Revenue Million Forecast, by Country 2019 & 2032
- Table 55: United States Risk Analytics Industry Revenue (Million) Forecast, by Application 2019 & 2032
- Table 56: Canada Risk Analytics Industry Revenue (Million) Forecast, by Application 2019 & 2032
- Table 57: Global Risk Analytics Industry Revenue Million Forecast, by Component 2019 & 2032
- Table 58: Global Risk Analytics Industry Revenue Million Forecast, by Deployment 2019 & 2032
- Table 59: Global Risk Analytics Industry Revenue Million Forecast, by End-user Vertical 2019 & 2032
- Table 60: Global Risk Analytics Industry Revenue Million Forecast, by Country 2019 & 2032
- Table 61: Germany Risk Analytics Industry Revenue (Million) Forecast, by Application 2019 & 2032
- Table 62: United Kingdom Risk Analytics Industry Revenue (Million) Forecast, by Application 2019 & 2032
- Table 63: France Risk Analytics Industry Revenue (Million) Forecast, by Application 2019 & 2032
- Table 64: Spain Risk Analytics Industry Revenue (Million) Forecast, by Application 2019 & 2032
- Table 65: Global Risk Analytics Industry Revenue Million Forecast, by Component 2019 & 2032
- Table 66: Global Risk Analytics Industry Revenue Million Forecast, by Deployment 2019 & 2032
- Table 67: Global Risk Analytics Industry Revenue Million Forecast, by End-user Vertical 2019 & 2032
- Table 68: Global Risk Analytics Industry Revenue Million Forecast, by Country 2019 & 2032
- Table 69: China Risk Analytics Industry Revenue (Million) Forecast, by Application 2019 & 2032
- Table 70: Japan Risk Analytics Industry Revenue (Million) Forecast, by Application 2019 & 2032
- Table 71: India Risk Analytics Industry Revenue (Million) Forecast, by Application 2019 & 2032
- Table 72: Australia and New Zealand Risk Analytics Industry Revenue (Million) Forecast, by Application 2019 & 2032
- Table 73: Global Risk Analytics Industry Revenue Million Forecast, by Component 2019 & 2032
- Table 74: Global Risk Analytics Industry Revenue Million Forecast, by Deployment 2019 & 2032
- Table 75: Global Risk Analytics Industry Revenue Million Forecast, by End-user Vertical 2019 & 2032
- Table 76: Global Risk Analytics Industry Revenue Million Forecast, by Country 2019 & 2032
- Table 77: Brazil Risk Analytics Industry Revenue (Million) Forecast, by Application 2019 & 2032
- Table 78: Mexico Risk Analytics Industry Revenue (Million) Forecast, by Application 2019 & 2032
- Table 79: Argentina Risk Analytics Industry Revenue (Million) Forecast, by Application 2019 & 2032
- Table 80: Global Risk Analytics Industry Revenue Million Forecast, by Component 2019 & 2032
- Table 81: Global Risk Analytics Industry Revenue Million Forecast, by Deployment 2019 & 2032
- Table 82: Global Risk Analytics Industry Revenue Million Forecast, by End-user Vertical 2019 & 2032
- Table 83: Global Risk Analytics Industry Revenue Million Forecast, by Country 2019 & 2032
- Table 84: United Arab Emirates Risk Analytics Industry Revenue (Million) Forecast, by Application 2019 & 2032
- Table 85: Saudi Arabia Risk Analytics Industry Revenue (Million) Forecast, by Application 2019 & 2032
- Table 86: South Africa Risk Analytics Industry Revenue (Million) Forecast, by Application 2019 & 2032
Frequently Asked Questions
1. What is the projected Compound Annual Growth Rate (CAGR) of the Risk Analytics Industry?
The projected CAGR is approximately 12.84%.
2. Which companies are prominent players in the Risk Analytics Industry?
Key companies in the market include SAS Institute Inc, Accenture PLC, Risk Edge Solutions, IBM Corporation, Capgemini SE, Adenza Group Inc (AxiomSL Ltd ), Provenir Inc, OneSpan Inc, Oracle Corporation, Moody's Analytics Inc, SAP SE.
3. What are the main segments of the Risk Analytics Industry?
The market segments include Component, Deployment, End-user Vertical.
4. Can you provide details about the market size?
The market size is estimated to be USD 47.48 Million as of 2022.
5. What are some drivers contributing to market growth?
Growing Complexities across Business Processes; Global Regulatory Frameworks and Government Policies.
6. What are the notable trends driving market growth?
BFSI is Expected to Witness Huge Adoption of Risk Analytics Solutions.
7. Are there any restraints impacting market growth?
High Installation and Operational Costs; Complicated Regulatory Compliance might hinder the Market Growth.
8. Can you provide examples of recent developments in the market?
November 2023 - SimCorp, a Denmark-based software company, announced it will merge with Axioma, a global supplier of multi-asset class enterprise risk solutions, factor risk models, and tools for building portfolios. This dynamic, front-to-back platform remains crucial due to the combined strength of Axioma and SimCorp. As its primary growth market, SimCorp's merger with Axioma strengthens its position in significant regions like North America.
9. What pricing options are available for accessing the report?
Pricing options include single-user, multi-user, and enterprise licenses priced at USD 4750, USD 5250, and USD 8750 respectively.
10. Is the market size provided in terms of value or volume?
The market size is provided in terms of value, measured in Million.
11. Are there any specific market keywords associated with the report?
Yes, the market keyword associated with the report is "Risk Analytics Industry," which aids in identifying and referencing the specific market segment covered.
12. How do I determine which pricing option suits my needs best?
The pricing options vary based on user requirements and access needs. Individual users may opt for single-user licenses, while businesses requiring broader access may choose multi-user or enterprise licenses for cost-effective access to the report.
13. Are there any additional resources or data provided in the Risk Analytics Industry report?
While the report offers comprehensive insights, it's advisable to review the specific contents or supplementary materials provided to ascertain if additional resources or data are available.
14. How can I stay updated on further developments or reports in the Risk Analytics Industry?
To stay informed about further developments, trends, and reports in the Risk Analytics Industry, consider subscribing to industry newsletters, following relevant companies and organizations, or regularly checking reputable industry news sources and publications.
Methodology
Step 1 - Identification of Relevant Samples Size from Population Database


Step 2 - Approaches for Defining Global Market Size (Value, Volume* & Price*)

Note*: In applicable scenarios
Step 3 - Data Sources
Primary Research
- Web Analytics
- Survey Reports
- Research Institute
- Latest Research Reports
- Opinion Leaders
Secondary Research
- Annual Reports
- White Paper
- Latest Press Release
- Industry Association
- Paid Database
- Investor Presentations

Step 4 - Data Triangulation
Involves using different sources of information in order to increase the validity of a study
These sources are likely to be stakeholders in a program - participants, other researchers, program staff, other community members, and so on.
Then we put all data in single framework & apply various statistical tools to find out the dynamic on the market.
During the analysis stage, feedback from the stakeholder groups would be compared to determine areas of agreement as well as areas of divergence
