

Key Insights
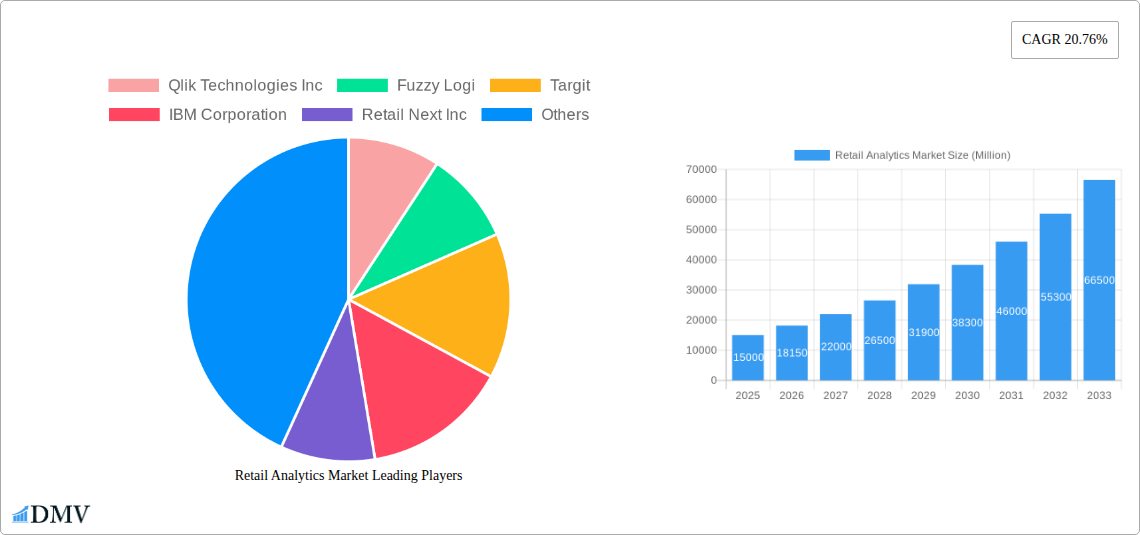
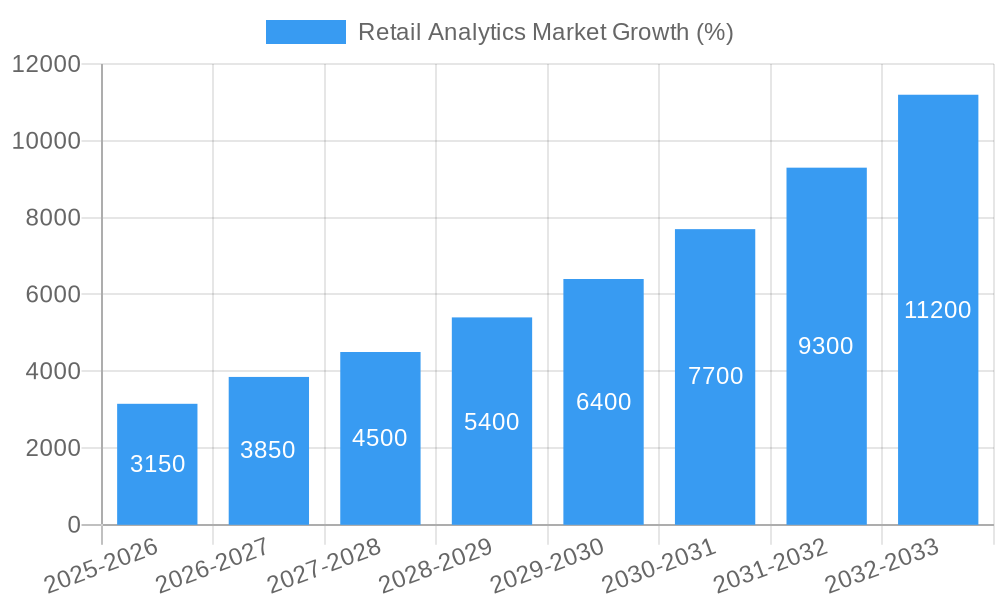
The global retail analytics market is experiencing robust growth, driven by the increasing need for retailers to leverage data-driven insights for enhanced decision-making. With a CAGR of 20.76% from 2019-2024, the market demonstrates a significant upward trajectory, projected to continue its expansion throughout the forecast period (2025-2033). Key drivers include the rising adoption of cloud-based solutions, the proliferation of big data, and the increasing focus on personalized customer experiences. The shift towards omnichannel retailing further fuels this growth, demanding sophisticated analytics to understand customer behavior across multiple touchpoints. Market segmentation reveals a strong preference for cloud-based deployment, indicating a preference for scalability and cost-effectiveness. Solution-based offerings, encompassing analytics, visualization tools, and data management, dominate the market share, underscoring the crucial role of data processing and interpretation in retail strategies. Within modules, strategy & planning, marketing, and financial management are high-demand areas, emphasizing the holistic approach retailers are adopting for data-driven optimization across their operations. Large-scale organizations currently hold a larger market share than SMEs, reflecting their greater resources and need for sophisticated analytics; however, increasing digital adoption among SMEs is expected to drive growth in this segment. Geographically, mature markets like the UK, Germany, and France, along with rapidly developing economies in Asia-Pacific (China, India, and others), present significant opportunities. Competition is intense, with established players like IBM, SAP, and Oracle competing alongside innovative startups, creating a dynamic and evolving landscape.
The market's continued growth will be influenced by several factors. Advancements in artificial intelligence (AI) and machine learning (ML) are expected to further enhance the capabilities of retail analytics solutions, leading to more accurate predictions and improved decision-making. The increasing adoption of Internet of Things (IoT) devices in retail settings will generate even larger volumes of data, driving the demand for more powerful and efficient analytics platforms. However, challenges remain, such as data security concerns, the need for skilled data analysts, and the complexities of integrating diverse data sources. Addressing these challenges will be crucial for sustained market growth and wider adoption of retail analytics across the industry. The market is poised for significant expansion, fuelled by the relentless drive for efficiency, personalization, and competitive advantage within the retail sector.
Retail Analytics Market: A Comprehensive Report (2019-2033)
This insightful report provides a comprehensive analysis of the Retail Analytics Market, projecting a market valuation of XX Million by 2033. It delves into market dynamics, competitive landscapes, and future growth opportunities, equipping stakeholders with actionable intelligence for strategic decision-making. The study period spans 2019-2033, with 2025 serving as the base and estimated year. The report covers the historical period (2019-2024) and forecasts market trends from 2025-2033.
Retail Analytics Market Composition & Trends
This section evaluates the current market landscape, identifying key trends and influential factors shaping the Retail Analytics Market's evolution. We analyze market concentration, examining the market share distribution among key players such as Qlik Technologies Inc, Fuzzy Logi, Targit, IBM Corporation, Retail Next Inc, Adobe Systems Incorporated, Pentaho Corporation, Microstrategy Inc, Zoho Corporation, Tableau Software Inc, Alteryx Inc, Oracle Corporation, ZAP Business Intelligence, SAP SE, and Prevedere Software Inc. The report also explores innovation catalysts, including advancements in AI and machine learning, and assesses the impact of regulatory landscapes and substitute products on market growth. Furthermore, we analyze the profiles of end-users (Small & Medium Enterprises, Large-scale organizations) and the influence of M&A activities, including deal values (estimated at XX Million in total during the historical period), on market consolidation.
- Market Concentration: The market exhibits a moderately concentrated structure with a few major players holding significant market share. Further analysis reveals a detailed breakdown of market share distribution.
- Innovation Catalysts: Advancements in AI, cloud computing, and big data analytics are driving innovation and creating new opportunities for growth.
- Regulatory Landscape: Emerging data privacy regulations are influencing market dynamics and shaping vendor strategies.
- M&A Activity: Consolidation through mergers and acquisitions is reshaping the competitive landscape. Significant M&A deal values (XX Million) have been recorded during the historical period.
Retail Analytics Market Industry Evolution
This section provides a detailed analysis of the Retail Analytics Market's growth trajectory, technological advancements, and evolving consumer demands from 2019 to 2033. We examine the market's growth rates (XX% CAGR during the forecast period), adoption metrics across various segments, and the impact of technological advancements such as cloud-based analytics and the Internet of Things (IoT) on market expansion. The increasing need for data-driven decision-making among retailers, coupled with the rise of omnichannel retail, fuels market growth. We analyze shifts in consumer behavior, emphasizing the preference for personalized experiences and the importance of data security in shaping market trends.
Leading Regions, Countries, or Segments in Retail Analytics Market
This section identifies the leading regions, countries, and segments within the Retail Analytics Market. We analyze market dominance across various segments, including:
By Mode of Deployment:
- Cloud: The cloud-based deployment model is experiencing rapid growth due to its scalability, cost-effectiveness, and accessibility. Key drivers include reduced IT infrastructure costs and increased flexibility.
- On-Premise: While on-premise deployments remain significant, their market share is gradually declining compared to cloud-based solutions.
By Type:
- Solutions: The solutions segment, encompassing analytics, visualization tools, and data management, dominates the market due to the increasing demand for advanced analytical capabilities.
- Services: The services segment, including integration, support, and consulting, exhibits strong growth potential due to the need for expert assistance in implementing and managing retail analytics solutions.
By Module Type:
- Marketing: The Marketing module (pricing, loyalty, and segment analysis) is a key growth driver, reflecting the increasing importance of targeted marketing campaigns.
- Supply Chain Management: The Supply Chain Management module (inventory, vendor, and supply-demand modeling) gains traction due to the need for efficient supply chain optimization.
By Business Type:
- Large-scale organizations: Large enterprises invest significantly in retail analytics solutions due to their high data volumes and complex business operations.
By Country:
- United Kingdom: The UK enjoys a robust retail sector and an advanced technological infrastructure, driving market growth.
- Germany: Germany's strong economy and focus on digital transformation contribute to substantial market adoption.
- France: France's burgeoning e-commerce market fuels demand for retail analytics solutions.
Retail Analytics Market Product Innovations
Recent product innovations focus on enhancing the accuracy and efficiency of retail analytics solutions. New features include advanced AI algorithms for predictive modeling, improved data visualization tools for actionable insights, and integrated platforms that streamline data management and analysis. These innovations provide unique selling propositions (USPs) including enhanced user experiences, better predictive capabilities, and increased automation.
Propelling Factors for Retail Analytics Market Growth
Several key factors fuel the growth of the Retail Analytics Market. Technological advancements, particularly in AI and machine learning, significantly improve data analysis and prediction capabilities. The increasing adoption of omnichannel strategies and the need for personalized customer experiences drive demand for robust analytics solutions. Favorable government regulations supporting data-driven decision-making also contribute to market expansion.
Obstacles in the Retail Analytics Market
Challenges hindering market growth include concerns regarding data security and privacy, the complexity of integrating diverse data sources, and the high cost of implementation and maintenance of advanced analytics solutions. Competition among established vendors and emerging startups creates price pressures. Supply chain disruptions may impact the availability of hardware and software components, affecting market expansion.
Future Opportunities in Retail Analytics Market
Future opportunities lie in the expansion of retail analytics solutions to emerging markets, the integration of new technologies (e.g., blockchain and edge computing), and the rising adoption of predictive analytics for enhanced supply chain optimization and personalized customer service.
Major Players in the Retail Analytics Market Ecosystem
- Qlik Technologies Inc
- Fuzzy Logi
- Targit
- IBM Corporation
- Retail Next Inc
- Adobe Systems Incorporated
- Pentaho Corporation
- Microstrategy Inc
- Zoho Corporation
- Tableau Software Inc
- Alteryx Inc
- Oracle Corporation
- ZAP Business Intelligence
- SAP SE
- Prevedere Software Inc
Key Developments in Retail Analytics Market Industry
- January 2022: dunnhumby and SAP announced a strategic partnership to integrate customer insights into retail marketing and merchandising, driving personalized shopping experiences.
- June 2022: Lytho Inc. launched Creative Window software, expanding its reach in retail and other sectors.
Strategic Retail Analytics Market Forecast
The Retail Analytics Market is poised for significant growth driven by increasing demand for data-driven insights, technological advancements, and the expanding adoption of omnichannel strategies. The market's future potential is substantial, with continued innovation and strategic partnerships shaping its trajectory. The projected CAGR for the forecast period is expected to be XX%.
Retail Analytics Market Segmentation
-
1. Mode of Deployment
- 1.1. On-Premise
- 1.2. Cloud
-
2. Type
- 2.1. Solution
- 2.2. Services (Integration, Support & Consulting)
-
3. Module Type
- 3.1. Strategy
- 3.2. Marketing (Pricing, Loyalty and Segment Analysis)
- 3.3. Financial Management (Accounts Management)
- 3.4. Store Op
- 3.5. Merchand
- 3.6. Supply C
- 3.7. Other Module Types
-
4. Business Type
- 4.1. Small & Medium Enterprises
- 4.2. Large-scale organizations
Retail Analytics Market Segmentation By Geography
-
1. North America
- 1.1. United States
- 1.2. Canada
- 1.3. Mexico
-
2. South America
- 2.1. Brazil
- 2.2. Argentina
- 2.3. Rest of South America
-
3. Europe
- 3.1. United Kingdom
- 3.2. Germany
- 3.3. France
- 3.4. Italy
- 3.5. Spain
- 3.6. Russia
- 3.7. Benelux
- 3.8. Nordics
- 3.9. Rest of Europe
-
4. Middle East & Africa
- 4.1. Turkey
- 4.2. Israel
- 4.3. GCC
- 4.4. North Africa
- 4.5. South Africa
- 4.6. Rest of Middle East & Africa
-
5. Asia Pacific
- 5.1. China
- 5.2. India
- 5.3. Japan
- 5.4. South Korea
- 5.5. ASEAN
- 5.6. Oceania
- 5.7. Rest of Asia Pacific

Retail Analytics Market REPORT HIGHLIGHTS
| Aspects | Details |
|---|---|
| Study Period | 2019-2033 |
| Base Year | 2024 |
| Estimated Year | 2025 |
| Forecast Period | 2025-2033 |
| Historical Period | 2019-2024 |
| Growth Rate | CAGR of 20.76% from 2019-2033 |
| Segmentation |
|
Table of Contents
- 1. Introduction
- 1.1. Research Scope
- 1.2. Market Segmentation
- 1.3. Research Methodology
- 1.4. Definitions and Assumptions
- 2. Executive Summary
- 2.1. Introduction
- 3. Market Dynamics
- 3.1. Introduction
- 3.2. Market Drivers
- 3.2.1. Increased Emphasis on Predictive Analysis; Sustained Increase in Volume of Data; Growing Demand for Sales Forecasting
- 3.3. Market Restrains
- 3.3.1. Lack of General Awareness and Expertise in Emerging Regions; Standardization and Integration Issues
- 3.4. Market Trends
- 3.4.1. Cloud Segment is One of the Factors Driving the Market
- 4. Market Factor Analysis
- 4.1. Porters Five Forces
- 4.2. Supply/Value Chain
- 4.3. PESTEL analysis
- 4.4. Market Entropy
- 4.5. Patent/Trademark Analysis
- 5. Global Retail Analytics Market Analysis, Insights and Forecast, 2019-2031
- 5.1. Market Analysis, Insights and Forecast - by Mode of Deployment
- 5.1.1. On-Premise
- 5.1.2. Cloud
- 5.2. Market Analysis, Insights and Forecast - by Type
- 5.2.1. Solution
- 5.2.2. Services (Integration, Support & Consulting)
- 5.3. Market Analysis, Insights and Forecast - by Module Type
- 5.3.1. Strategy
- 5.3.2. Marketing (Pricing, Loyalty and Segment Analysis)
- 5.3.3. Financial Management (Accounts Management)
- 5.3.4. Store Op
- 5.3.5. Merchand
- 5.3.6. Supply C
- 5.3.7. Other Module Types
- 5.4. Market Analysis, Insights and Forecast - by Business Type
- 5.4.1. Small & Medium Enterprises
- 5.4.2. Large-scale organizations
- 5.5. Market Analysis, Insights and Forecast - by Region
- 5.5.1. North America
- 5.5.2. South America
- 5.5.3. Europe
- 5.5.4. Middle East & Africa
- 5.5.5. Asia Pacific
- 5.1. Market Analysis, Insights and Forecast - by Mode of Deployment
- 6. North America Retail Analytics Market Analysis, Insights and Forecast, 2019-2031
- 6.1. Market Analysis, Insights and Forecast - by Mode of Deployment
- 6.1.1. On-Premise
- 6.1.2. Cloud
- 6.2. Market Analysis, Insights and Forecast - by Type
- 6.2.1. Solution
- 6.2.2. Services (Integration, Support & Consulting)
- 6.3. Market Analysis, Insights and Forecast - by Module Type
- 6.3.1. Strategy
- 6.3.2. Marketing (Pricing, Loyalty and Segment Analysis)
- 6.3.3. Financial Management (Accounts Management)
- 6.3.4. Store Op
- 6.3.5. Merchand
- 6.3.6. Supply C
- 6.3.7. Other Module Types
- 6.4. Market Analysis, Insights and Forecast - by Business Type
- 6.4.1. Small & Medium Enterprises
- 6.4.2. Large-scale organizations
- 6.1. Market Analysis, Insights and Forecast - by Mode of Deployment
- 7. South America Retail Analytics Market Analysis, Insights and Forecast, 2019-2031
- 7.1. Market Analysis, Insights and Forecast - by Mode of Deployment
- 7.1.1. On-Premise
- 7.1.2. Cloud
- 7.2. Market Analysis, Insights and Forecast - by Type
- 7.2.1. Solution
- 7.2.2. Services (Integration, Support & Consulting)
- 7.3. Market Analysis, Insights and Forecast - by Module Type
- 7.3.1. Strategy
- 7.3.2. Marketing (Pricing, Loyalty and Segment Analysis)
- 7.3.3. Financial Management (Accounts Management)
- 7.3.4. Store Op
- 7.3.5. Merchand
- 7.3.6. Supply C
- 7.3.7. Other Module Types
- 7.4. Market Analysis, Insights and Forecast - by Business Type
- 7.4.1. Small & Medium Enterprises
- 7.4.2. Large-scale organizations
- 7.1. Market Analysis, Insights and Forecast - by Mode of Deployment
- 8. Europe Retail Analytics Market Analysis, Insights and Forecast, 2019-2031
- 8.1. Market Analysis, Insights and Forecast - by Mode of Deployment
- 8.1.1. On-Premise
- 8.1.2. Cloud
- 8.2. Market Analysis, Insights and Forecast - by Type
- 8.2.1. Solution
- 8.2.2. Services (Integration, Support & Consulting)
- 8.3. Market Analysis, Insights and Forecast - by Module Type
- 8.3.1. Strategy
- 8.3.2. Marketing (Pricing, Loyalty and Segment Analysis)
- 8.3.3. Financial Management (Accounts Management)
- 8.3.4. Store Op
- 8.3.5. Merchand
- 8.3.6. Supply C
- 8.3.7. Other Module Types
- 8.4. Market Analysis, Insights and Forecast - by Business Type
- 8.4.1. Small & Medium Enterprises
- 8.4.2. Large-scale organizations
- 8.1. Market Analysis, Insights and Forecast - by Mode of Deployment
- 9. Middle East & Africa Retail Analytics Market Analysis, Insights and Forecast, 2019-2031
- 9.1. Market Analysis, Insights and Forecast - by Mode of Deployment
- 9.1.1. On-Premise
- 9.1.2. Cloud
- 9.2. Market Analysis, Insights and Forecast - by Type
- 9.2.1. Solution
- 9.2.2. Services (Integration, Support & Consulting)
- 9.3. Market Analysis, Insights and Forecast - by Module Type
- 9.3.1. Strategy
- 9.3.2. Marketing (Pricing, Loyalty and Segment Analysis)
- 9.3.3. Financial Management (Accounts Management)
- 9.3.4. Store Op
- 9.3.5. Merchand
- 9.3.6. Supply C
- 9.3.7. Other Module Types
- 9.4. Market Analysis, Insights and Forecast - by Business Type
- 9.4.1. Small & Medium Enterprises
- 9.4.2. Large-scale organizations
- 9.1. Market Analysis, Insights and Forecast - by Mode of Deployment
- 10. Asia Pacific Retail Analytics Market Analysis, Insights and Forecast, 2019-2031
- 10.1. Market Analysis, Insights and Forecast - by Mode of Deployment
- 10.1.1. On-Premise
- 10.1.2. Cloud
- 10.2. Market Analysis, Insights and Forecast - by Type
- 10.2.1. Solution
- 10.2.2. Services (Integration, Support & Consulting)
- 10.3. Market Analysis, Insights and Forecast - by Module Type
- 10.3.1. Strategy
- 10.3.2. Marketing (Pricing, Loyalty and Segment Analysis)
- 10.3.3. Financial Management (Accounts Management)
- 10.3.4. Store Op
- 10.3.5. Merchand
- 10.3.6. Supply C
- 10.3.7. Other Module Types
- 10.4. Market Analysis, Insights and Forecast - by Business Type
- 10.4.1. Small & Medium Enterprises
- 10.4.2. Large-scale organizations
- 10.1. Market Analysis, Insights and Forecast - by Mode of Deployment
- 11. China Retail Analytics Market Analysis, Insights and Forecast, 2019-2031
- 11.1. Market Analysis, Insights and Forecast - By Country/Sub-region
- 11.1.1.
- 12. India Retail Analytics Market Analysis, Insights and Forecast, 2019-2031
- 12.1. Market Analysis, Insights and Forecast - By Country/Sub-region
- 12.1.1.
- 13. Japan Retail Analytics Market Analysis, Insights and Forecast, 2019-2031
- 13.1. Market Analysis, Insights and Forecast - By Country/Sub-region
- 13.1.1.
- 14. South Korea Retail Analytics Market Analysis, Insights and Forecast, 2019-2031
- 14.1. Market Analysis, Insights and Forecast - By Country/Sub-region
- 14.1.1.
- 15. Rest of Asia Pacific Retail Analytics Market Analysis, Insights and Forecast, 2019-2031
- 15.1. Market Analysis, Insights and Forecast - By Country/Sub-region
- 15.1.1.
- 16. Competitive Analysis
- 16.1. Global Market Share Analysis 2024
- 16.2. Company Profiles
- 16.2.1 Qlik Technologies Inc
- 16.2.1.1. Overview
- 16.2.1.2. Products
- 16.2.1.3. SWOT Analysis
- 16.2.1.4. Recent Developments
- 16.2.1.5. Financials (Based on Availability)
- 16.2.2 Fuzzy Logi
- 16.2.2.1. Overview
- 16.2.2.2. Products
- 16.2.2.3. SWOT Analysis
- 16.2.2.4. Recent Developments
- 16.2.2.5. Financials (Based on Availability)
- 16.2.3 Targit
- 16.2.3.1. Overview
- 16.2.3.2. Products
- 16.2.3.3. SWOT Analysis
- 16.2.3.4. Recent Developments
- 16.2.3.5. Financials (Based on Availability)
- 16.2.4 IBM Corporation
- 16.2.4.1. Overview
- 16.2.4.2. Products
- 16.2.4.3. SWOT Analysis
- 16.2.4.4. Recent Developments
- 16.2.4.5. Financials (Based on Availability)
- 16.2.5 Retail Next Inc
- 16.2.5.1. Overview
- 16.2.5.2. Products
- 16.2.5.3. SWOT Analysis
- 16.2.5.4. Recent Developments
- 16.2.5.5. Financials (Based on Availability)
- 16.2.6 Adobe Systems Incorporated
- 16.2.6.1. Overview
- 16.2.6.2. Products
- 16.2.6.3. SWOT Analysis
- 16.2.6.4. Recent Developments
- 16.2.6.5. Financials (Based on Availability)
- 16.2.7 Pentaho Corporation
- 16.2.7.1. Overview
- 16.2.7.2. Products
- 16.2.7.3. SWOT Analysis
- 16.2.7.4. Recent Developments
- 16.2.7.5. Financials (Based on Availability)
- 16.2.8 Microstrategy Inc
- 16.2.8.1. Overview
- 16.2.8.2. Products
- 16.2.8.3. SWOT Analysis
- 16.2.8.4. Recent Developments
- 16.2.8.5. Financials (Based on Availability)
- 16.2.9 Zoho Corporation
- 16.2.9.1. Overview
- 16.2.9.2. Products
- 16.2.9.3. SWOT Analysis
- 16.2.9.4. Recent Developments
- 16.2.9.5. Financials (Based on Availability)
- 16.2.10 Tableau Software Inc
- 16.2.10.1. Overview
- 16.2.10.2. Products
- 16.2.10.3. SWOT Analysis
- 16.2.10.4. Recent Developments
- 16.2.10.5. Financials (Based on Availability)
- 16.2.11 Alteryx Inc
- 16.2.11.1. Overview
- 16.2.11.2. Products
- 16.2.11.3. SWOT Analysis
- 16.2.11.4. Recent Developments
- 16.2.11.5. Financials (Based on Availability)
- 16.2.12 Oracle Corporation
- 16.2.12.1. Overview
- 16.2.12.2. Products
- 16.2.12.3. SWOT Analysis
- 16.2.12.4. Recent Developments
- 16.2.12.5. Financials (Based on Availability)
- 16.2.13 ZAP Business Intelligence
- 16.2.13.1. Overview
- 16.2.13.2. Products
- 16.2.13.3. SWOT Analysis
- 16.2.13.4. Recent Developments
- 16.2.13.5. Financials (Based on Availability)
- 16.2.14 SAP SE
- 16.2.14.1. Overview
- 16.2.14.2. Products
- 16.2.14.3. SWOT Analysis
- 16.2.14.4. Recent Developments
- 16.2.14.5. Financials (Based on Availability)
- 16.2.15 Prevedere Software Inc
- 16.2.15.1. Overview
- 16.2.15.2. Products
- 16.2.15.3. SWOT Analysis
- 16.2.15.4. Recent Developments
- 16.2.15.5. Financials (Based on Availability)
- 16.2.1 Qlik Technologies Inc
List of Figures
- Figure 1: Global Retail Analytics Market Revenue Breakdown (Million, %) by Region 2024 & 2032
- Figure 2: China Retail Analytics Market Revenue (Million), by Country 2024 & 2032
- Figure 3: China Retail Analytics Market Revenue Share (%), by Country 2024 & 2032
- Figure 4: India Retail Analytics Market Revenue (Million), by Country 2024 & 2032
- Figure 5: India Retail Analytics Market Revenue Share (%), by Country 2024 & 2032
- Figure 6: Japan Retail Analytics Market Revenue (Million), by Country 2024 & 2032
- Figure 7: Japan Retail Analytics Market Revenue Share (%), by Country 2024 & 2032
- Figure 8: South Korea Retail Analytics Market Revenue (Million), by Country 2024 & 2032
- Figure 9: South Korea Retail Analytics Market Revenue Share (%), by Country 2024 & 2032
- Figure 10: Rest of Asia Pacific Retail Analytics Market Revenue (Million), by Country 2024 & 2032
- Figure 11: Rest of Asia Pacific Retail Analytics Market Revenue Share (%), by Country 2024 & 2032
- Figure 12: North America Retail Analytics Market Revenue (Million), by Mode of Deployment 2024 & 2032
- Figure 13: North America Retail Analytics Market Revenue Share (%), by Mode of Deployment 2024 & 2032
- Figure 14: North America Retail Analytics Market Revenue (Million), by Type 2024 & 2032
- Figure 15: North America Retail Analytics Market Revenue Share (%), by Type 2024 & 2032
- Figure 16: North America Retail Analytics Market Revenue (Million), by Module Type 2024 & 2032
- Figure 17: North America Retail Analytics Market Revenue Share (%), by Module Type 2024 & 2032
- Figure 18: North America Retail Analytics Market Revenue (Million), by Business Type 2024 & 2032
- Figure 19: North America Retail Analytics Market Revenue Share (%), by Business Type 2024 & 2032
- Figure 20: North America Retail Analytics Market Revenue (Million), by Country 2024 & 2032
- Figure 21: North America Retail Analytics Market Revenue Share (%), by Country 2024 & 2032
- Figure 22: South America Retail Analytics Market Revenue (Million), by Mode of Deployment 2024 & 2032
- Figure 23: South America Retail Analytics Market Revenue Share (%), by Mode of Deployment 2024 & 2032
- Figure 24: South America Retail Analytics Market Revenue (Million), by Type 2024 & 2032
- Figure 25: South America Retail Analytics Market Revenue Share (%), by Type 2024 & 2032
- Figure 26: South America Retail Analytics Market Revenue (Million), by Module Type 2024 & 2032
- Figure 27: South America Retail Analytics Market Revenue Share (%), by Module Type 2024 & 2032
- Figure 28: South America Retail Analytics Market Revenue (Million), by Business Type 2024 & 2032
- Figure 29: South America Retail Analytics Market Revenue Share (%), by Business Type 2024 & 2032
- Figure 30: South America Retail Analytics Market Revenue (Million), by Country 2024 & 2032
- Figure 31: South America Retail Analytics Market Revenue Share (%), by Country 2024 & 2032
- Figure 32: Europe Retail Analytics Market Revenue (Million), by Mode of Deployment 2024 & 2032
- Figure 33: Europe Retail Analytics Market Revenue Share (%), by Mode of Deployment 2024 & 2032
- Figure 34: Europe Retail Analytics Market Revenue (Million), by Type 2024 & 2032
- Figure 35: Europe Retail Analytics Market Revenue Share (%), by Type 2024 & 2032
- Figure 36: Europe Retail Analytics Market Revenue (Million), by Module Type 2024 & 2032
- Figure 37: Europe Retail Analytics Market Revenue Share (%), by Module Type 2024 & 2032
- Figure 38: Europe Retail Analytics Market Revenue (Million), by Business Type 2024 & 2032
- Figure 39: Europe Retail Analytics Market Revenue Share (%), by Business Type 2024 & 2032
- Figure 40: Europe Retail Analytics Market Revenue (Million), by Country 2024 & 2032
- Figure 41: Europe Retail Analytics Market Revenue Share (%), by Country 2024 & 2032
- Figure 42: Middle East & Africa Retail Analytics Market Revenue (Million), by Mode of Deployment 2024 & 2032
- Figure 43: Middle East & Africa Retail Analytics Market Revenue Share (%), by Mode of Deployment 2024 & 2032
- Figure 44: Middle East & Africa Retail Analytics Market Revenue (Million), by Type 2024 & 2032
- Figure 45: Middle East & Africa Retail Analytics Market Revenue Share (%), by Type 2024 & 2032
- Figure 46: Middle East & Africa Retail Analytics Market Revenue (Million), by Module Type 2024 & 2032
- Figure 47: Middle East & Africa Retail Analytics Market Revenue Share (%), by Module Type 2024 & 2032
- Figure 48: Middle East & Africa Retail Analytics Market Revenue (Million), by Business Type 2024 & 2032
- Figure 49: Middle East & Africa Retail Analytics Market Revenue Share (%), by Business Type 2024 & 2032
- Figure 50: Middle East & Africa Retail Analytics Market Revenue (Million), by Country 2024 & 2032
- Figure 51: Middle East & Africa Retail Analytics Market Revenue Share (%), by Country 2024 & 2032
- Figure 52: Asia Pacific Retail Analytics Market Revenue (Million), by Mode of Deployment 2024 & 2032
- Figure 53: Asia Pacific Retail Analytics Market Revenue Share (%), by Mode of Deployment 2024 & 2032
- Figure 54: Asia Pacific Retail Analytics Market Revenue (Million), by Type 2024 & 2032
- Figure 55: Asia Pacific Retail Analytics Market Revenue Share (%), by Type 2024 & 2032
- Figure 56: Asia Pacific Retail Analytics Market Revenue (Million), by Module Type 2024 & 2032
- Figure 57: Asia Pacific Retail Analytics Market Revenue Share (%), by Module Type 2024 & 2032
- Figure 58: Asia Pacific Retail Analytics Market Revenue (Million), by Business Type 2024 & 2032
- Figure 59: Asia Pacific Retail Analytics Market Revenue Share (%), by Business Type 2024 & 2032
- Figure 60: Asia Pacific Retail Analytics Market Revenue (Million), by Country 2024 & 2032
- Figure 61: Asia Pacific Retail Analytics Market Revenue Share (%), by Country 2024 & 2032
List of Tables
- Table 1: Global Retail Analytics Market Revenue Million Forecast, by Region 2019 & 2032
- Table 2: Global Retail Analytics Market Revenue Million Forecast, by Mode of Deployment 2019 & 2032
- Table 3: Global Retail Analytics Market Revenue Million Forecast, by Type 2019 & 2032
- Table 4: Global Retail Analytics Market Revenue Million Forecast, by Module Type 2019 & 2032
- Table 5: Global Retail Analytics Market Revenue Million Forecast, by Business Type 2019 & 2032
- Table 6: Global Retail Analytics Market Revenue Million Forecast, by Region 2019 & 2032
- Table 7: Global Retail Analytics Market Revenue Million Forecast, by Country 2019 & 2032
- Table 8: Retail Analytics Market Revenue (Million) Forecast, by Application 2019 & 2032
- Table 9: Global Retail Analytics Market Revenue Million Forecast, by Country 2019 & 2032
- Table 10: Retail Analytics Market Revenue (Million) Forecast, by Application 2019 & 2032
- Table 11: Global Retail Analytics Market Revenue Million Forecast, by Country 2019 & 2032
- Table 12: Retail Analytics Market Revenue (Million) Forecast, by Application 2019 & 2032
- Table 13: Global Retail Analytics Market Revenue Million Forecast, by Country 2019 & 2032
- Table 14: Retail Analytics Market Revenue (Million) Forecast, by Application 2019 & 2032
- Table 15: Global Retail Analytics Market Revenue Million Forecast, by Country 2019 & 2032
- Table 16: Retail Analytics Market Revenue (Million) Forecast, by Application 2019 & 2032
- Table 17: Global Retail Analytics Market Revenue Million Forecast, by Mode of Deployment 2019 & 2032
- Table 18: Global Retail Analytics Market Revenue Million Forecast, by Type 2019 & 2032
- Table 19: Global Retail Analytics Market Revenue Million Forecast, by Module Type 2019 & 2032
- Table 20: Global Retail Analytics Market Revenue Million Forecast, by Business Type 2019 & 2032
- Table 21: Global Retail Analytics Market Revenue Million Forecast, by Country 2019 & 2032
- Table 22: United States Retail Analytics Market Revenue (Million) Forecast, by Application 2019 & 2032
- Table 23: Canada Retail Analytics Market Revenue (Million) Forecast, by Application 2019 & 2032
- Table 24: Mexico Retail Analytics Market Revenue (Million) Forecast, by Application 2019 & 2032
- Table 25: Global Retail Analytics Market Revenue Million Forecast, by Mode of Deployment 2019 & 2032
- Table 26: Global Retail Analytics Market Revenue Million Forecast, by Type 2019 & 2032
- Table 27: Global Retail Analytics Market Revenue Million Forecast, by Module Type 2019 & 2032
- Table 28: Global Retail Analytics Market Revenue Million Forecast, by Business Type 2019 & 2032
- Table 29: Global Retail Analytics Market Revenue Million Forecast, by Country 2019 & 2032
- Table 30: Brazil Retail Analytics Market Revenue (Million) Forecast, by Application 2019 & 2032
- Table 31: Argentina Retail Analytics Market Revenue (Million) Forecast, by Application 2019 & 2032
- Table 32: Rest of South America Retail Analytics Market Revenue (Million) Forecast, by Application 2019 & 2032
- Table 33: Global Retail Analytics Market Revenue Million Forecast, by Mode of Deployment 2019 & 2032
- Table 34: Global Retail Analytics Market Revenue Million Forecast, by Type 2019 & 2032
- Table 35: Global Retail Analytics Market Revenue Million Forecast, by Module Type 2019 & 2032
- Table 36: Global Retail Analytics Market Revenue Million Forecast, by Business Type 2019 & 2032
- Table 37: Global Retail Analytics Market Revenue Million Forecast, by Country 2019 & 2032
- Table 38: United Kingdom Retail Analytics Market Revenue (Million) Forecast, by Application 2019 & 2032
- Table 39: Germany Retail Analytics Market Revenue (Million) Forecast, by Application 2019 & 2032
- Table 40: France Retail Analytics Market Revenue (Million) Forecast, by Application 2019 & 2032
- Table 41: Italy Retail Analytics Market Revenue (Million) Forecast, by Application 2019 & 2032
- Table 42: Spain Retail Analytics Market Revenue (Million) Forecast, by Application 2019 & 2032
- Table 43: Russia Retail Analytics Market Revenue (Million) Forecast, by Application 2019 & 2032
- Table 44: Benelux Retail Analytics Market Revenue (Million) Forecast, by Application 2019 & 2032
- Table 45: Nordics Retail Analytics Market Revenue (Million) Forecast, by Application 2019 & 2032
- Table 46: Rest of Europe Retail Analytics Market Revenue (Million) Forecast, by Application 2019 & 2032
- Table 47: Global Retail Analytics Market Revenue Million Forecast, by Mode of Deployment 2019 & 2032
- Table 48: Global Retail Analytics Market Revenue Million Forecast, by Type 2019 & 2032
- Table 49: Global Retail Analytics Market Revenue Million Forecast, by Module Type 2019 & 2032
- Table 50: Global Retail Analytics Market Revenue Million Forecast, by Business Type 2019 & 2032
- Table 51: Global Retail Analytics Market Revenue Million Forecast, by Country 2019 & 2032
- Table 52: Turkey Retail Analytics Market Revenue (Million) Forecast, by Application 2019 & 2032
- Table 53: Israel Retail Analytics Market Revenue (Million) Forecast, by Application 2019 & 2032
- Table 54: GCC Retail Analytics Market Revenue (Million) Forecast, by Application 2019 & 2032
- Table 55: North Africa Retail Analytics Market Revenue (Million) Forecast, by Application 2019 & 2032
- Table 56: South Africa Retail Analytics Market Revenue (Million) Forecast, by Application 2019 & 2032
- Table 57: Rest of Middle East & Africa Retail Analytics Market Revenue (Million) Forecast, by Application 2019 & 2032
- Table 58: Global Retail Analytics Market Revenue Million Forecast, by Mode of Deployment 2019 & 2032
- Table 59: Global Retail Analytics Market Revenue Million Forecast, by Type 2019 & 2032
- Table 60: Global Retail Analytics Market Revenue Million Forecast, by Module Type 2019 & 2032
- Table 61: Global Retail Analytics Market Revenue Million Forecast, by Business Type 2019 & 2032
- Table 62: Global Retail Analytics Market Revenue Million Forecast, by Country 2019 & 2032
- Table 63: China Retail Analytics Market Revenue (Million) Forecast, by Application 2019 & 2032
- Table 64: India Retail Analytics Market Revenue (Million) Forecast, by Application 2019 & 2032
- Table 65: Japan Retail Analytics Market Revenue (Million) Forecast, by Application 2019 & 2032
- Table 66: South Korea Retail Analytics Market Revenue (Million) Forecast, by Application 2019 & 2032
- Table 67: ASEAN Retail Analytics Market Revenue (Million) Forecast, by Application 2019 & 2032
- Table 68: Oceania Retail Analytics Market Revenue (Million) Forecast, by Application 2019 & 2032
- Table 69: Rest of Asia Pacific Retail Analytics Market Revenue (Million) Forecast, by Application 2019 & 2032
Frequently Asked Questions
1. What is the projected Compound Annual Growth Rate (CAGR) of the Retail Analytics Market?
The projected CAGR is approximately 20.76%.
2. Which companies are prominent players in the Retail Analytics Market?
Key companies in the market include Qlik Technologies Inc, Fuzzy Logi, Targit, IBM Corporation, Retail Next Inc, Adobe Systems Incorporated, Pentaho Corporation, Microstrategy Inc, Zoho Corporation, Tableau Software Inc, Alteryx Inc, Oracle Corporation, ZAP Business Intelligence, SAP SE, Prevedere Software Inc.
3. What are the main segments of the Retail Analytics Market?
The market segments include Mode of Deployment, Type, Module Type, Business Type.
4. Can you provide details about the market size?
The market size is estimated to be USD XX Million as of 2022.
5. What are some drivers contributing to market growth?
Increased Emphasis on Predictive Analysis; Sustained Increase in Volume of Data; Growing Demand for Sales Forecasting.
6. What are the notable trends driving market growth?
Cloud Segment is One of the Factors Driving the Market.
7. Are there any restraints impacting market growth?
Lack of General Awareness and Expertise in Emerging Regions; Standardization and Integration Issues.
8. Can you provide examples of recent developments in the market?
January 2022: dunnhumby, the global player in Customer Data Science, announced a new strategic relationship with SAP, the industry leader in business application software, that will assist retailers in integrating sophisticated customer insights into their marketing and merchandising programs. The collaboration will enable businesses to make faster, customer-driven decisions and provide a more personalized shopping experience in-store and at home.
9. What pricing options are available for accessing the report?
Pricing options include single-user, multi-user, and enterprise licenses priced at USD 3800, USD 4500, and USD 5800 respectively.
10. Is the market size provided in terms of value or volume?
The market size is provided in terms of value, measured in Million.
11. Are there any specific market keywords associated with the report?
Yes, the market keyword associated with the report is "Retail Analytics Market," which aids in identifying and referencing the specific market segment covered.
12. How do I determine which pricing option suits my needs best?
The pricing options vary based on user requirements and access needs. Individual users may opt for single-user licenses, while businesses requiring broader access may choose multi-user or enterprise licenses for cost-effective access to the report.
13. Are there any additional resources or data provided in the Retail Analytics Market report?
While the report offers comprehensive insights, it's advisable to review the specific contents or supplementary materials provided to ascertain if additional resources or data are available.
14. How can I stay updated on further developments or reports in the Retail Analytics Market?
To stay informed about further developments, trends, and reports in the Retail Analytics Market, consider subscribing to industry newsletters, following relevant companies and organizations, or regularly checking reputable industry news sources and publications.
Methodology
Step 1 - Identification of Relevant Samples Size from Population Database


Step 2 - Approaches for Defining Global Market Size (Value, Volume* & Price*)

Note*: In applicable scenarios
Step 3 - Data Sources
Primary Research
- Web Analytics
- Survey Reports
- Research Institute
- Latest Research Reports
- Opinion Leaders
Secondary Research
- Annual Reports
- White Paper
- Latest Press Release
- Industry Association
- Paid Database
- Investor Presentations

Step 4 - Data Triangulation
Involves using different sources of information in order to increase the validity of a study
These sources are likely to be stakeholders in a program - participants, other researchers, program staff, other community members, and so on.
Then we put all data in single framework & apply various statistical tools to find out the dynamic on the market.
During the analysis stage, feedback from the stakeholder groups would be compared to determine areas of agreement as well as areas of divergence
