

Key Insights
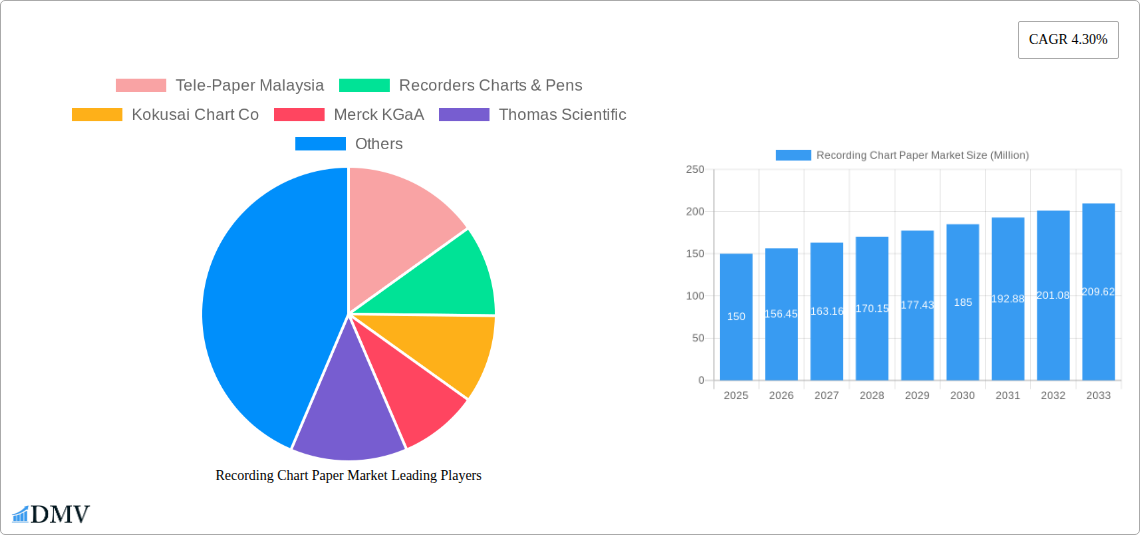
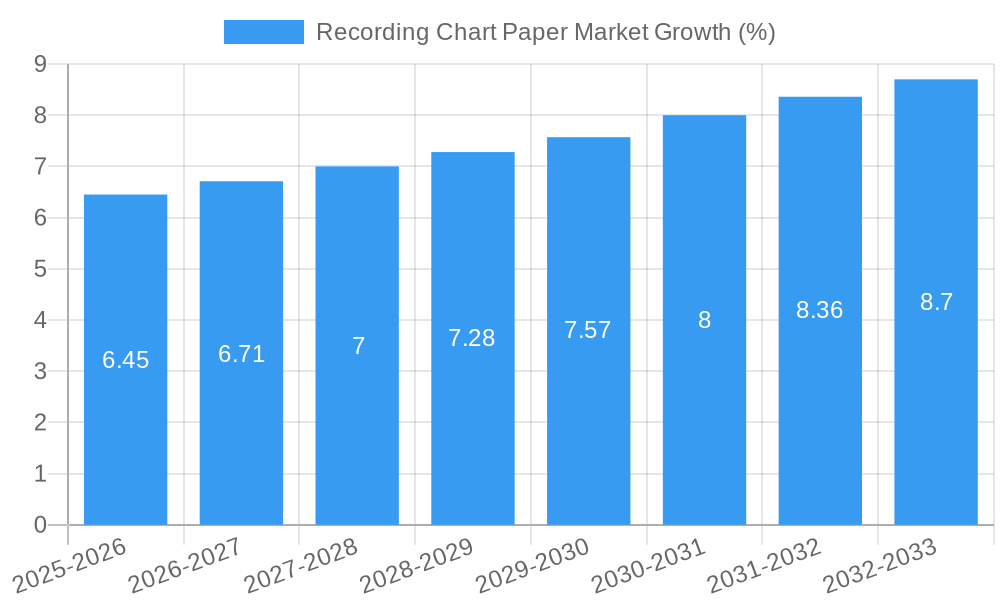
The global Recording Chart Paper Market, valued at approximately $150 million in 2025, is projected to experience steady growth, exhibiting a Compound Annual Growth Rate (CAGR) of 4.30% from 2025 to 2033. This growth is fueled by several key drivers. The increasing prevalence of chronic diseases necessitating regular monitoring in hospitals and diagnostic centers significantly boosts demand. Advancements in medical technology, while introducing digital alternatives, still maintain a considerable reliance on physical chart papers for certain applications, particularly in less technologically advanced regions. The rising global population and an aging demographic further contribute to increased healthcare needs and, consequently, higher chart paper consumption. However, the market faces constraints such as the growing adoption of electronic health record (EHR) systems and the increasing cost of raw materials used in chart paper production. Furthermore, stringent regulatory compliance requirements and environmental concerns related to paper production present challenges for market expansion.
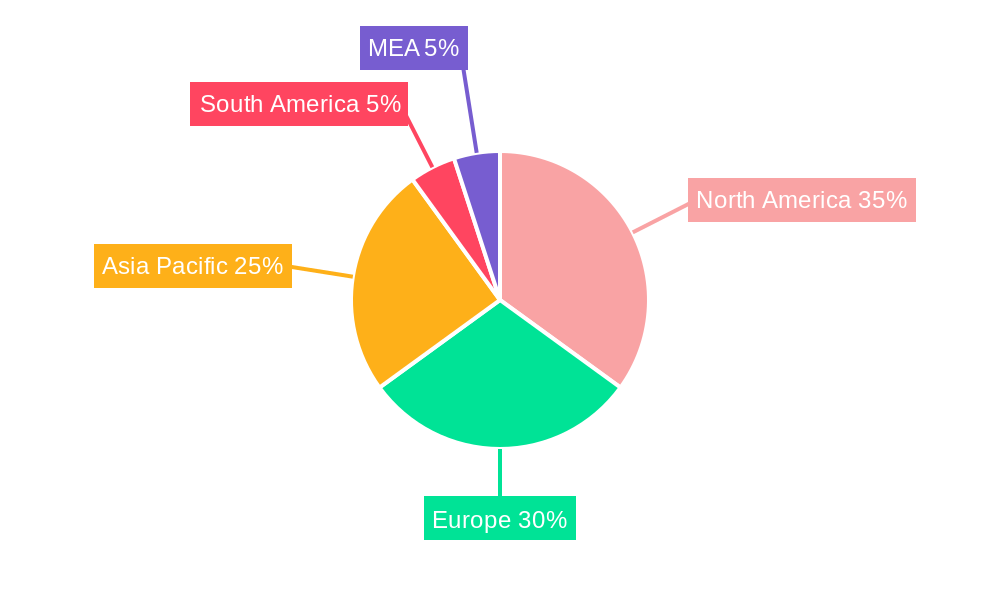
Segment analysis reveals that Cardiology Monitoring Recording Chart Papers hold a dominant market share, followed by Fetal Monitoring and OBGYN Recording Chart Papers. Hospitals constitute the largest end-user segment, reflecting their central role in patient monitoring and record-keeping. Geographically, North America and Europe currently hold significant market shares, driven by well-established healthcare infrastructure and higher per capita healthcare spending. However, the Asia-Pacific region is anticipated to witness robust growth in the coming years due to rapid economic development, improving healthcare access, and rising disposable incomes. Competitive landscape analysis indicates the presence of both established players like Merck KGaA and Cardinal Health, and smaller, specialized companies catering to niche segments. The market's future trajectory will be significantly influenced by technological advancements, regulatory landscape changes, and the continued interplay between traditional methods and the adoption of digital health solutions.
Recording Chart Paper Market: A Comprehensive Report (2019-2033)
This insightful report provides a comprehensive analysis of the global Recording Chart Paper Market, offering a detailed overview of market dynamics, trends, and future prospects from 2019 to 2033. The study encompasses detailed segmentation by product type (Cardiology Monitoring Recording Chart Papers, Fetal Monitoring Recording Chart Papers, OBGYN Recording Chart Paper, Other Product Types) and end-user (Hospitals, Diagnostic Centers, Clinics), providing stakeholders with actionable insights for strategic decision-making. The base year for this analysis is 2025, with an estimated market value of xx Million and a forecast period extending to 2033. The historical period covered is 2019-2024. Key players analyzed include Tele-Paper Malaysia, Recorders Charts & Pens, Kokusai Chart Co, Merck KGaA, Thomas Scientific, Precision Charts Inc, Pirrone srl, Cardinal Health, GlobalSpec, and DART TECHNOLOGIES.
Recording Chart Paper Market Composition & Trends
The Recording Chart Paper market, valued at xx Million in 2025, exhibits a moderately concentrated landscape with key players holding significant market share. Market share distribution amongst the top five players is estimated at approximately xx%. Innovation is driven by the need for improved accuracy, durability, and compatibility with advanced medical equipment. The regulatory landscape, particularly concerning medical device standards, plays a crucial role in shaping market dynamics. Substitute products, such as digital recording systems, pose a growing challenge, though chart paper retains its relevance in specific applications. The majority of end-users are hospitals, followed by diagnostic centers and clinics. M&A activity within the past five years has been relatively modest, with recorded deal values totaling approximately xx Million.
- Market Concentration: Moderately concentrated, with top 5 players holding xx% market share.
- Innovation Catalysts: Improved accuracy, durability, and compatibility with advanced medical devices.
- Regulatory Landscape: Stringent medical device standards significantly impact market operations.
- Substitute Products: Digital recording systems are emerging as competitors.
- End-User Profile: Predominantly hospitals, followed by diagnostic centers and clinics.
- M&A Activity (2020-2024): Total deal value approximately xx Million.
Recording Chart Paper Market Industry Evolution
The Recording Chart Paper market has witnessed steady growth during the historical period (2019-2024), exhibiting a CAGR of xx%. This growth is largely attributed to the increasing prevalence of chronic diseases requiring continuous monitoring and the rising adoption of advanced medical diagnostic procedures in healthcare facilities. Technological advancements focusing on enhanced paper quality, improved printing clarity, and optimized chart formats have further propelled market expansion. However, the growing adoption of digital recording systems is expected to slightly moderate the growth rate during the forecast period (2025-2033). The market is also influenced by shifting consumer demands toward more user-friendly and efficient recording solutions. This includes a preference for chart papers that are more easily integrated into existing electronic health record systems. We predict a CAGR of xx% for the forecast period.
Leading Regions, Countries, or Segments in Recording Chart Paper Market
The North American region currently holds the largest market share in the recording chart paper market, driven by high healthcare expenditure and a large number of hospitals and diagnostic centers. Within product types, Cardiology Monitoring Recording Chart Papers currently holds the largest segment share due to the widespread use of ECG and other cardiac monitoring systems.
- Key Drivers for North American Dominance:
- High healthcare expenditure.
- Large number of hospitals and diagnostic centers.
- Strong regulatory support for medical device innovation.
- Key Drivers for Cardiology Monitoring Segment Dominance:
- Widespread use of ECG and other cardiac monitoring systems.
- Growing prevalence of cardiovascular diseases.
- Technological advancements in cardiac monitoring equipment.
Hospitals represent the largest end-user segment, owing to the high volume of patient monitoring and record-keeping. The European market is expected to witness significant growth in the forecast period due to increasing adoption of advanced medical technologies and expanding healthcare infrastructure. Developing economies are projected to display strong growth potential, driven by increasing healthcare awareness and improving healthcare infrastructure.
Recording Chart Paper Market Product Innovations
Recent innovations have focused on enhancing paper quality for improved clarity and durability, incorporating features like water resistance and improved ink compatibility. New chart formats and sizes are being introduced to meet the evolving needs of different medical specialties and equipment. Key advancements include specialized coatings that minimize smudging and bleeding, ensuring accurate and reliable data recording. This is complemented by improved printing technologies enabling higher resolution and sharper images for enhanced readability.
Propelling Factors for Recording Chart Paper Market Growth
The growth of the Recording Chart Paper market is propelled by several factors: the increasing prevalence of chronic diseases requiring continuous monitoring, rising healthcare expenditure globally, and the expansion of healthcare infrastructure in developing countries. Technological advancements in chart paper manufacturing, leading to improved quality and functionality, are also significant drivers. Favorable regulatory environments supporting medical device innovation further contribute to market growth.
Obstacles in the Recording Chart Paper Market
The market faces challenges from the increasing adoption of digital recording systems, which offer greater efficiency and data management capabilities. Fluctuations in raw material prices, supply chain disruptions, and intense competition from established and emerging players are additional obstacles. Stringent regulatory requirements and compliance costs also pose challenges for market participants. These factors collectively impact profitability and market expansion.
Future Opportunities in Recording Chart Paper Market
Future opportunities lie in the development of specialized chart papers tailored to specific medical applications. Expansion into emerging markets with growing healthcare infrastructure presents significant potential. Furthermore, exploring eco-friendly and sustainable manufacturing processes can create a competitive advantage. Integrating digital functionalities into chart paper, such as barcodes or RFID tags, for improved data tracking, is another promising avenue for growth.
Major Players in the Recording Chart Paper Market Ecosystem
- Tele-Paper Malaysia
- Recorders Charts & Pens
- Kokusai Chart Co
- Merck KGaA
- Thomas Scientific
- Precision Charts Inc
- Pirrone srl
- Cardinal Health
- GlobalSpec
- DART TECHNOLOGIES
Key Developments in Recording Chart Paper Market Industry
- January 2023: Merck KGaA launched a new line of high-resolution chart papers.
- October 2022: Tele-Paper Malaysia invested in a new manufacturing facility.
- July 2021: A merger between two smaller chart paper manufacturers resulted in a more consolidated market share. (Specific details unavailable - xx).
Strategic Recording Chart Paper Market Forecast
The Recording Chart Paper market is poised for continued growth, driven by persistent demand from healthcare providers. While digital alternatives present challenges, the need for reliable, cost-effective, and readily available recording solutions ensures the continued relevance of chart paper in certain segments. Opportunities for innovation, particularly in specialized applications and sustainable manufacturing, will shape the market's future trajectory. The market is expected to reach a value of xx Million by 2033.
Recording Chart Paper Market Segmentation
-
1. Product Type
- 1.1. Cardiology Monitoring Recording Chart Papers
- 1.2. Fetal Monitoring Recording Chart Papers
- 1.3. OBGYN Recording Chart Paper
- 1.4. Other Product Types
-
2. End User
- 2.1. Hospitals
- 2.2. Diagnostic Centers
- 2.3. Clinics
Recording Chart Paper Market Segmentation By Geography
-
1. North America
- 1.1. United States
- 1.2. Canada
- 1.3. Mexico
-
2. Europe
- 2.1. Germany
- 2.2. United Kingdom
- 2.3. France
- 2.4. Italy
- 2.5. Spain
- 2.6. Rest of Europe
-
3. Asia Pacific
- 3.1. China
- 3.2. Japan
- 3.3. India
- 3.4. Australia
- 3.5. South Korea
- 3.6. Rest of Asia Pacific
- 4. Middle East
-
5. GCC
- 5.1. South Africa
- 5.2. Rest of Middle East
-
6. South America
- 6.1. Brazil
- 6.2. Argentina
- 6.3. Rest of South America
Recording Chart Paper Market REPORT HIGHLIGHTS
| Aspects | Details |
|---|---|
| Study Period | 2019-2033 |
| Base Year | 2024 |
| Estimated Year | 2025 |
| Forecast Period | 2025-2033 |
| Historical Period | 2019-2024 |
| Growth Rate | CAGR of 4.30% from 2019-2033 |
| Segmentation |
|
Table of Contents
- 1. Introduction
- 1.1. Research Scope
- 1.2. Market Segmentation
- 1.3. Research Methodology
- 1.4. Definitions and Assumptions
- 2. Executive Summary
- 2.1. Introduction
- 3. Market Dynamics
- 3.1. Introduction
- 3.2. Market Drivers
- 3.2.1. ; Increasing Prevalence of Cardiovascular Diseases; Increasing Geriatric Population and Births
- 3.3. Market Restrains
- 3.3.1. ; Growing Usage of Alternative Digital Instruments
- 3.4. Market Trends
- 3.4.1. Fetal Monitoring Recording Chart Papers Segment is Expected to be the Fastest Growing Segment.
- 4. Market Factor Analysis
- 4.1. Porters Five Forces
- 4.2. Supply/Value Chain
- 4.3. PESTEL analysis
- 4.4. Market Entropy
- 4.5. Patent/Trademark Analysis
- 5. Global Recording Chart Paper Market Analysis, Insights and Forecast, 2019-2031
- 5.1. Market Analysis, Insights and Forecast - by Product Type
- 5.1.1. Cardiology Monitoring Recording Chart Papers
- 5.1.2. Fetal Monitoring Recording Chart Papers
- 5.1.3. OBGYN Recording Chart Paper
- 5.1.4. Other Product Types
- 5.2. Market Analysis, Insights and Forecast - by End User
- 5.2.1. Hospitals
- 5.2.2. Diagnostic Centers
- 5.2.3. Clinics
- 5.3. Market Analysis, Insights and Forecast - by Region
- 5.3.1. North America
- 5.3.2. Europe
- 5.3.3. Asia Pacific
- 5.3.4. Middle East
- 5.3.5. GCC
- 5.3.6. South America
- 5.1. Market Analysis, Insights and Forecast - by Product Type
- 6. North America Recording Chart Paper Market Analysis, Insights and Forecast, 2019-2031
- 6.1. Market Analysis, Insights and Forecast - by Product Type
- 6.1.1. Cardiology Monitoring Recording Chart Papers
- 6.1.2. Fetal Monitoring Recording Chart Papers
- 6.1.3. OBGYN Recording Chart Paper
- 6.1.4. Other Product Types
- 6.2. Market Analysis, Insights and Forecast - by End User
- 6.2.1. Hospitals
- 6.2.2. Diagnostic Centers
- 6.2.3. Clinics
- 6.1. Market Analysis, Insights and Forecast - by Product Type
- 7. Europe Recording Chart Paper Market Analysis, Insights and Forecast, 2019-2031
- 7.1. Market Analysis, Insights and Forecast - by Product Type
- 7.1.1. Cardiology Monitoring Recording Chart Papers
- 7.1.2. Fetal Monitoring Recording Chart Papers
- 7.1.3. OBGYN Recording Chart Paper
- 7.1.4. Other Product Types
- 7.2. Market Analysis, Insights and Forecast - by End User
- 7.2.1. Hospitals
- 7.2.2. Diagnostic Centers
- 7.2.3. Clinics
- 7.1. Market Analysis, Insights and Forecast - by Product Type
- 8. Asia Pacific Recording Chart Paper Market Analysis, Insights and Forecast, 2019-2031
- 8.1. Market Analysis, Insights and Forecast - by Product Type
- 8.1.1. Cardiology Monitoring Recording Chart Papers
- 8.1.2. Fetal Monitoring Recording Chart Papers
- 8.1.3. OBGYN Recording Chart Paper
- 8.1.4. Other Product Types
- 8.2. Market Analysis, Insights and Forecast - by End User
- 8.2.1. Hospitals
- 8.2.2. Diagnostic Centers
- 8.2.3. Clinics
- 8.1. Market Analysis, Insights and Forecast - by Product Type
- 9. Middle East Recording Chart Paper Market Analysis, Insights and Forecast, 2019-2031
- 9.1. Market Analysis, Insights and Forecast - by Product Type
- 9.1.1. Cardiology Monitoring Recording Chart Papers
- 9.1.2. Fetal Monitoring Recording Chart Papers
- 9.1.3. OBGYN Recording Chart Paper
- 9.1.4. Other Product Types
- 9.2. Market Analysis, Insights and Forecast - by End User
- 9.2.1. Hospitals
- 9.2.2. Diagnostic Centers
- 9.2.3. Clinics
- 9.1. Market Analysis, Insights and Forecast - by Product Type
- 10. GCC Recording Chart Paper Market Analysis, Insights and Forecast, 2019-2031
- 10.1. Market Analysis, Insights and Forecast - by Product Type
- 10.1.1. Cardiology Monitoring Recording Chart Papers
- 10.1.2. Fetal Monitoring Recording Chart Papers
- 10.1.3. OBGYN Recording Chart Paper
- 10.1.4. Other Product Types
- 10.2. Market Analysis, Insights and Forecast - by End User
- 10.2.1. Hospitals
- 10.2.2. Diagnostic Centers
- 10.2.3. Clinics
- 10.1. Market Analysis, Insights and Forecast - by Product Type
- 11. South America Recording Chart Paper Market Analysis, Insights and Forecast, 2019-2031
- 11.1. Market Analysis, Insights and Forecast - by Product Type
- 11.1.1. Cardiology Monitoring Recording Chart Papers
- 11.1.2. Fetal Monitoring Recording Chart Papers
- 11.1.3. OBGYN Recording Chart Paper
- 11.1.4. Other Product Types
- 11.2. Market Analysis, Insights and Forecast - by End User
- 11.2.1. Hospitals
- 11.2.2. Diagnostic Centers
- 11.2.3. Clinics
- 11.1. Market Analysis, Insights and Forecast - by Product Type
- 12. North America Recording Chart Paper Market Analysis, Insights and Forecast, 2019-2031
- 12.1. Market Analysis, Insights and Forecast - By Country/Sub-region
- 12.1.1 United States
- 12.1.2 Canada
- 12.1.3 Mexico
- 13. Europe Recording Chart Paper Market Analysis, Insights and Forecast, 2019-2031
- 13.1. Market Analysis, Insights and Forecast - By Country/Sub-region
- 13.1.1 Germany
- 13.1.2 United Kingdom
- 13.1.3 France
- 13.1.4 Italy
- 13.1.5 Spain
- 13.1.6 Rest of Europe
- 14. Asia Pacific Recording Chart Paper Market Analysis, Insights and Forecast, 2019-2031
- 14.1. Market Analysis, Insights and Forecast - By Country/Sub-region
- 14.1.1 China
- 14.1.2 Japan
- 14.1.3 India
- 14.1.4 Australia
- 14.1.5 South Korea
- 14.1.6 Rest of Asia Pacific
- 15. South America Recording Chart Paper Market Analysis, Insights and Forecast, 2019-2031
- 15.1. Market Analysis, Insights and Forecast - By Country/Sub-region
- 15.1.1 Brazil
- 15.1.2 Argentina
- 15.1.3 Rest of South America
- 16. MEA Recording Chart Paper Market Analysis, Insights and Forecast, 2019-2031
- 16.1. Market Analysis, Insights and Forecast - By Country/Sub-region
- 16.1.1 United Arab Emirates
- 16.1.2 Saudi Arabia
- 16.1.3 South Africa
- 16.1.4 Rest of Middle East and Africa
- 17. Competitive Analysis
- 17.1. Global Market Share Analysis 2024
- 17.2. Company Profiles
- 17.2.1 Tele-Paper Malaysia
- 17.2.1.1. Overview
- 17.2.1.2. Products
- 17.2.1.3. SWOT Analysis
- 17.2.1.4. Recent Developments
- 17.2.1.5. Financials (Based on Availability)
- 17.2.2 Recorders Charts & Pens
- 17.2.2.1. Overview
- 17.2.2.2. Products
- 17.2.2.3. SWOT Analysis
- 17.2.2.4. Recent Developments
- 17.2.2.5. Financials (Based on Availability)
- 17.2.3 Kokusai Chart Co
- 17.2.3.1. Overview
- 17.2.3.2. Products
- 17.2.3.3. SWOT Analysis
- 17.2.3.4. Recent Developments
- 17.2.3.5. Financials (Based on Availability)
- 17.2.4 Merck KGaA
- 17.2.4.1. Overview
- 17.2.4.2. Products
- 17.2.4.3. SWOT Analysis
- 17.2.4.4. Recent Developments
- 17.2.4.5. Financials (Based on Availability)
- 17.2.5 Thomas Scientific
- 17.2.5.1. Overview
- 17.2.5.2. Products
- 17.2.5.3. SWOT Analysis
- 17.2.5.4. Recent Developments
- 17.2.5.5. Financials (Based on Availability)
- 17.2.6 Precision Charts Inc
- 17.2.6.1. Overview
- 17.2.6.2. Products
- 17.2.6.3. SWOT Analysis
- 17.2.6.4. Recent Developments
- 17.2.6.5. Financials (Based on Availability)
- 17.2.7 Pirrone srl
- 17.2.7.1. Overview
- 17.2.7.2. Products
- 17.2.7.3. SWOT Analysis
- 17.2.7.4. Recent Developments
- 17.2.7.5. Financials (Based on Availability)
- 17.2.8 Cardinal Health
- 17.2.8.1. Overview
- 17.2.8.2. Products
- 17.2.8.3. SWOT Analysis
- 17.2.8.4. Recent Developments
- 17.2.8.5. Financials (Based on Availability)
- 17.2.9 GlobalSpec
- 17.2.9.1. Overview
- 17.2.9.2. Products
- 17.2.9.3. SWOT Analysis
- 17.2.9.4. Recent Developments
- 17.2.9.5. Financials (Based on Availability)
- 17.2.10 DART TECHNOLOGIES
- 17.2.10.1. Overview
- 17.2.10.2. Products
- 17.2.10.3. SWOT Analysis
- 17.2.10.4. Recent Developments
- 17.2.10.5. Financials (Based on Availability)
- 17.2.1 Tele-Paper Malaysia
List of Figures
- Figure 1: Global Recording Chart Paper Market Revenue Breakdown (Million, %) by Region 2024 & 2032
- Figure 2: Global Recording Chart Paper Market Volume Breakdown (Units, %) by Region 2024 & 2032
- Figure 3: North America Recording Chart Paper Market Revenue (Million), by Country 2024 & 2032
- Figure 4: North America Recording Chart Paper Market Volume (Units), by Country 2024 & 2032
- Figure 5: North America Recording Chart Paper Market Revenue Share (%), by Country 2024 & 2032
- Figure 6: North America Recording Chart Paper Market Volume Share (%), by Country 2024 & 2032
- Figure 7: Europe Recording Chart Paper Market Revenue (Million), by Country 2024 & 2032
- Figure 8: Europe Recording Chart Paper Market Volume (Units), by Country 2024 & 2032
- Figure 9: Europe Recording Chart Paper Market Revenue Share (%), by Country 2024 & 2032
- Figure 10: Europe Recording Chart Paper Market Volume Share (%), by Country 2024 & 2032
- Figure 11: Asia Pacific Recording Chart Paper Market Revenue (Million), by Country 2024 & 2032
- Figure 12: Asia Pacific Recording Chart Paper Market Volume (Units), by Country 2024 & 2032
- Figure 13: Asia Pacific Recording Chart Paper Market Revenue Share (%), by Country 2024 & 2032
- Figure 14: Asia Pacific Recording Chart Paper Market Volume Share (%), by Country 2024 & 2032
- Figure 15: South America Recording Chart Paper Market Revenue (Million), by Country 2024 & 2032
- Figure 16: South America Recording Chart Paper Market Volume (Units), by Country 2024 & 2032
- Figure 17: South America Recording Chart Paper Market Revenue Share (%), by Country 2024 & 2032
- Figure 18: South America Recording Chart Paper Market Volume Share (%), by Country 2024 & 2032
- Figure 19: MEA Recording Chart Paper Market Revenue (Million), by Country 2024 & 2032
- Figure 20: MEA Recording Chart Paper Market Volume (Units), by Country 2024 & 2032
- Figure 21: MEA Recording Chart Paper Market Revenue Share (%), by Country 2024 & 2032
- Figure 22: MEA Recording Chart Paper Market Volume Share (%), by Country 2024 & 2032
- Figure 23: North America Recording Chart Paper Market Revenue (Million), by Product Type 2024 & 2032
- Figure 24: North America Recording Chart Paper Market Volume (Units), by Product Type 2024 & 2032
- Figure 25: North America Recording Chart Paper Market Revenue Share (%), by Product Type 2024 & 2032
- Figure 26: North America Recording Chart Paper Market Volume Share (%), by Product Type 2024 & 2032
- Figure 27: North America Recording Chart Paper Market Revenue (Million), by End User 2024 & 2032
- Figure 28: North America Recording Chart Paper Market Volume (Units), by End User 2024 & 2032
- Figure 29: North America Recording Chart Paper Market Revenue Share (%), by End User 2024 & 2032
- Figure 30: North America Recording Chart Paper Market Volume Share (%), by End User 2024 & 2032
- Figure 31: North America Recording Chart Paper Market Revenue (Million), by Country 2024 & 2032
- Figure 32: North America Recording Chart Paper Market Volume (Units), by Country 2024 & 2032
- Figure 33: North America Recording Chart Paper Market Revenue Share (%), by Country 2024 & 2032
- Figure 34: North America Recording Chart Paper Market Volume Share (%), by Country 2024 & 2032
- Figure 35: Europe Recording Chart Paper Market Revenue (Million), by Product Type 2024 & 2032
- Figure 36: Europe Recording Chart Paper Market Volume (Units), by Product Type 2024 & 2032
- Figure 37: Europe Recording Chart Paper Market Revenue Share (%), by Product Type 2024 & 2032
- Figure 38: Europe Recording Chart Paper Market Volume Share (%), by Product Type 2024 & 2032
- Figure 39: Europe Recording Chart Paper Market Revenue (Million), by End User 2024 & 2032
- Figure 40: Europe Recording Chart Paper Market Volume (Units), by End User 2024 & 2032
- Figure 41: Europe Recording Chart Paper Market Revenue Share (%), by End User 2024 & 2032
- Figure 42: Europe Recording Chart Paper Market Volume Share (%), by End User 2024 & 2032
- Figure 43: Europe Recording Chart Paper Market Revenue (Million), by Country 2024 & 2032
- Figure 44: Europe Recording Chart Paper Market Volume (Units), by Country 2024 & 2032
- Figure 45: Europe Recording Chart Paper Market Revenue Share (%), by Country 2024 & 2032
- Figure 46: Europe Recording Chart Paper Market Volume Share (%), by Country 2024 & 2032
- Figure 47: Asia Pacific Recording Chart Paper Market Revenue (Million), by Product Type 2024 & 2032
- Figure 48: Asia Pacific Recording Chart Paper Market Volume (Units), by Product Type 2024 & 2032
- Figure 49: Asia Pacific Recording Chart Paper Market Revenue Share (%), by Product Type 2024 & 2032
- Figure 50: Asia Pacific Recording Chart Paper Market Volume Share (%), by Product Type 2024 & 2032
- Figure 51: Asia Pacific Recording Chart Paper Market Revenue (Million), by End User 2024 & 2032
- Figure 52: Asia Pacific Recording Chart Paper Market Volume (Units), by End User 2024 & 2032
- Figure 53: Asia Pacific Recording Chart Paper Market Revenue Share (%), by End User 2024 & 2032
- Figure 54: Asia Pacific Recording Chart Paper Market Volume Share (%), by End User 2024 & 2032
- Figure 55: Asia Pacific Recording Chart Paper Market Revenue (Million), by Country 2024 & 2032
- Figure 56: Asia Pacific Recording Chart Paper Market Volume (Units), by Country 2024 & 2032
- Figure 57: Asia Pacific Recording Chart Paper Market Revenue Share (%), by Country 2024 & 2032
- Figure 58: Asia Pacific Recording Chart Paper Market Volume Share (%), by Country 2024 & 2032
- Figure 59: Middle East Recording Chart Paper Market Revenue (Million), by Product Type 2024 & 2032
- Figure 60: Middle East Recording Chart Paper Market Volume (Units), by Product Type 2024 & 2032
- Figure 61: Middle East Recording Chart Paper Market Revenue Share (%), by Product Type 2024 & 2032
- Figure 62: Middle East Recording Chart Paper Market Volume Share (%), by Product Type 2024 & 2032
- Figure 63: Middle East Recording Chart Paper Market Revenue (Million), by End User 2024 & 2032
- Figure 64: Middle East Recording Chart Paper Market Volume (Units), by End User 2024 & 2032
- Figure 65: Middle East Recording Chart Paper Market Revenue Share (%), by End User 2024 & 2032
- Figure 66: Middle East Recording Chart Paper Market Volume Share (%), by End User 2024 & 2032
- Figure 67: Middle East Recording Chart Paper Market Revenue (Million), by Country 2024 & 2032
- Figure 68: Middle East Recording Chart Paper Market Volume (Units), by Country 2024 & 2032
- Figure 69: Middle East Recording Chart Paper Market Revenue Share (%), by Country 2024 & 2032
- Figure 70: Middle East Recording Chart Paper Market Volume Share (%), by Country 2024 & 2032
- Figure 71: GCC Recording Chart Paper Market Revenue (Million), by Product Type 2024 & 2032
- Figure 72: GCC Recording Chart Paper Market Volume (Units), by Product Type 2024 & 2032
- Figure 73: GCC Recording Chart Paper Market Revenue Share (%), by Product Type 2024 & 2032
- Figure 74: GCC Recording Chart Paper Market Volume Share (%), by Product Type 2024 & 2032
- Figure 75: GCC Recording Chart Paper Market Revenue (Million), by End User 2024 & 2032
- Figure 76: GCC Recording Chart Paper Market Volume (Units), by End User 2024 & 2032
- Figure 77: GCC Recording Chart Paper Market Revenue Share (%), by End User 2024 & 2032
- Figure 78: GCC Recording Chart Paper Market Volume Share (%), by End User 2024 & 2032
- Figure 79: GCC Recording Chart Paper Market Revenue (Million), by Country 2024 & 2032
- Figure 80: GCC Recording Chart Paper Market Volume (Units), by Country 2024 & 2032
- Figure 81: GCC Recording Chart Paper Market Revenue Share (%), by Country 2024 & 2032
- Figure 82: GCC Recording Chart Paper Market Volume Share (%), by Country 2024 & 2032
- Figure 83: South America Recording Chart Paper Market Revenue (Million), by Product Type 2024 & 2032
- Figure 84: South America Recording Chart Paper Market Volume (Units), by Product Type 2024 & 2032
- Figure 85: South America Recording Chart Paper Market Revenue Share (%), by Product Type 2024 & 2032
- Figure 86: South America Recording Chart Paper Market Volume Share (%), by Product Type 2024 & 2032
- Figure 87: South America Recording Chart Paper Market Revenue (Million), by End User 2024 & 2032
- Figure 88: South America Recording Chart Paper Market Volume (Units), by End User 2024 & 2032
- Figure 89: South America Recording Chart Paper Market Revenue Share (%), by End User 2024 & 2032
- Figure 90: South America Recording Chart Paper Market Volume Share (%), by End User 2024 & 2032
- Figure 91: South America Recording Chart Paper Market Revenue (Million), by Country 2024 & 2032
- Figure 92: South America Recording Chart Paper Market Volume (Units), by Country 2024 & 2032
- Figure 93: South America Recording Chart Paper Market Revenue Share (%), by Country 2024 & 2032
- Figure 94: South America Recording Chart Paper Market Volume Share (%), by Country 2024 & 2032
List of Tables
- Table 1: Global Recording Chart Paper Market Revenue Million Forecast, by Region 2019 & 2032
- Table 2: Global Recording Chart Paper Market Volume Units Forecast, by Region 2019 & 2032
- Table 3: Global Recording Chart Paper Market Revenue Million Forecast, by Product Type 2019 & 2032
- Table 4: Global Recording Chart Paper Market Volume Units Forecast, by Product Type 2019 & 2032
- Table 5: Global Recording Chart Paper Market Revenue Million Forecast, by End User 2019 & 2032
- Table 6: Global Recording Chart Paper Market Volume Units Forecast, by End User 2019 & 2032
- Table 7: Global Recording Chart Paper Market Revenue Million Forecast, by Region 2019 & 2032
- Table 8: Global Recording Chart Paper Market Volume Units Forecast, by Region 2019 & 2032
- Table 9: Global Recording Chart Paper Market Revenue Million Forecast, by Country 2019 & 2032
- Table 10: Global Recording Chart Paper Market Volume Units Forecast, by Country 2019 & 2032
- Table 11: United States Recording Chart Paper Market Revenue (Million) Forecast, by Application 2019 & 2032
- Table 12: United States Recording Chart Paper Market Volume (Units) Forecast, by Application 2019 & 2032
- Table 13: Canada Recording Chart Paper Market Revenue (Million) Forecast, by Application 2019 & 2032
- Table 14: Canada Recording Chart Paper Market Volume (Units) Forecast, by Application 2019 & 2032
- Table 15: Mexico Recording Chart Paper Market Revenue (Million) Forecast, by Application 2019 & 2032
- Table 16: Mexico Recording Chart Paper Market Volume (Units) Forecast, by Application 2019 & 2032
- Table 17: Global Recording Chart Paper Market Revenue Million Forecast, by Country 2019 & 2032
- Table 18: Global Recording Chart Paper Market Volume Units Forecast, by Country 2019 & 2032
- Table 19: Germany Recording Chart Paper Market Revenue (Million) Forecast, by Application 2019 & 2032
- Table 20: Germany Recording Chart Paper Market Volume (Units) Forecast, by Application 2019 & 2032
- Table 21: United Kingdom Recording Chart Paper Market Revenue (Million) Forecast, by Application 2019 & 2032
- Table 22: United Kingdom Recording Chart Paper Market Volume (Units) Forecast, by Application 2019 & 2032
- Table 23: France Recording Chart Paper Market Revenue (Million) Forecast, by Application 2019 & 2032
- Table 24: France Recording Chart Paper Market Volume (Units) Forecast, by Application 2019 & 2032
- Table 25: Italy Recording Chart Paper Market Revenue (Million) Forecast, by Application 2019 & 2032
- Table 26: Italy Recording Chart Paper Market Volume (Units) Forecast, by Application 2019 & 2032
- Table 27: Spain Recording Chart Paper Market Revenue (Million) Forecast, by Application 2019 & 2032
- Table 28: Spain Recording Chart Paper Market Volume (Units) Forecast, by Application 2019 & 2032
- Table 29: Rest of Europe Recording Chart Paper Market Revenue (Million) Forecast, by Application 2019 & 2032
- Table 30: Rest of Europe Recording Chart Paper Market Volume (Units) Forecast, by Application 2019 & 2032
- Table 31: Global Recording Chart Paper Market Revenue Million Forecast, by Country 2019 & 2032
- Table 32: Global Recording Chart Paper Market Volume Units Forecast, by Country 2019 & 2032
- Table 33: China Recording Chart Paper Market Revenue (Million) Forecast, by Application 2019 & 2032
- Table 34: China Recording Chart Paper Market Volume (Units) Forecast, by Application 2019 & 2032
- Table 35: Japan Recording Chart Paper Market Revenue (Million) Forecast, by Application 2019 & 2032
- Table 36: Japan Recording Chart Paper Market Volume (Units) Forecast, by Application 2019 & 2032
- Table 37: India Recording Chart Paper Market Revenue (Million) Forecast, by Application 2019 & 2032
- Table 38: India Recording Chart Paper Market Volume (Units) Forecast, by Application 2019 & 2032
- Table 39: Australia Recording Chart Paper Market Revenue (Million) Forecast, by Application 2019 & 2032
- Table 40: Australia Recording Chart Paper Market Volume (Units) Forecast, by Application 2019 & 2032
- Table 41: South Korea Recording Chart Paper Market Revenue (Million) Forecast, by Application 2019 & 2032
- Table 42: South Korea Recording Chart Paper Market Volume (Units) Forecast, by Application 2019 & 2032
- Table 43: Rest of Asia Pacific Recording Chart Paper Market Revenue (Million) Forecast, by Application 2019 & 2032
- Table 44: Rest of Asia Pacific Recording Chart Paper Market Volume (Units) Forecast, by Application 2019 & 2032
- Table 45: Global Recording Chart Paper Market Revenue Million Forecast, by Country 2019 & 2032
- Table 46: Global Recording Chart Paper Market Volume Units Forecast, by Country 2019 & 2032
- Table 47: Brazil Recording Chart Paper Market Revenue (Million) Forecast, by Application 2019 & 2032
- Table 48: Brazil Recording Chart Paper Market Volume (Units) Forecast, by Application 2019 & 2032
- Table 49: Argentina Recording Chart Paper Market Revenue (Million) Forecast, by Application 2019 & 2032
- Table 50: Argentina Recording Chart Paper Market Volume (Units) Forecast, by Application 2019 & 2032
- Table 51: Rest of South America Recording Chart Paper Market Revenue (Million) Forecast, by Application 2019 & 2032
- Table 52: Rest of South America Recording Chart Paper Market Volume (Units) Forecast, by Application 2019 & 2032
- Table 53: Global Recording Chart Paper Market Revenue Million Forecast, by Country 2019 & 2032
- Table 54: Global Recording Chart Paper Market Volume Units Forecast, by Country 2019 & 2032
- Table 55: United Arab Emirates Recording Chart Paper Market Revenue (Million) Forecast, by Application 2019 & 2032
- Table 56: United Arab Emirates Recording Chart Paper Market Volume (Units) Forecast, by Application 2019 & 2032
- Table 57: Saudi Arabia Recording Chart Paper Market Revenue (Million) Forecast, by Application 2019 & 2032
- Table 58: Saudi Arabia Recording Chart Paper Market Volume (Units) Forecast, by Application 2019 & 2032
- Table 59: South Africa Recording Chart Paper Market Revenue (Million) Forecast, by Application 2019 & 2032
- Table 60: South Africa Recording Chart Paper Market Volume (Units) Forecast, by Application 2019 & 2032
- Table 61: Rest of Middle East and Africa Recording Chart Paper Market Revenue (Million) Forecast, by Application 2019 & 2032
- Table 62: Rest of Middle East and Africa Recording Chart Paper Market Volume (Units) Forecast, by Application 2019 & 2032
- Table 63: Global Recording Chart Paper Market Revenue Million Forecast, by Product Type 2019 & 2032
- Table 64: Global Recording Chart Paper Market Volume Units Forecast, by Product Type 2019 & 2032
- Table 65: Global Recording Chart Paper Market Revenue Million Forecast, by End User 2019 & 2032
- Table 66: Global Recording Chart Paper Market Volume Units Forecast, by End User 2019 & 2032
- Table 67: Global Recording Chart Paper Market Revenue Million Forecast, by Country 2019 & 2032
- Table 68: Global Recording Chart Paper Market Volume Units Forecast, by Country 2019 & 2032
- Table 69: United States Recording Chart Paper Market Revenue (Million) Forecast, by Application 2019 & 2032
- Table 70: United States Recording Chart Paper Market Volume (Units) Forecast, by Application 2019 & 2032
- Table 71: Canada Recording Chart Paper Market Revenue (Million) Forecast, by Application 2019 & 2032
- Table 72: Canada Recording Chart Paper Market Volume (Units) Forecast, by Application 2019 & 2032
- Table 73: Mexico Recording Chart Paper Market Revenue (Million) Forecast, by Application 2019 & 2032
- Table 74: Mexico Recording Chart Paper Market Volume (Units) Forecast, by Application 2019 & 2032
- Table 75: Global Recording Chart Paper Market Revenue Million Forecast, by Product Type 2019 & 2032
- Table 76: Global Recording Chart Paper Market Volume Units Forecast, by Product Type 2019 & 2032
- Table 77: Global Recording Chart Paper Market Revenue Million Forecast, by End User 2019 & 2032
- Table 78: Global Recording Chart Paper Market Volume Units Forecast, by End User 2019 & 2032
- Table 79: Global Recording Chart Paper Market Revenue Million Forecast, by Country 2019 & 2032
- Table 80: Global Recording Chart Paper Market Volume Units Forecast, by Country 2019 & 2032
- Table 81: Germany Recording Chart Paper Market Revenue (Million) Forecast, by Application 2019 & 2032
- Table 82: Germany Recording Chart Paper Market Volume (Units) Forecast, by Application 2019 & 2032
- Table 83: United Kingdom Recording Chart Paper Market Revenue (Million) Forecast, by Application 2019 & 2032
- Table 84: United Kingdom Recording Chart Paper Market Volume (Units) Forecast, by Application 2019 & 2032
- Table 85: France Recording Chart Paper Market Revenue (Million) Forecast, by Application 2019 & 2032
- Table 86: France Recording Chart Paper Market Volume (Units) Forecast, by Application 2019 & 2032
- Table 87: Italy Recording Chart Paper Market Revenue (Million) Forecast, by Application 2019 & 2032
- Table 88: Italy Recording Chart Paper Market Volume (Units) Forecast, by Application 2019 & 2032
- Table 89: Spain Recording Chart Paper Market Revenue (Million) Forecast, by Application 2019 & 2032
- Table 90: Spain Recording Chart Paper Market Volume (Units) Forecast, by Application 2019 & 2032
- Table 91: Rest of Europe Recording Chart Paper Market Revenue (Million) Forecast, by Application 2019 & 2032
- Table 92: Rest of Europe Recording Chart Paper Market Volume (Units) Forecast, by Application 2019 & 2032
- Table 93: Global Recording Chart Paper Market Revenue Million Forecast, by Product Type 2019 & 2032
- Table 94: Global Recording Chart Paper Market Volume Units Forecast, by Product Type 2019 & 2032
- Table 95: Global Recording Chart Paper Market Revenue Million Forecast, by End User 2019 & 2032
- Table 96: Global Recording Chart Paper Market Volume Units Forecast, by End User 2019 & 2032
- Table 97: Global Recording Chart Paper Market Revenue Million Forecast, by Country 2019 & 2032
- Table 98: Global Recording Chart Paper Market Volume Units Forecast, by Country 2019 & 2032
- Table 99: China Recording Chart Paper Market Revenue (Million) Forecast, by Application 2019 & 2032
- Table 100: China Recording Chart Paper Market Volume (Units) Forecast, by Application 2019 & 2032
- Table 101: Japan Recording Chart Paper Market Revenue (Million) Forecast, by Application 2019 & 2032
- Table 102: Japan Recording Chart Paper Market Volume (Units) Forecast, by Application 2019 & 2032
- Table 103: India Recording Chart Paper Market Revenue (Million) Forecast, by Application 2019 & 2032
- Table 104: India Recording Chart Paper Market Volume (Units) Forecast, by Application 2019 & 2032
- Table 105: Australia Recording Chart Paper Market Revenue (Million) Forecast, by Application 2019 & 2032
- Table 106: Australia Recording Chart Paper Market Volume (Units) Forecast, by Application 2019 & 2032
- Table 107: South Korea Recording Chart Paper Market Revenue (Million) Forecast, by Application 2019 & 2032
- Table 108: South Korea Recording Chart Paper Market Volume (Units) Forecast, by Application 2019 & 2032
- Table 109: Rest of Asia Pacific Recording Chart Paper Market Revenue (Million) Forecast, by Application 2019 & 2032
- Table 110: Rest of Asia Pacific Recording Chart Paper Market Volume (Units) Forecast, by Application 2019 & 2032
- Table 111: Global Recording Chart Paper Market Revenue Million Forecast, by Product Type 2019 & 2032
- Table 112: Global Recording Chart Paper Market Volume Units Forecast, by Product Type 2019 & 2032
- Table 113: Global Recording Chart Paper Market Revenue Million Forecast, by End User 2019 & 2032
- Table 114: Global Recording Chart Paper Market Volume Units Forecast, by End User 2019 & 2032
- Table 115: Global Recording Chart Paper Market Revenue Million Forecast, by Country 2019 & 2032
- Table 116: Global Recording Chart Paper Market Volume Units Forecast, by Country 2019 & 2032
- Table 117: Global Recording Chart Paper Market Revenue Million Forecast, by Product Type 2019 & 2032
- Table 118: Global Recording Chart Paper Market Volume Units Forecast, by Product Type 2019 & 2032
- Table 119: Global Recording Chart Paper Market Revenue Million Forecast, by End User 2019 & 2032
- Table 120: Global Recording Chart Paper Market Volume Units Forecast, by End User 2019 & 2032
- Table 121: Global Recording Chart Paper Market Revenue Million Forecast, by Country 2019 & 2032
- Table 122: Global Recording Chart Paper Market Volume Units Forecast, by Country 2019 & 2032
- Table 123: South Africa Recording Chart Paper Market Revenue (Million) Forecast, by Application 2019 & 2032
- Table 124: South Africa Recording Chart Paper Market Volume (Units) Forecast, by Application 2019 & 2032
- Table 125: Rest of Middle East Recording Chart Paper Market Revenue (Million) Forecast, by Application 2019 & 2032
- Table 126: Rest of Middle East Recording Chart Paper Market Volume (Units) Forecast, by Application 2019 & 2032
- Table 127: Global Recording Chart Paper Market Revenue Million Forecast, by Product Type 2019 & 2032
- Table 128: Global Recording Chart Paper Market Volume Units Forecast, by Product Type 2019 & 2032
- Table 129: Global Recording Chart Paper Market Revenue Million Forecast, by End User 2019 & 2032
- Table 130: Global Recording Chart Paper Market Volume Units Forecast, by End User 2019 & 2032
- Table 131: Global Recording Chart Paper Market Revenue Million Forecast, by Country 2019 & 2032
- Table 132: Global Recording Chart Paper Market Volume Units Forecast, by Country 2019 & 2032
- Table 133: Brazil Recording Chart Paper Market Revenue (Million) Forecast, by Application 2019 & 2032
- Table 134: Brazil Recording Chart Paper Market Volume (Units) Forecast, by Application 2019 & 2032
- Table 135: Argentina Recording Chart Paper Market Revenue (Million) Forecast, by Application 2019 & 2032
- Table 136: Argentina Recording Chart Paper Market Volume (Units) Forecast, by Application 2019 & 2032
- Table 137: Rest of South America Recording Chart Paper Market Revenue (Million) Forecast, by Application 2019 & 2032
- Table 138: Rest of South America Recording Chart Paper Market Volume (Units) Forecast, by Application 2019 & 2032
Frequently Asked Questions
1. What is the projected Compound Annual Growth Rate (CAGR) of the Recording Chart Paper Market?
The projected CAGR is approximately 4.30%.
2. Which companies are prominent players in the Recording Chart Paper Market?
Key companies in the market include Tele-Paper Malaysia, Recorders Charts & Pens, Kokusai Chart Co, Merck KGaA, Thomas Scientific, Precision Charts Inc, Pirrone srl, Cardinal Health, GlobalSpec, DART TECHNOLOGIES.
3. What are the main segments of the Recording Chart Paper Market?
The market segments include Product Type, End User.
4. Can you provide details about the market size?
The market size is estimated to be USD XX Million as of 2022.
5. What are some drivers contributing to market growth?
; Increasing Prevalence of Cardiovascular Diseases; Increasing Geriatric Population and Births.
6. What are the notable trends driving market growth?
Fetal Monitoring Recording Chart Papers Segment is Expected to be the Fastest Growing Segment..
7. Are there any restraints impacting market growth?
; Growing Usage of Alternative Digital Instruments.
8. Can you provide examples of recent developments in the market?
N/A
9. What pricing options are available for accessing the report?
Pricing options include single-user, multi-user, and enterprise licenses priced at USD 4750, USD 5250, and USD 8750 respectively.
10. Is the market size provided in terms of value or volume?
The market size is provided in terms of value, measured in Million and volume, measured in Units.
11. Are there any specific market keywords associated with the report?
Yes, the market keyword associated with the report is "Recording Chart Paper Market," which aids in identifying and referencing the specific market segment covered.
12. How do I determine which pricing option suits my needs best?
The pricing options vary based on user requirements and access needs. Individual users may opt for single-user licenses, while businesses requiring broader access may choose multi-user or enterprise licenses for cost-effective access to the report.
13. Are there any additional resources or data provided in the Recording Chart Paper Market report?
While the report offers comprehensive insights, it's advisable to review the specific contents or supplementary materials provided to ascertain if additional resources or data are available.
14. How can I stay updated on further developments or reports in the Recording Chart Paper Market?
To stay informed about further developments, trends, and reports in the Recording Chart Paper Market, consider subscribing to industry newsletters, following relevant companies and organizations, or regularly checking reputable industry news sources and publications.
Methodology
Step 1 - Identification of Relevant Samples Size from Population Database


Step 2 - Approaches for Defining Global Market Size (Value, Volume* & Price*)

Note*: In applicable scenarios
Step 3 - Data Sources
Primary Research
- Web Analytics
- Survey Reports
- Research Institute
- Latest Research Reports
- Opinion Leaders
Secondary Research
- Annual Reports
- White Paper
- Latest Press Release
- Industry Association
- Paid Database
- Investor Presentations

Step 4 - Data Triangulation
Involves using different sources of information in order to increase the validity of a study
These sources are likely to be stakeholders in a program - participants, other researchers, program staff, other community members, and so on.
Then we put all data in single framework & apply various statistical tools to find out the dynamic on the market.
During the analysis stage, feedback from the stakeholder groups would be compared to determine areas of agreement as well as areas of divergence
