

Key Insights
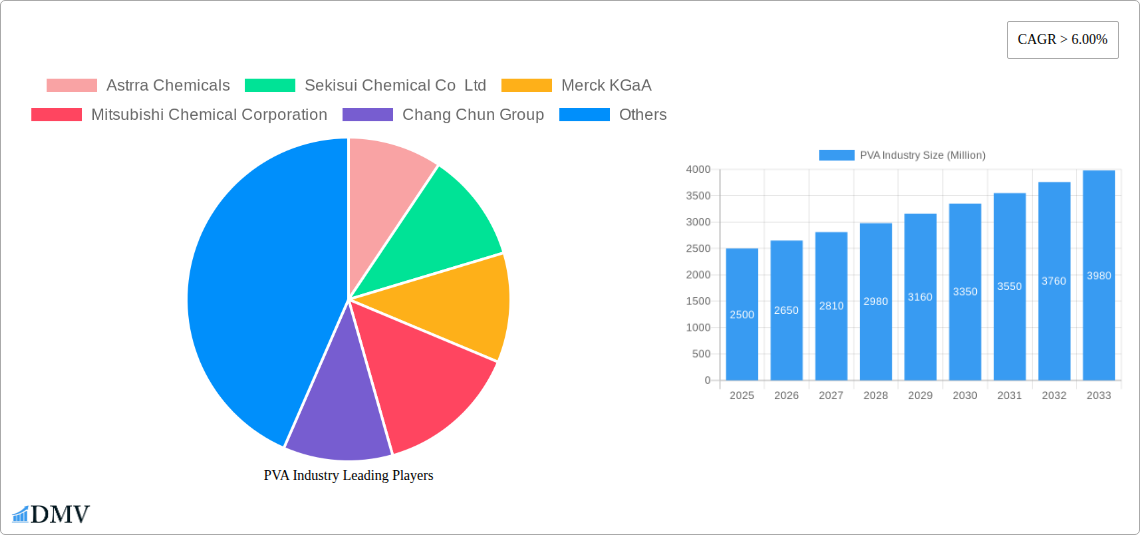
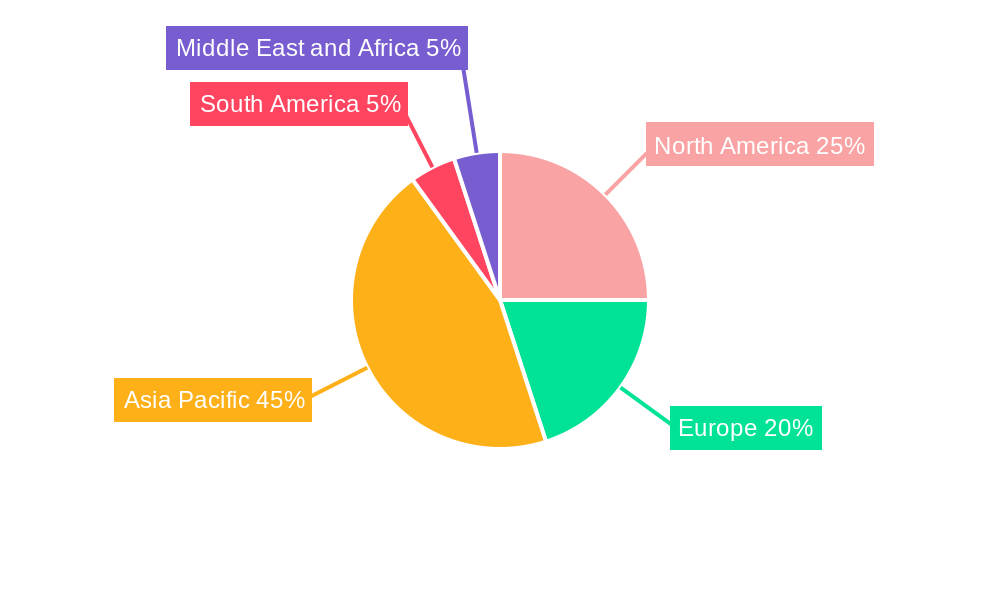
The global Polyvinyl Alcohol (PVA) market, valued at approximately $2.5 billion in 2025, is projected to experience robust growth, exceeding a 6% CAGR through 2033. This expansion is driven by several key factors. Firstly, the burgeoning food packaging sector, demanding high-barrier films and coatings, significantly fuels PVA consumption. The rise in demand for eco-friendly and biodegradable packaging solutions further strengthens this trend. Secondly, the construction industry's increasing use of PVA in adhesives, binders, and coatings contributes significantly to market growth. This is coupled with ongoing advancements in PVA technology, leading to the development of improved grades with enhanced properties like low foaming and higher tack, specifically targeting the textile and paper manufacturing industries. Finally, the electronics sector utilizes PVA in specialized applications, showcasing its versatility and fueling further market expansion. The Asia-Pacific region, particularly China and India, currently holds a dominant market share, owing to their large manufacturing base and expanding downstream industries.
However, certain restraints are also influencing the market's trajectory. Fluctuations in raw material prices, primarily vinyl acetate monomer, directly impact PVA production costs. Stringent environmental regulations regarding the disposal of PVA waste materials present a challenge to manufacturers. Nevertheless, ongoing research and development efforts focusing on sustainable PVA production and waste management solutions are actively addressing these concerns. The market is segmented by grade (fully, partially, sub-partially hydrolyzed, low foaming, and other specialized grades) and end-user applications (food packaging, paper manufacturing, construction, electronics, textiles, and others). The competitive landscape is characterized by established players like Sekisui Chemical, Merck KGaA, and Mitsubishi Chemical, alongside several regional players, leading to a dynamic and innovative market landscape.
PVA Industry Market Report: 2019-2033 Forecast
This comprehensive report provides a detailed analysis of the Polyvinyl Alcohol (PVA) industry, offering invaluable insights for stakeholders seeking to navigate this dynamic market. Spanning the period from 2019 to 2033, with a base year of 2025 and a forecast period of 2025-2033, this report examines key trends, growth drivers, and challenges shaping the future of the PVA market. The report projects a market value exceeding $XX Million by 2033, driven by increasing demand across diverse end-use sectors.
PVA Industry Market Composition & Trends
This section analyzes the competitive landscape, innovation drivers, regulatory environment, substitute products, and key end-user segments within the $XX Million PVA market. The report examines market share distribution amongst key players, including Astrra Chemicals, Sekisui Chemical Co Ltd, Merck KGaA, Mitsubishi Chemical Corporation, Chang Chun Group, SNP Inc, Kemipex, Kuraray Europe GmbH, Anhui Wanwei Group, Japan Vam & Poval Co Ltd, and Polysciences Inc (list not exhaustive). The analysis explores the impact of mergers and acquisitions (M&A) activity, detailing deal values where available. For example, the market witnessed significant M&A activity with a total deal value exceeding $XX Million in the past five years, driven by the consolidation of smaller players and expansion into new geographical markets.
- Market Concentration: High concentration with a few major players holding significant market share.
- Innovation Catalysts: Focus on developing sustainable and high-performance PVA grades.
- Regulatory Landscape: Stringent environmental regulations are driving the adoption of eco-friendly PVA solutions.
- Substitute Products: Competition from alternative materials, such as starch-based adhesives, is analyzed.
- End-User Profiles: Detailed analysis of demand from key sectors, such as food packaging, paper manufacturing, and construction, focusing on growth rates and consumption patterns.
- M&A Activities: Assessment of major mergers, acquisitions, and joint ventures, including their impact on market dynamics and competitive landscapes.
PVA Industry Industry Evolution
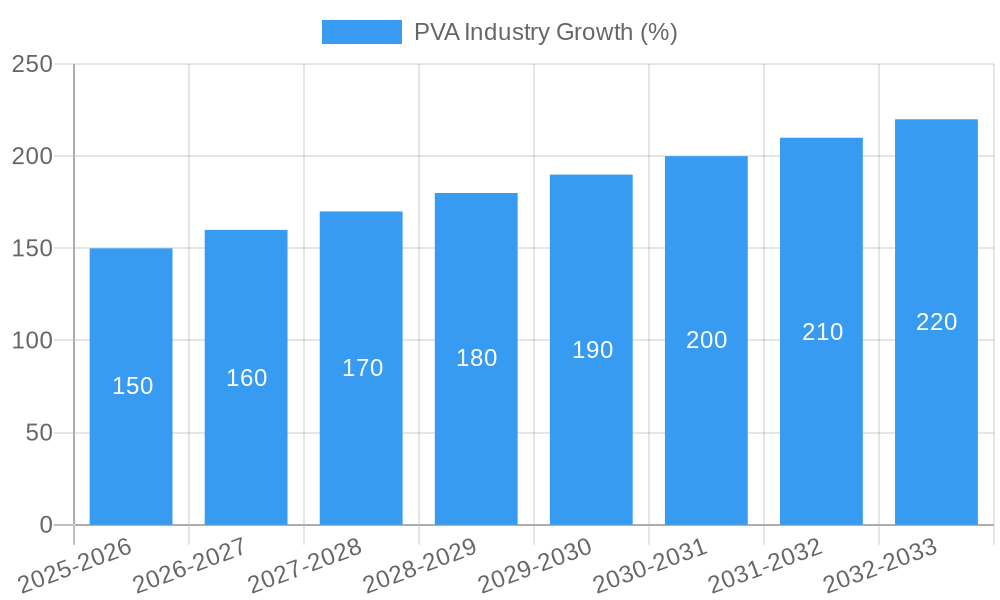
This section provides a comprehensive analysis of the PVA industry's evolution during the period 2019-2033. The report details market growth trajectories, technological advancements, and shifting consumer demands, providing specific data points on growth rates (XX% CAGR from 2025 to 2033) and the adoption of new technologies. The evolution of PVA grades, from fully hydrolyzed to specialized formulations, is also explored, highlighting the increasing demand for customized solutions tailored to specific end-use applications. The impact of sustainability concerns and the increasing focus on biodegradable materials are also analyzed. Innovation in synthesis methods and the development of novel applications are highlighted. This section also addresses the impact of economic cycles and global events on market growth trajectories. Furthermore, the changing consumer demands for eco-friendly and high-performance materials are examined in detail, showcasing the role of technological advancements in meeting these evolving needs.
Leading Regions, Countries, or Segments in PVA Industry
This section identifies the dominant regions, countries, and PVA grades within the global market. The analysis focuses on key drivers, such as investment trends, government support, and market accessibility in each region. The report provides a comprehensive examination of Fully Hydrolyzed, Partially Hydrolyzed, Sub-partially Hydrolyzed, Low Foaming Grades, and Other Grades (Tactified Grades and Fine Particle Grades) of PVA, comparing their growth trajectories and market share. Similarly, it analyzes the end-user segments, including Food Packaging, Paper Manufacturing, Construction, Electronics, Textile Manufacturing, and Other End-User Industries.
- Dominant Region: Asia-Pacific, driven by robust economic growth and high demand from various sectors.
- Key Drivers (Asia-Pacific):
- Significant investments in infrastructure development.
- Expanding food and beverage industry.
- Growing demand from packaging and textile sectors.
- Dominant Grade: Partially Hydrolyzed PVA, due to its versatility and cost-effectiveness.
- Dominant End-User: Food Packaging, owing to its excellent film-forming properties and biodegradability.
- Country-Specific Analysis: In-depth assessments for key markets such as China, Japan, and the US.
PVA Industry Product Innovations
Recent innovations in the PVA industry encompass the development of high-performance grades with improved water resistance, enhanced film-forming properties, and enhanced biodegradability for sustainable applications. The introduction of PVA-based nanomaterials and composites has further expanded the range of applications across diverse sectors, enhancing their performance and value. Unique selling propositions for these new PVA materials include their eco-friendly nature, compatibility with various processing techniques, and superior performance characteristics compared to existing materials.
Propelling Factors for PVA Industry Growth
The growth of the PVA industry is fueled by several factors, including rising demand from the packaging and construction sectors, increasing use of PVA in electronics and textiles, and government support for sustainable materials. Economic growth in developing countries and the expanding middle class are further contributing to market expansion. Technological advancements in PVA synthesis and processing have also made it more cost-effective and versatile, furthering its adoption. Stricter environmental regulations are prompting a shift towards bio-based and biodegradable polymers, creating demand for PVA as an eco-friendly alternative.
Obstacles in the PVA Industry Market
The PVA industry faces challenges including fluctuating raw material prices, competition from cheaper substitutes, and supply chain disruptions caused by geopolitical uncertainties. Regulatory hurdles related to environmental concerns and stringent safety standards can also impede market growth. The impact of these obstacles is estimated to reduce the market growth by approximately XX% during the forecast period, highlighting the need for efficient supply chain management and innovative solutions to mitigate these risks.
Future Opportunities in PVA Industry
The PVA market presents promising opportunities in the development of biodegradable and compostable PVA films for packaging applications, expansion into emerging markets, and research into new PVA-based composites and nanomaterials for advanced technologies. Emerging applications in biomedical and pharmaceutical sectors also offer significant potential for PVA growth. The focus on sustainable and eco-friendly materials creates further opportunities for specialized PVA grades tailored to meet environmental regulations.
Major Players in the PVA Industry Ecosystem
- Astrra Chemicals
- Sekisui Chemical Co Ltd
- Merck KGaA
- Mitsubishi Chemical Corporation
- Chang Chun Group
- SNP Inc
- Kemipex
- Kuraray Europe GmbH
- Anhui Wanwei Group
- Japan Vam & Poval Co Ltd
- Polysciences Inc
Key Developments in PVA Industry Industry
- August 2022: Sekisui Specialty Chemicals (SSC) initiated feasibility studies to expand its Polyvinyl Alcohol (PVOH) supply network, aiming for a 25% capacity increase. This expansion reflects the growing demand and underscores Sekisui's commitment to meeting market needs.
- November 2021: Kuraray Poval established a new sales organization in Iberia to enhance customer proximity and market reach for its PVOH products (Poval, Elvanol, Exceval, and Mowiflex). This move strengthens Kuraray's market position in the region.
Strategic PVA Industry Market Forecast
The PVA industry is poised for robust growth driven by increasing demand from key end-use sectors, technological advancements leading to the development of innovative PVA-based products, and a rising emphasis on eco-friendly materials. This growth will be further accelerated by expanding applications in diverse industries, such as biomedicine and pharmaceuticals. This positive outlook suggests substantial market potential in the coming years, creating opportunities for both established players and new entrants to capitalize on this evolving landscape. The market is expected to grow at a CAGR of XX% during the forecast period.
PVA Industry Segmentation
-
1. Grade
- 1.1. Fully Hydrolyzed
- 1.2. Partially Hydrolyzed
- 1.3. Sub-partially Hydrolyzed
- 1.4. Low Foaming Grades
- 1.5. Other Gr
-
2. End User
- 2.1. Food Packaging
- 2.2. Paper Manufacturing
- 2.3. Construction
- 2.4. Electronics
- 2.5. Textile Manufacturing
- 2.6. Other End User Industries
PVA Industry Segmentation By Geography
-
1. Asia Pacific
- 1.1. China
- 1.2. India
- 1.3. Japan
- 1.4. South Korea
- 1.5. Rest of Asia Pacific
-
2. North America
- 2.1. United States
- 2.2. Canada
- 2.3. Mexico
-
3. Europe
- 3.1. Germany
- 3.2. United Kingdom
- 3.3. Italy
- 3.4. France
- 3.5. Rest of Europe
-
4. South America
- 4.1. Brazil
- 4.2. Argentina
- 4.3. Rest of South America
-
5. Middle East and Africa
- 5.1. Saudi Arabia
- 5.2. South Africa
- 5.3. Rest of Middle East and Africa
PVA Industry REPORT HIGHLIGHTS
| Aspects | Details |
|---|---|
| Study Period | 2019-2033 |
| Base Year | 2024 |
| Estimated Year | 2025 |
| Forecast Period | 2025-2033 |
| Historical Period | 2019-2024 |
| Growth Rate | CAGR of > 6.00% from 2019-2033 |
| Segmentation |
|
Table of Contents
- 1. Introduction
- 1.1. Research Scope
- 1.2. Market Segmentation
- 1.3. Research Methodology
- 1.4. Definitions and Assumptions
- 2. Executive Summary
- 2.1. Introduction
- 3. Market Dynamics
- 3.1. Introduction
- 3.2. Market Drivers
- 3.2.1. Increasing Use in the Construction Industry; Growing Food Packaging Industry
- 3.3. Market Restrains
- 3.3.1. Hazardous Health Effects While Manufacturing
- 3.4. Market Trends
- 3.4.1. Food Packaging to Dominate the Market
- 4. Market Factor Analysis
- 4.1. Porters Five Forces
- 4.2. Supply/Value Chain
- 4.3. PESTEL analysis
- 4.4. Market Entropy
- 4.5. Patent/Trademark Analysis
- 5. Global PVA Industry Analysis, Insights and Forecast, 2019-2031
- 5.1. Market Analysis, Insights and Forecast - by Grade
- 5.1.1. Fully Hydrolyzed
- 5.1.2. Partially Hydrolyzed
- 5.1.3. Sub-partially Hydrolyzed
- 5.1.4. Low Foaming Grades
- 5.1.5. Other Gr
- 5.2. Market Analysis, Insights and Forecast - by End User
- 5.2.1. Food Packaging
- 5.2.2. Paper Manufacturing
- 5.2.3. Construction
- 5.2.4. Electronics
- 5.2.5. Textile Manufacturing
- 5.2.6. Other End User Industries
- 5.3. Market Analysis, Insights and Forecast - by Region
- 5.3.1. Asia Pacific
- 5.3.2. North America
- 5.3.3. Europe
- 5.3.4. South America
- 5.3.5. Middle East and Africa
- 5.1. Market Analysis, Insights and Forecast - by Grade
- 6. Asia Pacific PVA Industry Analysis, Insights and Forecast, 2019-2031
- 6.1. Market Analysis, Insights and Forecast - by Grade
- 6.1.1. Fully Hydrolyzed
- 6.1.2. Partially Hydrolyzed
- 6.1.3. Sub-partially Hydrolyzed
- 6.1.4. Low Foaming Grades
- 6.1.5. Other Gr
- 6.2. Market Analysis, Insights and Forecast - by End User
- 6.2.1. Food Packaging
- 6.2.2. Paper Manufacturing
- 6.2.3. Construction
- 6.2.4. Electronics
- 6.2.5. Textile Manufacturing
- 6.2.6. Other End User Industries
- 6.1. Market Analysis, Insights and Forecast - by Grade
- 7. North America PVA Industry Analysis, Insights and Forecast, 2019-2031
- 7.1. Market Analysis, Insights and Forecast - by Grade
- 7.1.1. Fully Hydrolyzed
- 7.1.2. Partially Hydrolyzed
- 7.1.3. Sub-partially Hydrolyzed
- 7.1.4. Low Foaming Grades
- 7.1.5. Other Gr
- 7.2. Market Analysis, Insights and Forecast - by End User
- 7.2.1. Food Packaging
- 7.2.2. Paper Manufacturing
- 7.2.3. Construction
- 7.2.4. Electronics
- 7.2.5. Textile Manufacturing
- 7.2.6. Other End User Industries
- 7.1. Market Analysis, Insights and Forecast - by Grade
- 8. Europe PVA Industry Analysis, Insights and Forecast, 2019-2031
- 8.1. Market Analysis, Insights and Forecast - by Grade
- 8.1.1. Fully Hydrolyzed
- 8.1.2. Partially Hydrolyzed
- 8.1.3. Sub-partially Hydrolyzed
- 8.1.4. Low Foaming Grades
- 8.1.5. Other Gr
- 8.2. Market Analysis, Insights and Forecast - by End User
- 8.2.1. Food Packaging
- 8.2.2. Paper Manufacturing
- 8.2.3. Construction
- 8.2.4. Electronics
- 8.2.5. Textile Manufacturing
- 8.2.6. Other End User Industries
- 8.1. Market Analysis, Insights and Forecast - by Grade
- 9. South America PVA Industry Analysis, Insights and Forecast, 2019-2031
- 9.1. Market Analysis, Insights and Forecast - by Grade
- 9.1.1. Fully Hydrolyzed
- 9.1.2. Partially Hydrolyzed
- 9.1.3. Sub-partially Hydrolyzed
- 9.1.4. Low Foaming Grades
- 9.1.5. Other Gr
- 9.2. Market Analysis, Insights and Forecast - by End User
- 9.2.1. Food Packaging
- 9.2.2. Paper Manufacturing
- 9.2.3. Construction
- 9.2.4. Electronics
- 9.2.5. Textile Manufacturing
- 9.2.6. Other End User Industries
- 9.1. Market Analysis, Insights and Forecast - by Grade
- 10. Middle East and Africa PVA Industry Analysis, Insights and Forecast, 2019-2031
- 10.1. Market Analysis, Insights and Forecast - by Grade
- 10.1.1. Fully Hydrolyzed
- 10.1.2. Partially Hydrolyzed
- 10.1.3. Sub-partially Hydrolyzed
- 10.1.4. Low Foaming Grades
- 10.1.5. Other Gr
- 10.2. Market Analysis, Insights and Forecast - by End User
- 10.2.1. Food Packaging
- 10.2.2. Paper Manufacturing
- 10.2.3. Construction
- 10.2.4. Electronics
- 10.2.5. Textile Manufacturing
- 10.2.6. Other End User Industries
- 10.1. Market Analysis, Insights and Forecast - by Grade
- 11. Asia Pacific PVA Industry Analysis, Insights and Forecast, 2019-2031
- 11.1. Market Analysis, Insights and Forecast - By Country/Sub-region
- 11.1.1 China
- 11.1.2 India
- 11.1.3 Japan
- 11.1.4 South Korea
- 11.1.5 Rest of Asia Pacific
- 12. North America PVA Industry Analysis, Insights and Forecast, 2019-2031
- 12.1. Market Analysis, Insights and Forecast - By Country/Sub-region
- 12.1.1 United States
- 12.1.2 Canada
- 12.1.3 Mexico
- 13. Europe PVA Industry Analysis, Insights and Forecast, 2019-2031
- 13.1. Market Analysis, Insights and Forecast - By Country/Sub-region
- 13.1.1 Germany
- 13.1.2 United Kingdom
- 13.1.3 Italy
- 13.1.4 France
- 13.1.5 Rest of Europe
- 14. South America PVA Industry Analysis, Insights and Forecast, 2019-2031
- 14.1. Market Analysis, Insights and Forecast - By Country/Sub-region
- 14.1.1 Brazil
- 14.1.2 Argentina
- 14.1.3 Rest of South America
- 15. Middle East and Africa PVA Industry Analysis, Insights and Forecast, 2019-2031
- 15.1. Market Analysis, Insights and Forecast - By Country/Sub-region
- 15.1.1 Saudi Arabia
- 15.1.2 South Africa
- 15.1.3 Rest of Middle East and Africa
- 16. Competitive Analysis
- 16.1. Global Market Share Analysis 2024
- 16.2. Company Profiles
- 16.2.1 Astrra Chemicals
- 16.2.1.1. Overview
- 16.2.1.2. Products
- 16.2.1.3. SWOT Analysis
- 16.2.1.4. Recent Developments
- 16.2.1.5. Financials (Based on Availability)
- 16.2.2 Sekisui Chemical Co Ltd
- 16.2.2.1. Overview
- 16.2.2.2. Products
- 16.2.2.3. SWOT Analysis
- 16.2.2.4. Recent Developments
- 16.2.2.5. Financials (Based on Availability)
- 16.2.3 Merck KGaA
- 16.2.3.1. Overview
- 16.2.3.2. Products
- 16.2.3.3. SWOT Analysis
- 16.2.3.4. Recent Developments
- 16.2.3.5. Financials (Based on Availability)
- 16.2.4 Mitsubishi Chemical Corporation
- 16.2.4.1. Overview
- 16.2.4.2. Products
- 16.2.4.3. SWOT Analysis
- 16.2.4.4. Recent Developments
- 16.2.4.5. Financials (Based on Availability)
- 16.2.5 Chang Chun Group
- 16.2.5.1. Overview
- 16.2.5.2. Products
- 16.2.5.3. SWOT Analysis
- 16.2.5.4. Recent Developments
- 16.2.5.5. Financials (Based on Availability)
- 16.2.6 SNP Inc *List Not Exhaustive
- 16.2.6.1. Overview
- 16.2.6.2. Products
- 16.2.6.3. SWOT Analysis
- 16.2.6.4. Recent Developments
- 16.2.6.5. Financials (Based on Availability)
- 16.2.7 Kemipex
- 16.2.7.1. Overview
- 16.2.7.2. Products
- 16.2.7.3. SWOT Analysis
- 16.2.7.4. Recent Developments
- 16.2.7.5. Financials (Based on Availability)
- 16.2.8 Kuraray Europe GmbH
- 16.2.8.1. Overview
- 16.2.8.2. Products
- 16.2.8.3. SWOT Analysis
- 16.2.8.4. Recent Developments
- 16.2.8.5. Financials (Based on Availability)
- 16.2.9 Anhui Wanwei Group
- 16.2.9.1. Overview
- 16.2.9.2. Products
- 16.2.9.3. SWOT Analysis
- 16.2.9.4. Recent Developments
- 16.2.9.5. Financials (Based on Availability)
- 16.2.10 Japan Vam & Poval Co Ltd
- 16.2.10.1. Overview
- 16.2.10.2. Products
- 16.2.10.3. SWOT Analysis
- 16.2.10.4. Recent Developments
- 16.2.10.5. Financials (Based on Availability)
- 16.2.11 Polysciences Inc
- 16.2.11.1. Overview
- 16.2.11.2. Products
- 16.2.11.3. SWOT Analysis
- 16.2.11.4. Recent Developments
- 16.2.11.5. Financials (Based on Availability)
- 16.2.1 Astrra Chemicals
List of Figures
- Figure 1: Global PVA Industry Revenue Breakdown (Million, %) by Region 2024 & 2032
- Figure 2: Asia Pacific PVA Industry Revenue (Million), by Country 2024 & 2032
- Figure 3: Asia Pacific PVA Industry Revenue Share (%), by Country 2024 & 2032
- Figure 4: North America PVA Industry Revenue (Million), by Country 2024 & 2032
- Figure 5: North America PVA Industry Revenue Share (%), by Country 2024 & 2032
- Figure 6: Europe PVA Industry Revenue (Million), by Country 2024 & 2032
- Figure 7: Europe PVA Industry Revenue Share (%), by Country 2024 & 2032
- Figure 8: South America PVA Industry Revenue (Million), by Country 2024 & 2032
- Figure 9: South America PVA Industry Revenue Share (%), by Country 2024 & 2032
- Figure 10: Middle East and Africa PVA Industry Revenue (Million), by Country 2024 & 2032
- Figure 11: Middle East and Africa PVA Industry Revenue Share (%), by Country 2024 & 2032
- Figure 12: Asia Pacific PVA Industry Revenue (Million), by Grade 2024 & 2032
- Figure 13: Asia Pacific PVA Industry Revenue Share (%), by Grade 2024 & 2032
- Figure 14: Asia Pacific PVA Industry Revenue (Million), by End User 2024 & 2032
- Figure 15: Asia Pacific PVA Industry Revenue Share (%), by End User 2024 & 2032
- Figure 16: Asia Pacific PVA Industry Revenue (Million), by Country 2024 & 2032
- Figure 17: Asia Pacific PVA Industry Revenue Share (%), by Country 2024 & 2032
- Figure 18: North America PVA Industry Revenue (Million), by Grade 2024 & 2032
- Figure 19: North America PVA Industry Revenue Share (%), by Grade 2024 & 2032
- Figure 20: North America PVA Industry Revenue (Million), by End User 2024 & 2032
- Figure 21: North America PVA Industry Revenue Share (%), by End User 2024 & 2032
- Figure 22: North America PVA Industry Revenue (Million), by Country 2024 & 2032
- Figure 23: North America PVA Industry Revenue Share (%), by Country 2024 & 2032
- Figure 24: Europe PVA Industry Revenue (Million), by Grade 2024 & 2032
- Figure 25: Europe PVA Industry Revenue Share (%), by Grade 2024 & 2032
- Figure 26: Europe PVA Industry Revenue (Million), by End User 2024 & 2032
- Figure 27: Europe PVA Industry Revenue Share (%), by End User 2024 & 2032
- Figure 28: Europe PVA Industry Revenue (Million), by Country 2024 & 2032
- Figure 29: Europe PVA Industry Revenue Share (%), by Country 2024 & 2032
- Figure 30: South America PVA Industry Revenue (Million), by Grade 2024 & 2032
- Figure 31: South America PVA Industry Revenue Share (%), by Grade 2024 & 2032
- Figure 32: South America PVA Industry Revenue (Million), by End User 2024 & 2032
- Figure 33: South America PVA Industry Revenue Share (%), by End User 2024 & 2032
- Figure 34: South America PVA Industry Revenue (Million), by Country 2024 & 2032
- Figure 35: South America PVA Industry Revenue Share (%), by Country 2024 & 2032
- Figure 36: Middle East and Africa PVA Industry Revenue (Million), by Grade 2024 & 2032
- Figure 37: Middle East and Africa PVA Industry Revenue Share (%), by Grade 2024 & 2032
- Figure 38: Middle East and Africa PVA Industry Revenue (Million), by End User 2024 & 2032
- Figure 39: Middle East and Africa PVA Industry Revenue Share (%), by End User 2024 & 2032
- Figure 40: Middle East and Africa PVA Industry Revenue (Million), by Country 2024 & 2032
- Figure 41: Middle East and Africa PVA Industry Revenue Share (%), by Country 2024 & 2032
List of Tables
- Table 1: Global PVA Industry Revenue Million Forecast, by Region 2019 & 2032
- Table 2: Global PVA Industry Revenue Million Forecast, by Grade 2019 & 2032
- Table 3: Global PVA Industry Revenue Million Forecast, by End User 2019 & 2032
- Table 4: Global PVA Industry Revenue Million Forecast, by Region 2019 & 2032
- Table 5: Global PVA Industry Revenue Million Forecast, by Country 2019 & 2032
- Table 6: China PVA Industry Revenue (Million) Forecast, by Application 2019 & 2032
- Table 7: India PVA Industry Revenue (Million) Forecast, by Application 2019 & 2032
- Table 8: Japan PVA Industry Revenue (Million) Forecast, by Application 2019 & 2032
- Table 9: South Korea PVA Industry Revenue (Million) Forecast, by Application 2019 & 2032
- Table 10: Rest of Asia Pacific PVA Industry Revenue (Million) Forecast, by Application 2019 & 2032
- Table 11: Global PVA Industry Revenue Million Forecast, by Country 2019 & 2032
- Table 12: United States PVA Industry Revenue (Million) Forecast, by Application 2019 & 2032
- Table 13: Canada PVA Industry Revenue (Million) Forecast, by Application 2019 & 2032
- Table 14: Mexico PVA Industry Revenue (Million) Forecast, by Application 2019 & 2032
- Table 15: Global PVA Industry Revenue Million Forecast, by Country 2019 & 2032
- Table 16: Germany PVA Industry Revenue (Million) Forecast, by Application 2019 & 2032
- Table 17: United Kingdom PVA Industry Revenue (Million) Forecast, by Application 2019 & 2032
- Table 18: Italy PVA Industry Revenue (Million) Forecast, by Application 2019 & 2032
- Table 19: France PVA Industry Revenue (Million) Forecast, by Application 2019 & 2032
- Table 20: Rest of Europe PVA Industry Revenue (Million) Forecast, by Application 2019 & 2032
- Table 21: Global PVA Industry Revenue Million Forecast, by Country 2019 & 2032
- Table 22: Brazil PVA Industry Revenue (Million) Forecast, by Application 2019 & 2032
- Table 23: Argentina PVA Industry Revenue (Million) Forecast, by Application 2019 & 2032
- Table 24: Rest of South America PVA Industry Revenue (Million) Forecast, by Application 2019 & 2032
- Table 25: Global PVA Industry Revenue Million Forecast, by Country 2019 & 2032
- Table 26: Saudi Arabia PVA Industry Revenue (Million) Forecast, by Application 2019 & 2032
- Table 27: South Africa PVA Industry Revenue (Million) Forecast, by Application 2019 & 2032
- Table 28: Rest of Middle East and Africa PVA Industry Revenue (Million) Forecast, by Application 2019 & 2032
- Table 29: Global PVA Industry Revenue Million Forecast, by Grade 2019 & 2032
- Table 30: Global PVA Industry Revenue Million Forecast, by End User 2019 & 2032
- Table 31: Global PVA Industry Revenue Million Forecast, by Country 2019 & 2032
- Table 32: China PVA Industry Revenue (Million) Forecast, by Application 2019 & 2032
- Table 33: India PVA Industry Revenue (Million) Forecast, by Application 2019 & 2032
- Table 34: Japan PVA Industry Revenue (Million) Forecast, by Application 2019 & 2032
- Table 35: South Korea PVA Industry Revenue (Million) Forecast, by Application 2019 & 2032
- Table 36: Rest of Asia Pacific PVA Industry Revenue (Million) Forecast, by Application 2019 & 2032
- Table 37: Global PVA Industry Revenue Million Forecast, by Grade 2019 & 2032
- Table 38: Global PVA Industry Revenue Million Forecast, by End User 2019 & 2032
- Table 39: Global PVA Industry Revenue Million Forecast, by Country 2019 & 2032
- Table 40: United States PVA Industry Revenue (Million) Forecast, by Application 2019 & 2032
- Table 41: Canada PVA Industry Revenue (Million) Forecast, by Application 2019 & 2032
- Table 42: Mexico PVA Industry Revenue (Million) Forecast, by Application 2019 & 2032
- Table 43: Global PVA Industry Revenue Million Forecast, by Grade 2019 & 2032
- Table 44: Global PVA Industry Revenue Million Forecast, by End User 2019 & 2032
- Table 45: Global PVA Industry Revenue Million Forecast, by Country 2019 & 2032
- Table 46: Germany PVA Industry Revenue (Million) Forecast, by Application 2019 & 2032
- Table 47: United Kingdom PVA Industry Revenue (Million) Forecast, by Application 2019 & 2032
- Table 48: Italy PVA Industry Revenue (Million) Forecast, by Application 2019 & 2032
- Table 49: France PVA Industry Revenue (Million) Forecast, by Application 2019 & 2032
- Table 50: Rest of Europe PVA Industry Revenue (Million) Forecast, by Application 2019 & 2032
- Table 51: Global PVA Industry Revenue Million Forecast, by Grade 2019 & 2032
- Table 52: Global PVA Industry Revenue Million Forecast, by End User 2019 & 2032
- Table 53: Global PVA Industry Revenue Million Forecast, by Country 2019 & 2032
- Table 54: Brazil PVA Industry Revenue (Million) Forecast, by Application 2019 & 2032
- Table 55: Argentina PVA Industry Revenue (Million) Forecast, by Application 2019 & 2032
- Table 56: Rest of South America PVA Industry Revenue (Million) Forecast, by Application 2019 & 2032
- Table 57: Global PVA Industry Revenue Million Forecast, by Grade 2019 & 2032
- Table 58: Global PVA Industry Revenue Million Forecast, by End User 2019 & 2032
- Table 59: Global PVA Industry Revenue Million Forecast, by Country 2019 & 2032
- Table 60: Saudi Arabia PVA Industry Revenue (Million) Forecast, by Application 2019 & 2032
- Table 61: South Africa PVA Industry Revenue (Million) Forecast, by Application 2019 & 2032
- Table 62: Rest of Middle East and Africa PVA Industry Revenue (Million) Forecast, by Application 2019 & 2032
Frequently Asked Questions
1. What is the projected Compound Annual Growth Rate (CAGR) of the PVA Industry?
The projected CAGR is approximately > 6.00%.
2. Which companies are prominent players in the PVA Industry?
Key companies in the market include Astrra Chemicals, Sekisui Chemical Co Ltd, Merck KGaA, Mitsubishi Chemical Corporation, Chang Chun Group, SNP Inc *List Not Exhaustive, Kemipex, Kuraray Europe GmbH, Anhui Wanwei Group, Japan Vam & Poval Co Ltd, Polysciences Inc.
3. What are the main segments of the PVA Industry?
The market segments include Grade, End User.
4. Can you provide details about the market size?
The market size is estimated to be USD XX Million as of 2022.
5. What are some drivers contributing to market growth?
Increasing Use in the Construction Industry; Growing Food Packaging Industry.
6. What are the notable trends driving market growth?
Food Packaging to Dominate the Market.
7. Are there any restraints impacting market growth?
Hazardous Health Effects While Manufacturing.
8. Can you provide examples of recent developments in the market?
August 2022: Sekisui Specialty Chemicals (SSC) began the feasibility studies for expanding its Polyvinyl Alcohol (PVOH) supply network to meet the growing needs of its downstream customers. It will increase Sekisui's PVOH capacity by as much as 25%.
9. What pricing options are available for accessing the report?
Pricing options include single-user, multi-user, and enterprise licenses priced at USD 4750, USD 5250, and USD 8750 respectively.
10. Is the market size provided in terms of value or volume?
The market size is provided in terms of value, measured in Million.
11. Are there any specific market keywords associated with the report?
Yes, the market keyword associated with the report is "PVA Industry," which aids in identifying and referencing the specific market segment covered.
12. How do I determine which pricing option suits my needs best?
The pricing options vary based on user requirements and access needs. Individual users may opt for single-user licenses, while businesses requiring broader access may choose multi-user or enterprise licenses for cost-effective access to the report.
13. Are there any additional resources or data provided in the PVA Industry report?
While the report offers comprehensive insights, it's advisable to review the specific contents or supplementary materials provided to ascertain if additional resources or data are available.
14. How can I stay updated on further developments or reports in the PVA Industry?
To stay informed about further developments, trends, and reports in the PVA Industry, consider subscribing to industry newsletters, following relevant companies and organizations, or regularly checking reputable industry news sources and publications.
Methodology
Step 1 - Identification of Relevant Samples Size from Population Database


Step 2 - Approaches for Defining Global Market Size (Value, Volume* & Price*)

Note*: In applicable scenarios
Step 3 - Data Sources
Primary Research
- Web Analytics
- Survey Reports
- Research Institute
- Latest Research Reports
- Opinion Leaders
Secondary Research
- Annual Reports
- White Paper
- Latest Press Release
- Industry Association
- Paid Database
- Investor Presentations

Step 4 - Data Triangulation
Involves using different sources of information in order to increase the validity of a study
These sources are likely to be stakeholders in a program - participants, other researchers, program staff, other community members, and so on.
Then we put all data in single framework & apply various statistical tools to find out the dynamic on the market.
During the analysis stage, feedback from the stakeholder groups would be compared to determine areas of agreement as well as areas of divergence
