

Key Insights
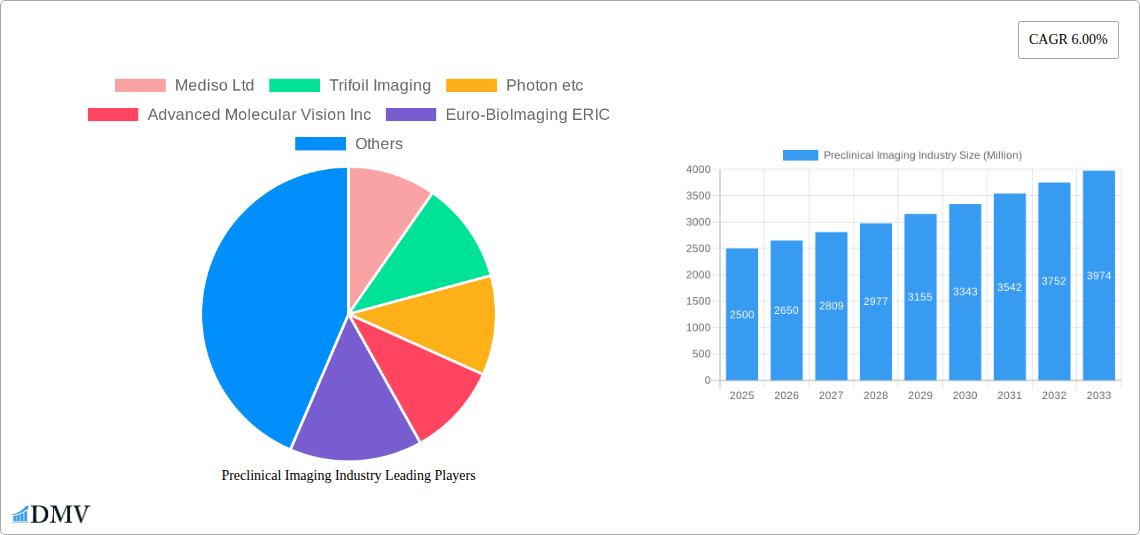
The preclinical imaging market, encompassing technologies like optical, nuclear, micro-MRI, micro-ultrasound, micro-CT, and photoacoustic imaging systems, is experiencing robust growth. A compound annual growth rate (CAGR) of 6.00% from 2019 to 2024 suggests a significant expansion, driven by factors such as the increasing demand for efficient drug discovery and development processes, advancements in imaging technologies offering higher resolution and sensitivity, and a growing need for improved preclinical research in areas like oncology, neurology, and cardiovascular disease. The rising adoption of personalized medicine and the increasing prevalence of chronic diseases further fuel market expansion. Key players like Mediso Ltd, PerkinElmer Inc, Bruker Corporation, and Fujifilm Holdings Corporation are actively contributing to this growth through continuous innovation and strategic partnerships. The market is segmented by modality, with optical and nuclear imaging currently holding significant shares due to their established presence and widespread applications. However, micro-MRI and micro-CT are expected to witness substantial growth due to their versatility and ability to provide detailed anatomical and functional information. Geographic analysis shows a strong presence across North America and Europe, driven by robust research infrastructure and funding, while the Asia-Pacific region is projected to experience considerable growth due to rising investments in research and development.
The forecast period (2025-2033) anticipates continued market expansion, fueled by ongoing technological advancements, particularly in the areas of multi-modal imaging and artificial intelligence-based image analysis. Challenges such as high initial investment costs associated with certain technologies and regulatory hurdles in certain regions may act as potential restraints. However, the overall market outlook remains positive, driven by the fundamental need for advanced preclinical imaging solutions to accelerate research and development efforts across various therapeutic areas. The ongoing development of more compact, cost-effective, and user-friendly systems is also expected to broaden market adoption and further enhance market growth. Specific segment growth projections will vary based on technological advancements and adoption rates within each modality.
Preclinical Imaging Industry: A Comprehensive Market Report (2019-2033)
This insightful report provides a detailed analysis of the preclinical imaging market, encompassing market size, trends, leading players, and future prospects. With a study period spanning 2019-2033, a base year of 2025, and a forecast period of 2025-2033, this report is an essential resource for stakeholders seeking to understand and capitalize on the growth opportunities within this dynamic sector. The global market is projected to reach xx Million by 2033, exhibiting a Compound Annual Growth Rate (CAGR) of xx% during the forecast period.
Preclinical Imaging Industry Market Composition & Trends
The preclinical imaging market is characterized by a moderately concentrated landscape, with key players like Bruker Corporation, PerkinElmer Inc., and Fujifilm Holdings Corporation holding significant market share. However, the emergence of innovative technologies and new entrants is fostering increased competition. Market share distribution in 2024 is estimated as follows: Bruker Corporation (xx%), PerkinElmer Inc. (xx%), Fujifilm Holdings Corporation (xx%), others (xx%). The market is driven by continuous technological advancements, particularly in modalities like optical imaging and micro-MRI. Stringent regulatory landscapes, particularly regarding the approval of new imaging agents and devices, influence market dynamics. Substitute products, such as traditional histological techniques, exert competitive pressure, but the non-invasive and high-throughput nature of preclinical imaging consistently favors its adoption. The increasing demand for personalized medicine and the rising prevalence of chronic diseases further fuel market growth. M&A activity has been significant, with deal values exceeding xx Million in the past five years. Key end users include pharmaceutical and biotechnology companies, academic research institutions, and contract research organizations (CROs).
- Market Concentration: Moderately concentrated, with a few dominant players.
- Innovation Catalysts: Technological advancements in various imaging modalities.
- Regulatory Landscape: Stringent regulations impacting new product approvals.
- Substitute Products: Histological techniques and other non-imaging methods.
- End-User Profiles: Pharmaceutical companies, research institutions, CROs.
- M&A Activity: Significant activity with deal values exceeding xx Million over the past five years.
Preclinical Imaging Industry Evolution
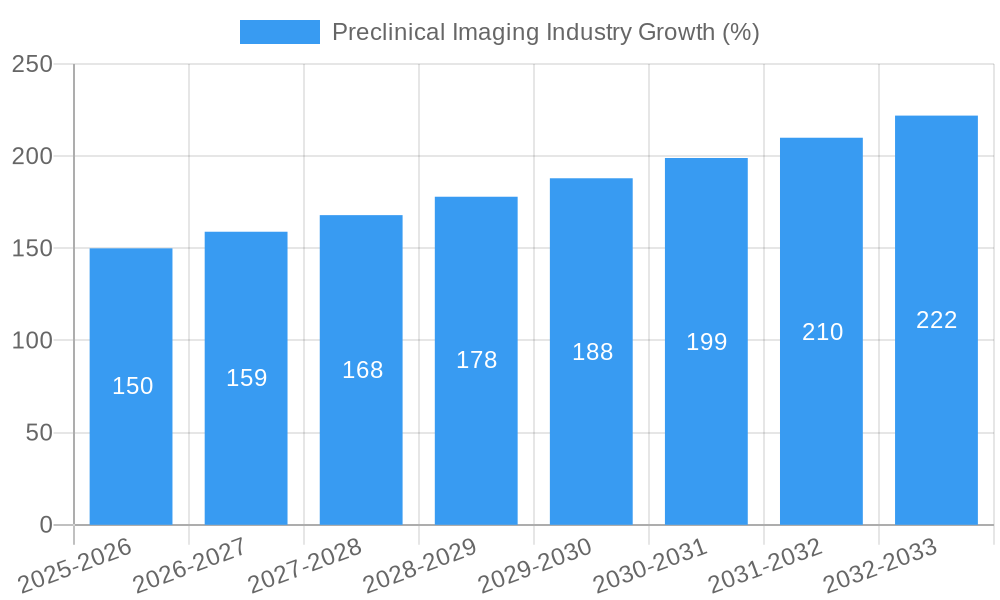
The preclinical imaging market has experienced substantial growth over the historical period (2019-2024), driven by technological advancements and increasing demand for efficient drug discovery and development. The market witnessed a CAGR of xx% during this period, reaching xx Million in 2024. This growth is projected to continue during the forecast period (2025-2033), with a CAGR of xx%, reaching xx Million by 2033. Technological advancements, such as the development of higher-resolution imaging systems, improved image analysis software, and the integration of multi-modal imaging techniques, have significantly enhanced the capabilities of preclinical imaging. The integration of artificial intelligence (AI) and machine learning (ML) algorithms for image analysis is further accelerating market growth. Shifts in consumer demand are evident, with a growing preference for high-throughput, automated systems that reduce manual intervention and accelerate research timelines. The adoption of preclinical imaging techniques is increasing across various research areas, including oncology, cardiology, and neurology. The rising adoption rate is attributed to increasing funding for research and development, a growing need for faster and more effective drug development, and the advantages of preclinical imaging over traditional methods.
Leading Regions, Countries, or Segments in Preclinical Imaging Industry
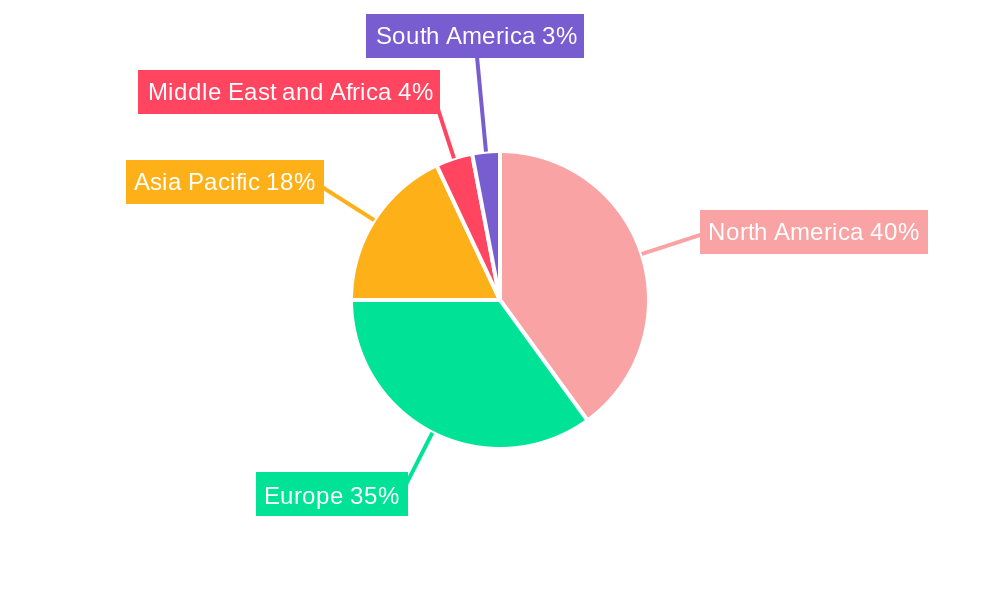
North America currently dominates the preclinical imaging market, driven by robust R&D investments, a well-established healthcare infrastructure, and a large presence of key players. Europe follows as a significant market, driven by a strong focus on life sciences research. Asia-Pacific is experiencing rapid growth, fueled by increasing healthcare spending and expanding research infrastructure.
- North America: High R&D investment, strong infrastructure, major players based here.
- Europe: Strong life sciences research focus, significant government funding.
- Asia-Pacific: Rapid growth due to increasing healthcare spending and research.
Dominant Modalities:
- Micro-MRI: High demand driven by its versatility and high resolution.
- Optical Imaging Systems: Wide adoption for its ease of use and cost-effectiveness in specific applications.
- Micro-CT: Growing use for high-resolution anatomical imaging.
Preclinical Imaging Industry Product Innovations
Recent years have witnessed remarkable innovations in preclinical imaging, with the introduction of advanced systems offering higher resolution, improved sensitivity, and faster image acquisition. For example, Bruker's launch of high-field strength magnets has significantly enhanced MRI capabilities. PerkinElmer's Vega imaging system represents a major advancement in ultrasound technology, offering automated, high-throughput capabilities. These innovations are enabling researchers to conduct more complex and comprehensive studies with enhanced precision and efficiency, thus expanding the applications and market potential of preclinical imaging.
Propelling Factors for Preclinical Imaging Industry Growth
The preclinical imaging market is propelled by several factors. Firstly, the increasing demand for efficient and cost-effective drug development is driving higher adoption rates. Secondly, technological advancements are continuously improving the capabilities of imaging systems. Thirdly, supportive regulatory frameworks and increasing research funding in several countries are encouraging investment in this field.
Obstacles in the Preclinical Imaging Industry Market
The market faces challenges including high initial equipment costs, the need for specialized expertise for operation and analysis, and regulatory hurdles for the approval of new imaging agents and systems. Supply chain disruptions and intense competition from established players also pose obstacles. These factors can limit the market's growth potential, especially in resource-constrained regions.
Future Opportunities in Preclinical Imaging Industry
Future opportunities lie in the development and integration of novel imaging modalities, the application of artificial intelligence in image analysis, and the expansion into new therapeutic areas. The increasing use of personalized medicine and the growing need for advanced preclinical models will further drive market growth. The development of portable and affordable imaging systems will open up new markets in resource-limited settings.
Major Players in the Preclinical Imaging Industry Ecosystem
- Mediso Ltd
- Trifoil Imaging
- Photon etc
- Advanced Molecular Vision Inc
- Euro-BioImaging ERIC
- MR Solutions Ltd
- Aspect Imaging Ltd
- PerkinElmer Inc
- IVIM Technology Corp
- Bruker Corporation
- AXT PTY LTD
- United Imaging Healthcare Co Ltd
- Fujifilm Holdings Corporation
Key Developments in Preclinical Imaging Industry Industry
- May 2022: Bruker launched innovative 7 Tesla and 9.4 Tesla conduction-cooled Maxwell magnets for its preclinical MRI systems, enhancing image quality and resolution.
- April 2022: PerkinElmer expanded its in vivo imaging portfolio with the Vega imaging system, a novel ultrasound platform accelerating non-invasive research and drug development.
Strategic Preclinical Imaging Industry Market Forecast
The preclinical imaging market is poised for significant growth in the coming years, driven by continuous technological advancements, increasing demand for efficient drug development, and rising healthcare spending. Emerging technologies such as AI-powered image analysis and novel imaging modalities will further enhance the capabilities of preclinical imaging, expanding its applications and market potential. The market is expected to witness robust growth, with a projected value exceeding xx Million by 2033.
Preclinical Imaging Industry Segmentation
-
1. Modality
- 1.1. Optical Imaging Systems
- 1.2. Nuclear Imaging Systems
- 1.3. Micro-MRI
- 1.4. Micro-ultrasound
- 1.5. Micro-CT
- 1.6. Photoacoustic Imaging Systems
- 1.7. Other Modality
Preclinical Imaging Industry Segmentation By Geography
-
1. North America
- 1.1. United States
- 1.2. Canada
- 1.3. Mexico
-
2. Europe
- 2.1. Germany
- 2.2. United Kingdom
- 2.3. France
- 2.4. Italy
- 2.5. Spain
- 2.6. Rest of Europe
-
3. Asia Pacific
- 3.1. China
- 3.2. Japan
- 3.3. India
- 3.4. Australia
- 3.5. South Korea
- 3.6. Rest of Asia Pacific
-
4. Middle East and Africa
- 4.1. GCC
- 4.2. South Africa
- 4.3. Rest of Middle East and Africa
-
5. South America
- 5.1. Brazil
- 5.2. Argentina
- 5.3. Rest of South America
Preclinical Imaging Industry REPORT HIGHLIGHTS
| Aspects | Details |
|---|---|
| Study Period | 2019-2033 |
| Base Year | 2024 |
| Estimated Year | 2025 |
| Forecast Period | 2025-2033 |
| Historical Period | 2019-2024 |
| Growth Rate | CAGR of 6.00% from 2019-2033 |
| Segmentation |
|
Table of Contents
- 1. Introduction
- 1.1. Research Scope
- 1.2. Market Segmentation
- 1.3. Research Methodology
- 1.4. Definitions and Assumptions
- 2. Executive Summary
- 2.1. Introduction
- 3. Market Dynamics
- 3.1. Introduction
- 3.2. Market Drivers
- 3.2.1 Technological Advancements in Molecular Imaging; Increasing Demand for Non-invasive Small Animal Imaging Techniques; Increase in Preclinical Research Funding
- 3.2.2 by Both Private and Public Organizations
- 3.3. Market Restrains
- 3.3.1. Strict Regulations in Preclinical Research; High Installation and Operational Costs associated with Preclinical Imaging Modalities
- 3.4. Market Trends
- 3.4.1. Micro-Ultrasound is the Segment by Modality and is Expected to be the Fastest Growing Market
- 4. Market Factor Analysis
- 4.1. Porters Five Forces
- 4.2. Supply/Value Chain
- 4.3. PESTEL analysis
- 4.4. Market Entropy
- 4.5. Patent/Trademark Analysis
- 5. Global Preclinical Imaging Industry Analysis, Insights and Forecast, 2019-2031
- 5.1. Market Analysis, Insights and Forecast - by Modality
- 5.1.1. Optical Imaging Systems
- 5.1.2. Nuclear Imaging Systems
- 5.1.3. Micro-MRI
- 5.1.4. Micro-ultrasound
- 5.1.5. Micro-CT
- 5.1.6. Photoacoustic Imaging Systems
- 5.1.7. Other Modality
- 5.2. Market Analysis, Insights and Forecast - by Region
- 5.2.1. North America
- 5.2.2. Europe
- 5.2.3. Asia Pacific
- 5.2.4. Middle East and Africa
- 5.2.5. South America
- 5.1. Market Analysis, Insights and Forecast - by Modality
- 6. North America Preclinical Imaging Industry Analysis, Insights and Forecast, 2019-2031
- 6.1. Market Analysis, Insights and Forecast - by Modality
- 6.1.1. Optical Imaging Systems
- 6.1.2. Nuclear Imaging Systems
- 6.1.3. Micro-MRI
- 6.1.4. Micro-ultrasound
- 6.1.5. Micro-CT
- 6.1.6. Photoacoustic Imaging Systems
- 6.1.7. Other Modality
- 6.1. Market Analysis, Insights and Forecast - by Modality
- 7. Europe Preclinical Imaging Industry Analysis, Insights and Forecast, 2019-2031
- 7.1. Market Analysis, Insights and Forecast - by Modality
- 7.1.1. Optical Imaging Systems
- 7.1.2. Nuclear Imaging Systems
- 7.1.3. Micro-MRI
- 7.1.4. Micro-ultrasound
- 7.1.5. Micro-CT
- 7.1.6. Photoacoustic Imaging Systems
- 7.1.7. Other Modality
- 7.1. Market Analysis, Insights and Forecast - by Modality
- 8. Asia Pacific Preclinical Imaging Industry Analysis, Insights and Forecast, 2019-2031
- 8.1. Market Analysis, Insights and Forecast - by Modality
- 8.1.1. Optical Imaging Systems
- 8.1.2. Nuclear Imaging Systems
- 8.1.3. Micro-MRI
- 8.1.4. Micro-ultrasound
- 8.1.5. Micro-CT
- 8.1.6. Photoacoustic Imaging Systems
- 8.1.7. Other Modality
- 8.1. Market Analysis, Insights and Forecast - by Modality
- 9. Middle East and Africa Preclinical Imaging Industry Analysis, Insights and Forecast, 2019-2031
- 9.1. Market Analysis, Insights and Forecast - by Modality
- 9.1.1. Optical Imaging Systems
- 9.1.2. Nuclear Imaging Systems
- 9.1.3. Micro-MRI
- 9.1.4. Micro-ultrasound
- 9.1.5. Micro-CT
- 9.1.6. Photoacoustic Imaging Systems
- 9.1.7. Other Modality
- 9.1. Market Analysis, Insights and Forecast - by Modality
- 10. South America Preclinical Imaging Industry Analysis, Insights and Forecast, 2019-2031
- 10.1. Market Analysis, Insights and Forecast - by Modality
- 10.1.1. Optical Imaging Systems
- 10.1.2. Nuclear Imaging Systems
- 10.1.3. Micro-MRI
- 10.1.4. Micro-ultrasound
- 10.1.5. Micro-CT
- 10.1.6. Photoacoustic Imaging Systems
- 10.1.7. Other Modality
- 10.1. Market Analysis, Insights and Forecast - by Modality
- 11. North America Preclinical Imaging Industry Analysis, Insights and Forecast, 2019-2031
- 11.1. Market Analysis, Insights and Forecast - By Country/Sub-region
- 11.1.1. undefined
- 12. Europe Preclinical Imaging Industry Analysis, Insights and Forecast, 2019-2031
- 12.1. Market Analysis, Insights and Forecast - By Country/Sub-region
- 12.1.1. undefined
- 13. Asia Pacific Preclinical Imaging Industry Analysis, Insights and Forecast, 2019-2031
- 13.1. Market Analysis, Insights and Forecast - By Country/Sub-region
- 13.1.1. undefined
- 14. Middle East and Africa Preclinical Imaging Industry Analysis, Insights and Forecast, 2019-2031
- 14.1. Market Analysis, Insights and Forecast - By Country/Sub-region
- 14.1.1. undefined
- 15. South America Preclinical Imaging Industry Analysis, Insights and Forecast, 2019-2031
- 15.1. Market Analysis, Insights and Forecast - By Country/Sub-region
- 15.1.1. undefined
- 16. Competitive Analysis
- 16.1. Global Market Share Analysis 2024
- 16.2. Company Profiles
- 16.2.1 Mediso Ltd
- 16.2.1.1. Overview
- 16.2.1.2. Products
- 16.2.1.3. SWOT Analysis
- 16.2.1.4. Recent Developments
- 16.2.1.5. Financials (Based on Availability)
- 16.2.2 Trifoil Imaging
- 16.2.2.1. Overview
- 16.2.2.2. Products
- 16.2.2.3. SWOT Analysis
- 16.2.2.4. Recent Developments
- 16.2.2.5. Financials (Based on Availability)
- 16.2.3 Photon etc
- 16.2.3.1. Overview
- 16.2.3.2. Products
- 16.2.3.3. SWOT Analysis
- 16.2.3.4. Recent Developments
- 16.2.3.5. Financials (Based on Availability)
- 16.2.4 Advanced Molecular Vision Inc
- 16.2.4.1. Overview
- 16.2.4.2. Products
- 16.2.4.3. SWOT Analysis
- 16.2.4.4. Recent Developments
- 16.2.4.5. Financials (Based on Availability)
- 16.2.5 Euro-BioImaging ERIC
- 16.2.5.1. Overview
- 16.2.5.2. Products
- 16.2.5.3. SWOT Analysis
- 16.2.5.4. Recent Developments
- 16.2.5.5. Financials (Based on Availability)
- 16.2.6 MR Solutions Ltd
- 16.2.6.1. Overview
- 16.2.6.2. Products
- 16.2.6.3. SWOT Analysis
- 16.2.6.4. Recent Developments
- 16.2.6.5. Financials (Based on Availability)
- 16.2.7 Aspect Imaging Ltd
- 16.2.7.1. Overview
- 16.2.7.2. Products
- 16.2.7.3. SWOT Analysis
- 16.2.7.4. Recent Developments
- 16.2.7.5. Financials (Based on Availability)
- 16.2.8 PerkinElmer Inc
- 16.2.8.1. Overview
- 16.2.8.2. Products
- 16.2.8.3. SWOT Analysis
- 16.2.8.4. Recent Developments
- 16.2.8.5. Financials (Based on Availability)
- 16.2.9 IVIM Technology Corp
- 16.2.9.1. Overview
- 16.2.9.2. Products
- 16.2.9.3. SWOT Analysis
- 16.2.9.4. Recent Developments
- 16.2.9.5. Financials (Based on Availability)
- 16.2.10 Bruker Corporation
- 16.2.10.1. Overview
- 16.2.10.2. Products
- 16.2.10.3. SWOT Analysis
- 16.2.10.4. Recent Developments
- 16.2.10.5. Financials (Based on Availability)
- 16.2.11 AXT PTY LTD
- 16.2.11.1. Overview
- 16.2.11.2. Products
- 16.2.11.3. SWOT Analysis
- 16.2.11.4. Recent Developments
- 16.2.11.5. Financials (Based on Availability)
- 16.2.12 United Imaging Healthcare Co Ltd
- 16.2.12.1. Overview
- 16.2.12.2. Products
- 16.2.12.3. SWOT Analysis
- 16.2.12.4. Recent Developments
- 16.2.12.5. Financials (Based on Availability)
- 16.2.13 Fujifilm Holdings Corporation
- 16.2.13.1. Overview
- 16.2.13.2. Products
- 16.2.13.3. SWOT Analysis
- 16.2.13.4. Recent Developments
- 16.2.13.5. Financials (Based on Availability)
- 16.2.1 Mediso Ltd
List of Figures
- Figure 1: Global Preclinical Imaging Industry Revenue Breakdown (Million, %) by Region 2024 & 2032
- Figure 2: Global Preclinical Imaging Industry Volume Breakdown (K Unit, %) by Region 2024 & 2032
- Figure 3: North America Preclinical Imaging Industry Revenue (Million), by Country 2024 & 2032
- Figure 4: North America Preclinical Imaging Industry Volume (K Unit), by Country 2024 & 2032
- Figure 5: North America Preclinical Imaging Industry Revenue Share (%), by Country 2024 & 2032
- Figure 6: North America Preclinical Imaging Industry Volume Share (%), by Country 2024 & 2032
- Figure 7: Europe Preclinical Imaging Industry Revenue (Million), by Country 2024 & 2032
- Figure 8: Europe Preclinical Imaging Industry Volume (K Unit), by Country 2024 & 2032
- Figure 9: Europe Preclinical Imaging Industry Revenue Share (%), by Country 2024 & 2032
- Figure 10: Europe Preclinical Imaging Industry Volume Share (%), by Country 2024 & 2032
- Figure 11: Asia Pacific Preclinical Imaging Industry Revenue (Million), by Country 2024 & 2032
- Figure 12: Asia Pacific Preclinical Imaging Industry Volume (K Unit), by Country 2024 & 2032
- Figure 13: Asia Pacific Preclinical Imaging Industry Revenue Share (%), by Country 2024 & 2032
- Figure 14: Asia Pacific Preclinical Imaging Industry Volume Share (%), by Country 2024 & 2032
- Figure 15: Middle East and Africa Preclinical Imaging Industry Revenue (Million), by Country 2024 & 2032
- Figure 16: Middle East and Africa Preclinical Imaging Industry Volume (K Unit), by Country 2024 & 2032
- Figure 17: Middle East and Africa Preclinical Imaging Industry Revenue Share (%), by Country 2024 & 2032
- Figure 18: Middle East and Africa Preclinical Imaging Industry Volume Share (%), by Country 2024 & 2032
- Figure 19: South America Preclinical Imaging Industry Revenue (Million), by Country 2024 & 2032
- Figure 20: South America Preclinical Imaging Industry Volume (K Unit), by Country 2024 & 2032
- Figure 21: South America Preclinical Imaging Industry Revenue Share (%), by Country 2024 & 2032
- Figure 22: South America Preclinical Imaging Industry Volume Share (%), by Country 2024 & 2032
- Figure 23: North America Preclinical Imaging Industry Revenue (Million), by Modality 2024 & 2032
- Figure 24: North America Preclinical Imaging Industry Volume (K Unit), by Modality 2024 & 2032
- Figure 25: North America Preclinical Imaging Industry Revenue Share (%), by Modality 2024 & 2032
- Figure 26: North America Preclinical Imaging Industry Volume Share (%), by Modality 2024 & 2032
- Figure 27: North America Preclinical Imaging Industry Revenue (Million), by Country 2024 & 2032
- Figure 28: North America Preclinical Imaging Industry Volume (K Unit), by Country 2024 & 2032
- Figure 29: North America Preclinical Imaging Industry Revenue Share (%), by Country 2024 & 2032
- Figure 30: North America Preclinical Imaging Industry Volume Share (%), by Country 2024 & 2032
- Figure 31: Europe Preclinical Imaging Industry Revenue (Million), by Modality 2024 & 2032
- Figure 32: Europe Preclinical Imaging Industry Volume (K Unit), by Modality 2024 & 2032
- Figure 33: Europe Preclinical Imaging Industry Revenue Share (%), by Modality 2024 & 2032
- Figure 34: Europe Preclinical Imaging Industry Volume Share (%), by Modality 2024 & 2032
- Figure 35: Europe Preclinical Imaging Industry Revenue (Million), by Country 2024 & 2032
- Figure 36: Europe Preclinical Imaging Industry Volume (K Unit), by Country 2024 & 2032
- Figure 37: Europe Preclinical Imaging Industry Revenue Share (%), by Country 2024 & 2032
- Figure 38: Europe Preclinical Imaging Industry Volume Share (%), by Country 2024 & 2032
- Figure 39: Asia Pacific Preclinical Imaging Industry Revenue (Million), by Modality 2024 & 2032
- Figure 40: Asia Pacific Preclinical Imaging Industry Volume (K Unit), by Modality 2024 & 2032
- Figure 41: Asia Pacific Preclinical Imaging Industry Revenue Share (%), by Modality 2024 & 2032
- Figure 42: Asia Pacific Preclinical Imaging Industry Volume Share (%), by Modality 2024 & 2032
- Figure 43: Asia Pacific Preclinical Imaging Industry Revenue (Million), by Country 2024 & 2032
- Figure 44: Asia Pacific Preclinical Imaging Industry Volume (K Unit), by Country 2024 & 2032
- Figure 45: Asia Pacific Preclinical Imaging Industry Revenue Share (%), by Country 2024 & 2032
- Figure 46: Asia Pacific Preclinical Imaging Industry Volume Share (%), by Country 2024 & 2032
- Figure 47: Middle East and Africa Preclinical Imaging Industry Revenue (Million), by Modality 2024 & 2032
- Figure 48: Middle East and Africa Preclinical Imaging Industry Volume (K Unit), by Modality 2024 & 2032
- Figure 49: Middle East and Africa Preclinical Imaging Industry Revenue Share (%), by Modality 2024 & 2032
- Figure 50: Middle East and Africa Preclinical Imaging Industry Volume Share (%), by Modality 2024 & 2032
- Figure 51: Middle East and Africa Preclinical Imaging Industry Revenue (Million), by Country 2024 & 2032
- Figure 52: Middle East and Africa Preclinical Imaging Industry Volume (K Unit), by Country 2024 & 2032
- Figure 53: Middle East and Africa Preclinical Imaging Industry Revenue Share (%), by Country 2024 & 2032
- Figure 54: Middle East and Africa Preclinical Imaging Industry Volume Share (%), by Country 2024 & 2032
- Figure 55: South America Preclinical Imaging Industry Revenue (Million), by Modality 2024 & 2032
- Figure 56: South America Preclinical Imaging Industry Volume (K Unit), by Modality 2024 & 2032
- Figure 57: South America Preclinical Imaging Industry Revenue Share (%), by Modality 2024 & 2032
- Figure 58: South America Preclinical Imaging Industry Volume Share (%), by Modality 2024 & 2032
- Figure 59: South America Preclinical Imaging Industry Revenue (Million), by Country 2024 & 2032
- Figure 60: South America Preclinical Imaging Industry Volume (K Unit), by Country 2024 & 2032
- Figure 61: South America Preclinical Imaging Industry Revenue Share (%), by Country 2024 & 2032
- Figure 62: South America Preclinical Imaging Industry Volume Share (%), by Country 2024 & 2032
List of Tables
- Table 1: Global Preclinical Imaging Industry Revenue Million Forecast, by Region 2019 & 2032
- Table 2: Global Preclinical Imaging Industry Volume K Unit Forecast, by Region 2019 & 2032
- Table 3: Global Preclinical Imaging Industry Revenue Million Forecast, by Modality 2019 & 2032
- Table 4: Global Preclinical Imaging Industry Volume K Unit Forecast, by Modality 2019 & 2032
- Table 5: Global Preclinical Imaging Industry Revenue Million Forecast, by Region 2019 & 2032
- Table 6: Global Preclinical Imaging Industry Volume K Unit Forecast, by Region 2019 & 2032
- Table 7: Global Preclinical Imaging Industry Revenue Million Forecast, by Country 2019 & 2032
- Table 8: Global Preclinical Imaging Industry Volume K Unit Forecast, by Country 2019 & 2032
- Table 9: Global Preclinical Imaging Industry Revenue Million Forecast, by Country 2019 & 2032
- Table 10: Global Preclinical Imaging Industry Volume K Unit Forecast, by Country 2019 & 2032
- Table 11: Global Preclinical Imaging Industry Revenue Million Forecast, by Country 2019 & 2032
- Table 12: Global Preclinical Imaging Industry Volume K Unit Forecast, by Country 2019 & 2032
- Table 13: Global Preclinical Imaging Industry Revenue Million Forecast, by Country 2019 & 2032
- Table 14: Global Preclinical Imaging Industry Volume K Unit Forecast, by Country 2019 & 2032
- Table 15: Global Preclinical Imaging Industry Revenue Million Forecast, by Country 2019 & 2032
- Table 16: Global Preclinical Imaging Industry Volume K Unit Forecast, by Country 2019 & 2032
- Table 17: Global Preclinical Imaging Industry Revenue Million Forecast, by Modality 2019 & 2032
- Table 18: Global Preclinical Imaging Industry Volume K Unit Forecast, by Modality 2019 & 2032
- Table 19: Global Preclinical Imaging Industry Revenue Million Forecast, by Country 2019 & 2032
- Table 20: Global Preclinical Imaging Industry Volume K Unit Forecast, by Country 2019 & 2032
- Table 21: United States Preclinical Imaging Industry Revenue (Million) Forecast, by Application 2019 & 2032
- Table 22: United States Preclinical Imaging Industry Volume (K Unit) Forecast, by Application 2019 & 2032
- Table 23: Canada Preclinical Imaging Industry Revenue (Million) Forecast, by Application 2019 & 2032
- Table 24: Canada Preclinical Imaging Industry Volume (K Unit) Forecast, by Application 2019 & 2032
- Table 25: Mexico Preclinical Imaging Industry Revenue (Million) Forecast, by Application 2019 & 2032
- Table 26: Mexico Preclinical Imaging Industry Volume (K Unit) Forecast, by Application 2019 & 2032
- Table 27: Global Preclinical Imaging Industry Revenue Million Forecast, by Modality 2019 & 2032
- Table 28: Global Preclinical Imaging Industry Volume K Unit Forecast, by Modality 2019 & 2032
- Table 29: Global Preclinical Imaging Industry Revenue Million Forecast, by Country 2019 & 2032
- Table 30: Global Preclinical Imaging Industry Volume K Unit Forecast, by Country 2019 & 2032
- Table 31: Germany Preclinical Imaging Industry Revenue (Million) Forecast, by Application 2019 & 2032
- Table 32: Germany Preclinical Imaging Industry Volume (K Unit) Forecast, by Application 2019 & 2032
- Table 33: United Kingdom Preclinical Imaging Industry Revenue (Million) Forecast, by Application 2019 & 2032
- Table 34: United Kingdom Preclinical Imaging Industry Volume (K Unit) Forecast, by Application 2019 & 2032
- Table 35: France Preclinical Imaging Industry Revenue (Million) Forecast, by Application 2019 & 2032
- Table 36: France Preclinical Imaging Industry Volume (K Unit) Forecast, by Application 2019 & 2032
- Table 37: Italy Preclinical Imaging Industry Revenue (Million) Forecast, by Application 2019 & 2032
- Table 38: Italy Preclinical Imaging Industry Volume (K Unit) Forecast, by Application 2019 & 2032
- Table 39: Spain Preclinical Imaging Industry Revenue (Million) Forecast, by Application 2019 & 2032
- Table 40: Spain Preclinical Imaging Industry Volume (K Unit) Forecast, by Application 2019 & 2032
- Table 41: Rest of Europe Preclinical Imaging Industry Revenue (Million) Forecast, by Application 2019 & 2032
- Table 42: Rest of Europe Preclinical Imaging Industry Volume (K Unit) Forecast, by Application 2019 & 2032
- Table 43: Global Preclinical Imaging Industry Revenue Million Forecast, by Modality 2019 & 2032
- Table 44: Global Preclinical Imaging Industry Volume K Unit Forecast, by Modality 2019 & 2032
- Table 45: Global Preclinical Imaging Industry Revenue Million Forecast, by Country 2019 & 2032
- Table 46: Global Preclinical Imaging Industry Volume K Unit Forecast, by Country 2019 & 2032
- Table 47: China Preclinical Imaging Industry Revenue (Million) Forecast, by Application 2019 & 2032
- Table 48: China Preclinical Imaging Industry Volume (K Unit) Forecast, by Application 2019 & 2032
- Table 49: Japan Preclinical Imaging Industry Revenue (Million) Forecast, by Application 2019 & 2032
- Table 50: Japan Preclinical Imaging Industry Volume (K Unit) Forecast, by Application 2019 & 2032
- Table 51: India Preclinical Imaging Industry Revenue (Million) Forecast, by Application 2019 & 2032
- Table 52: India Preclinical Imaging Industry Volume (K Unit) Forecast, by Application 2019 & 2032
- Table 53: Australia Preclinical Imaging Industry Revenue (Million) Forecast, by Application 2019 & 2032
- Table 54: Australia Preclinical Imaging Industry Volume (K Unit) Forecast, by Application 2019 & 2032
- Table 55: South Korea Preclinical Imaging Industry Revenue (Million) Forecast, by Application 2019 & 2032
- Table 56: South Korea Preclinical Imaging Industry Volume (K Unit) Forecast, by Application 2019 & 2032
- Table 57: Rest of Asia Pacific Preclinical Imaging Industry Revenue (Million) Forecast, by Application 2019 & 2032
- Table 58: Rest of Asia Pacific Preclinical Imaging Industry Volume (K Unit) Forecast, by Application 2019 & 2032
- Table 59: Global Preclinical Imaging Industry Revenue Million Forecast, by Modality 2019 & 2032
- Table 60: Global Preclinical Imaging Industry Volume K Unit Forecast, by Modality 2019 & 2032
- Table 61: Global Preclinical Imaging Industry Revenue Million Forecast, by Country 2019 & 2032
- Table 62: Global Preclinical Imaging Industry Volume K Unit Forecast, by Country 2019 & 2032
- Table 63: GCC Preclinical Imaging Industry Revenue (Million) Forecast, by Application 2019 & 2032
- Table 64: GCC Preclinical Imaging Industry Volume (K Unit) Forecast, by Application 2019 & 2032
- Table 65: South Africa Preclinical Imaging Industry Revenue (Million) Forecast, by Application 2019 & 2032
- Table 66: South Africa Preclinical Imaging Industry Volume (K Unit) Forecast, by Application 2019 & 2032
- Table 67: Rest of Middle East and Africa Preclinical Imaging Industry Revenue (Million) Forecast, by Application 2019 & 2032
- Table 68: Rest of Middle East and Africa Preclinical Imaging Industry Volume (K Unit) Forecast, by Application 2019 & 2032
- Table 69: Global Preclinical Imaging Industry Revenue Million Forecast, by Modality 2019 & 2032
- Table 70: Global Preclinical Imaging Industry Volume K Unit Forecast, by Modality 2019 & 2032
- Table 71: Global Preclinical Imaging Industry Revenue Million Forecast, by Country 2019 & 2032
- Table 72: Global Preclinical Imaging Industry Volume K Unit Forecast, by Country 2019 & 2032
- Table 73: Brazil Preclinical Imaging Industry Revenue (Million) Forecast, by Application 2019 & 2032
- Table 74: Brazil Preclinical Imaging Industry Volume (K Unit) Forecast, by Application 2019 & 2032
- Table 75: Argentina Preclinical Imaging Industry Revenue (Million) Forecast, by Application 2019 & 2032
- Table 76: Argentina Preclinical Imaging Industry Volume (K Unit) Forecast, by Application 2019 & 2032
- Table 77: Rest of South America Preclinical Imaging Industry Revenue (Million) Forecast, by Application 2019 & 2032
- Table 78: Rest of South America Preclinical Imaging Industry Volume (K Unit) Forecast, by Application 2019 & 2032
Frequently Asked Questions
1. What is the projected Compound Annual Growth Rate (CAGR) of the Preclinical Imaging Industry?
The projected CAGR is approximately 6.00%.
2. Which companies are prominent players in the Preclinical Imaging Industry?
Key companies in the market include Mediso Ltd, Trifoil Imaging, Photon etc, Advanced Molecular Vision Inc, Euro-BioImaging ERIC, MR Solutions Ltd, Aspect Imaging Ltd, PerkinElmer Inc, IVIM Technology Corp , Bruker Corporation, AXT PTY LTD, United Imaging Healthcare Co Ltd, Fujifilm Holdings Corporation.
3. What are the main segments of the Preclinical Imaging Industry?
The market segments include Modality.
4. Can you provide details about the market size?
The market size is estimated to be USD XX Million as of 2022.
5. What are some drivers contributing to market growth?
Technological Advancements in Molecular Imaging; Increasing Demand for Non-invasive Small Animal Imaging Techniques; Increase in Preclinical Research Funding. by Both Private and Public Organizations.
6. What are the notable trends driving market growth?
Micro-Ultrasound is the Segment by Modality and is Expected to be the Fastest Growing Market.
7. Are there any restraints impacting market growth?
Strict Regulations in Preclinical Research; High Installation and Operational Costs associated with Preclinical Imaging Modalities.
8. Can you provide examples of recent developments in the market?
In May 2022, Bruker launched innovative 7 Tesla and 9.4 Tesla conduction-cooled Maxwell magnets for its market-leading preclinical magnetic resonance imaging (MRI) systems portfolio.
9. What pricing options are available for accessing the report?
Pricing options include single-user, multi-user, and enterprise licenses priced at USD 4750, USD 5250, and USD 8750 respectively.
10. Is the market size provided in terms of value or volume?
The market size is provided in terms of value, measured in Million and volume, measured in K Unit.
11. Are there any specific market keywords associated with the report?
Yes, the market keyword associated with the report is "Preclinical Imaging Industry," which aids in identifying and referencing the specific market segment covered.
12. How do I determine which pricing option suits my needs best?
The pricing options vary based on user requirements and access needs. Individual users may opt for single-user licenses, while businesses requiring broader access may choose multi-user or enterprise licenses for cost-effective access to the report.
13. Are there any additional resources or data provided in the Preclinical Imaging Industry report?
While the report offers comprehensive insights, it's advisable to review the specific contents or supplementary materials provided to ascertain if additional resources or data are available.
14. How can I stay updated on further developments or reports in the Preclinical Imaging Industry?
To stay informed about further developments, trends, and reports in the Preclinical Imaging Industry, consider subscribing to industry newsletters, following relevant companies and organizations, or regularly checking reputable industry news sources and publications.
Methodology
Step 1 - Identification of Relevant Samples Size from Population Database


Step 2 - Approaches for Defining Global Market Size (Value, Volume* & Price*)

Note*: In applicable scenarios
Step 3 - Data Sources
Primary Research
- Web Analytics
- Survey Reports
- Research Institute
- Latest Research Reports
- Opinion Leaders
Secondary Research
- Annual Reports
- White Paper
- Latest Press Release
- Industry Association
- Paid Database
- Investor Presentations

Step 4 - Data Triangulation
Involves using different sources of information in order to increase the validity of a study
These sources are likely to be stakeholders in a program - participants, other researchers, program staff, other community members, and so on.
Then we put all data in single framework & apply various statistical tools to find out the dynamic on the market.
During the analysis stage, feedback from the stakeholder groups would be compared to determine areas of agreement as well as areas of divergence
